
Bathymetric Survey for Estimating the Local Scour at Suramadu
Bridge
Octavia Prihanesti Kartika Rini
1
, Suntoyo
1
and Aditya Kusumadinata
2
1
Department of Ocean Engineering, Institut Teknologi Sepuluh Nopember, Surabaya, Indonesia
2
Ministry of Public Work and Housing, Directorate General of Highway, Jakarta, Indonesia
Keywords: Bathymetri, SBES, MBES, Scouring.
Abstract: The Suramadu Bridge is the longest bridge in Indonesia, located at Madura Strait causes an increase in the
speed of ocean currents as well as obstacles to seawater flow acceleration of ocean currents due to the reduce
of the wet cross-sectional area of seawater flow. This influence cause changes in the seabed bathymetry along
the Suramadu Bridge and the potential for local scouring on the bridge foundation. In dangerous stage of
scouring, can affect the stability and carrying capacity of the foundation structure under the bridge. The
Suramadu Bridge has operated since 2009, has been almost 10 years, and bathymetric surveys is needed to
ensure the actual conditions on the seabed under the Bridge. The purpose of the bathymetric survey activity
is to obtain the latest bathymetric data and the scouring patterns arround the main pillar (P46 and P47) of the
Suramadu Bridge. The Bathymetric Survey method used are SBES and MBES. The first Bathymetric survey
was obtained at the year of 2016 since the bridge had operated, shows that the scouring was indicated at the
main pillar the increase is about 7 – 8 m. Based on the bathimetric survey data of the 2017, shows the scouring
is increased is about 1 meter below the result of bathymetric survey of 2016 at the seabed in the main bridge.
1 BACKGROUND
Many bridges around the world failed or damaged
because of extreme scour around piers and abutments.
Any constructed bridges must be continuously
monitored for any changes in the structure of the
bridges that usually focus on the changes of the soil
in the area of the bridges constructed. The typical
changes can be seen is from the bridge scouring or in
this case (Akib, 2011).
Suramadu Bridge is located in the northern part of
East Java Province, Indonesia. With an overall length
of 5.4 km, it spans Madura Straits and connects
Surabaya and Madura Island (Jatnika et al, 2006).
Suramadu Bridge in Madura Strait reduces the wet
cross sectional area of sea water, increase the ocean
current speed and acceleration. The seabed along
Suramadu Bridge can be change after more than 10
years after the last study of bathymetri in 2005.
Scour is a natural phenomenon caused by the
erosive action of flowing water on the bed and banks
of alluvial channels. The local flow around a
hydraulic structure such as a bridge pier or abutment
is associated with an enhanced sediment-carrying
capacity, such that scour may occur near a structure
even when there is no transport of sediment away
from the structure. At a bridge site, scour around
bridge piers or abutments may lead to reduced
support and hence constitute a potential catastrophic
hazard (Masjedi, 2010).
Scour is local lowering of streambed elevation
that takes place around structures that are constructed
in flowing water (Akib et al, 2014). Local scour is the
removal of sediment from around bridge piers due to
flowing of water. A large amount of local scour is
dangerous to the bridge piers and causes the structure
tend to collapse and loss of life without any warning
(Ahmad et al, 2016).
Local scour around a bridge pier is largely
depending on the shape of the bridge pier and how the
design is fashionable from the view of construction.
Local scour is a complex phenomenon which depends
on the discharge, depth of flow, geometry of the pier
and type of sediment particle (Roy, 2017).
Scouring depth assessment for Approach Bridge
and Main Bridge of Suramadu Bridge for a 20-year
return period carried out in 2005 for pier foundation
P37 - P56 by Yu (2005) from the Department of
Hydraulic Engineering of Tsinghua University Figure
1 and Table 1. In 2016 was the first study of
Bathymetri on Suramadu Bridge by Bathymetry
Consultans was hired by Ministry Of Public Work
Kartika Rini, O., Suntoyo, . and Kusumadinata, A.
Bathymetric Survey for Estimating the Local Scour at Suramadu Bridge.
DOI: 10.5220/0010287002630270
In Proceedings of the 7th International Seminar on Ocean and Coastal Engineering, Environmental and Natural Disaster Management (ISOCEEN 2019), pages 263-270
ISBN: 978-989-758-516-6
Copyright
c
2021 by SCITEPRESS – Science and Technology Publications, Lda. All rights reserved
263

and Housing, and the result was the local scouring 7
– 8 meters at the main pilars (P.46 and P.47). So, that
to ensure that the scheme of local scouring not
damaged the bridge, in 2017 the survey of
Bathymetry was continued by Bathymetry
Consultans was hired by Ministry of Public Work and
Housing.
The location of activities was along the Suramadu
Bridge corridor and around the main pillar (P46 -
P47) with a corridor width of 500 m to the left and
right of the bridge. Conduct a detailed bathymetry
survey along the Suramadu Bridge corridor and
around the main pillar (P46 - P47) with corridor width
of 1 km.
Figure 1: Maximum Scouring Depth on Pier 37 - Pier 56 of
Suramadu Bridge for a 20-Year Period Based on 2005
Study Results.
Table 1: Scour depth at major piers under tide with 100-
year return period.
Pier
Number
Scour
depth
(m)
Pier
Number
Scour
depth
(m)
Pier
Number
Scour
depth
(m)
Pier
Number
Scour
depth
(m)
P37 8,35 P42 8,94 P47 11,36 P52 6,16
P38 8,79 P43 7,41 P48 8,9 P53 5,28
P39 9,27 P44 6,7 P49 5,34 P54 5,19
P40 8,88 P45 10,2 P50 5,35 P55 5,09
P41 9,42 P46 11,5 P51 6,17 P56 4,99
The purpose of the bathymetry survey activity is
to obtain data on the latest bathymetry conditions and
scouring patterns in the main pillar of the Suramadu
Bridge. In addition, this paper gives recommendation
and mitigation if needed. Protecting the bridge piers
against scour is a crucial step to preventing bridge
failure because there is a close relationship between
bridge failure and scour at bridge foundations (Tang
et al, 2009).
2 METHOD
2.1 Data Collection
Bathymetry is a method or technique in determining
sea-depth or seabed profile from the result of sea-
depth analysis (Anugroho et al, 2017). From late 2017
the survey using Single Beam Echo Sounder (SBES)
and Multi Beam Echo Sounder (MBES). Survey
location along Suramadu Bridge with corridor width
of 1 km (500 meters to the right and left side of the
bridge). Tide measurements carried out at these
locations used for correction when carrying out
bathymetry measurements.
Data processing of multibeam depth survey
results was carried out using Qinsy software and
single beam echo sounder was processed using Hydro
pro navEdit and Terramodel software. The License of
the software was licensed to Bathymetry Consultant
that hired by Ministry of Public Works and Housing.
And the Author was a part of Bathymetry Consultant
Members.
2.2 Determination of Bench Mark
(BM)
This survey started with data collection. The first data
in this study is determine of Bench-Mark (BM) points
as measurement reference points that represent the
bridge spans and survey corridors. Mapping changes
in seabed elevation along the Suramadu Bridge,
especially in the area around the bridge foundation.
The navigation system used to determine the
position of moving objects such as ships when
conducting bathymetry surveys known as DGPS
(Differential GPS). This differential correction can
either be a pseudo range correction (such as RTCM
SC-104) or coordinate correction. With differential
correction, the coordinates obtained have relatively
higher horizontal position accuracy compared to the
absolute method (Abidin, 2000).
2.3 Bathymetry Survey
According to IHO (International Hidrographic
Organization), the bathymetry survey is "measured or
charted depth of water or the measurement of such
depth". Tides also affect the survey due to sea level
variations, so tidal observations needed to reduce the
results of the survey on the dynamics of the seawater
(Rinaldy et al, 2014).
Sounding is one of the methods of determining
depth using the principle of the reflection of an
aquatic wave (Qhomariyah and Yuwono, 2016). The
device used for this activity is echo sounder. The
using of this device is an indirect measurement of
depth by measuring the travel time of acoustic wave
pulses emitted by Transducer (Figure 2).
ISOCEEN 2019 - The 7th International Seminar on Ocean and Coastal Engineering, Environmental and Natural Disaster Management
264
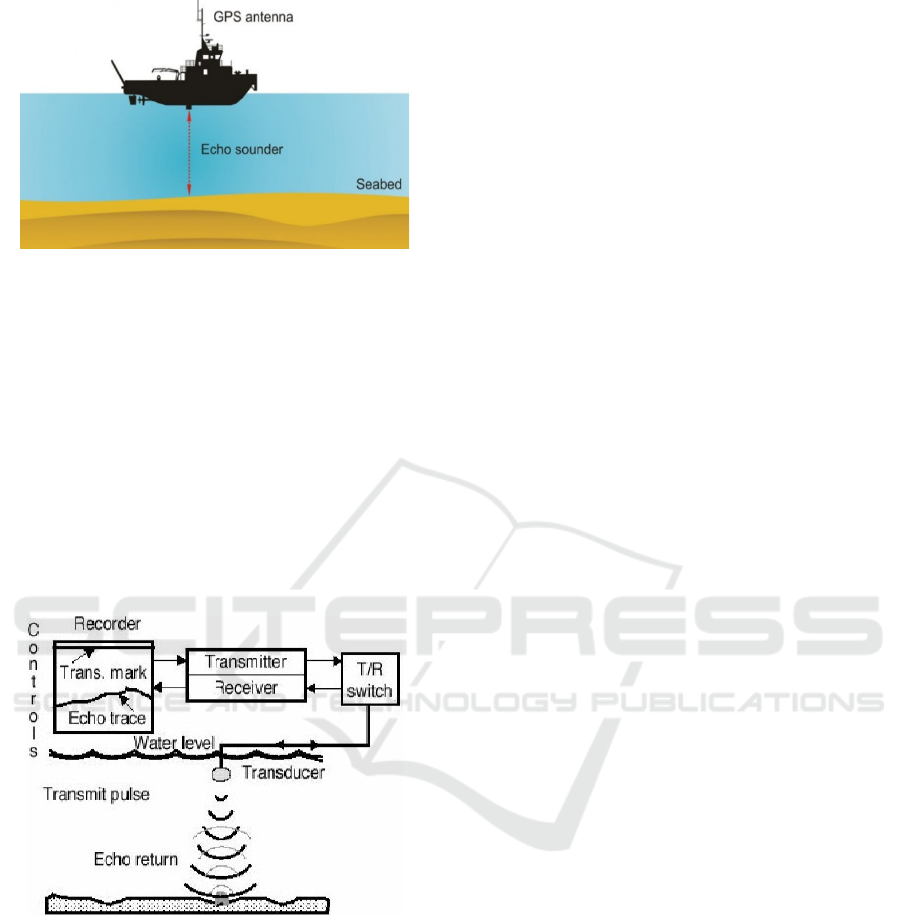
Figure 2: Bathymetri Measurement.
Bathymetry surveys use a combination of Multi-
Beam Echo sounder (MBES), is a survey equipment
for areas > 3 m deep and Single-Beam Echo sounders
(SBES) for areas < 3 m deep with 100% coverage for
locations near bridge foundations. Using Real Time
Kinematic (RTK) Global Positioning System (GPS)
equipment.
Bathymetry surveys carried out using a
combination of Single beam Echo sounder (SBES)
and Multi beam Echo sounder (MBES) equipment.
Furthermore, SBES and MBES work methods and
work principles explained in the following sub-
chapters:
Figure 3: Echo Sounder Working Principle.
Acoustic waves with a frequency of 5 kHz or 100
Hz will maintain their intensity loss to less than 10%
at a depth of 10 km, while acoustic waves with a
frequency of 500 kHz will lose their intensity at
depths of less than 100 m. The principle of this
method is distance measurement by utilizing acoustic
waves emitted from the transducer (transmitter). A
transducer is a part of an echo technology device that
converts electrical energy into mechanics (to generate
sound waves) and vice versa. Acoustic waves travel
through the water to the seabed and reflected back to
the transducer (received by the receiver).
Bathymetry measurements influenced by the
dynamics of seawater media in the form of tides,
making it very difficult to determine the same object
at different times. Thus on the measurement of the
depth of the seabed it is necessary to do three
measurements at the same time, namely the
measurement of the depth, the measurement of the
position of the depth measuring instrument and the
measurement of tides.
2.4 Determine of Point Control
The control points used in the bathymetry survey
activities along the Suramadu Bridge were
determined using BM VKS2. The use of this control
point is intended as a verification point for
Differential GPS that is used as a horizontal
positioning system or navigation during the survey.
Here are the results obtained.
Point Name : BM VKS2
Stipulated by : BPPT
Location Point : Tambak Wedi Surabaya
Geodetic coordinates
WGS 84
Latitude : 7 ° 12 '29,201 "S
Longitude : 112 ° 46 '40,130 "E
UTM Zone (Zone 49S)
East : 696303,803
North : 9202862,814
Point Condition : Good
Verification of the coordinates obtained from the
VSPS Hemisphere VS330 positioning system is
carried out against the BM VKS2 Benchmark
coordinates located on the west side of the Suramadu
Bridge in Tambak Wedi. Verification was carried out
on September 13, 2017 before the start of water depth
measurements.
This verification is intended to ensure that the
position system used, including the geodetic
parameter system entered in the navigation software
is in accordance with the coordinate system and the
position value of the coordinates of the control points.
If the difference between the coordinates is more than
the tolerance required, then the equipment used must
be replaced or calibration must be repeated while
ensuring that there are no wrong parameters in the
software used.
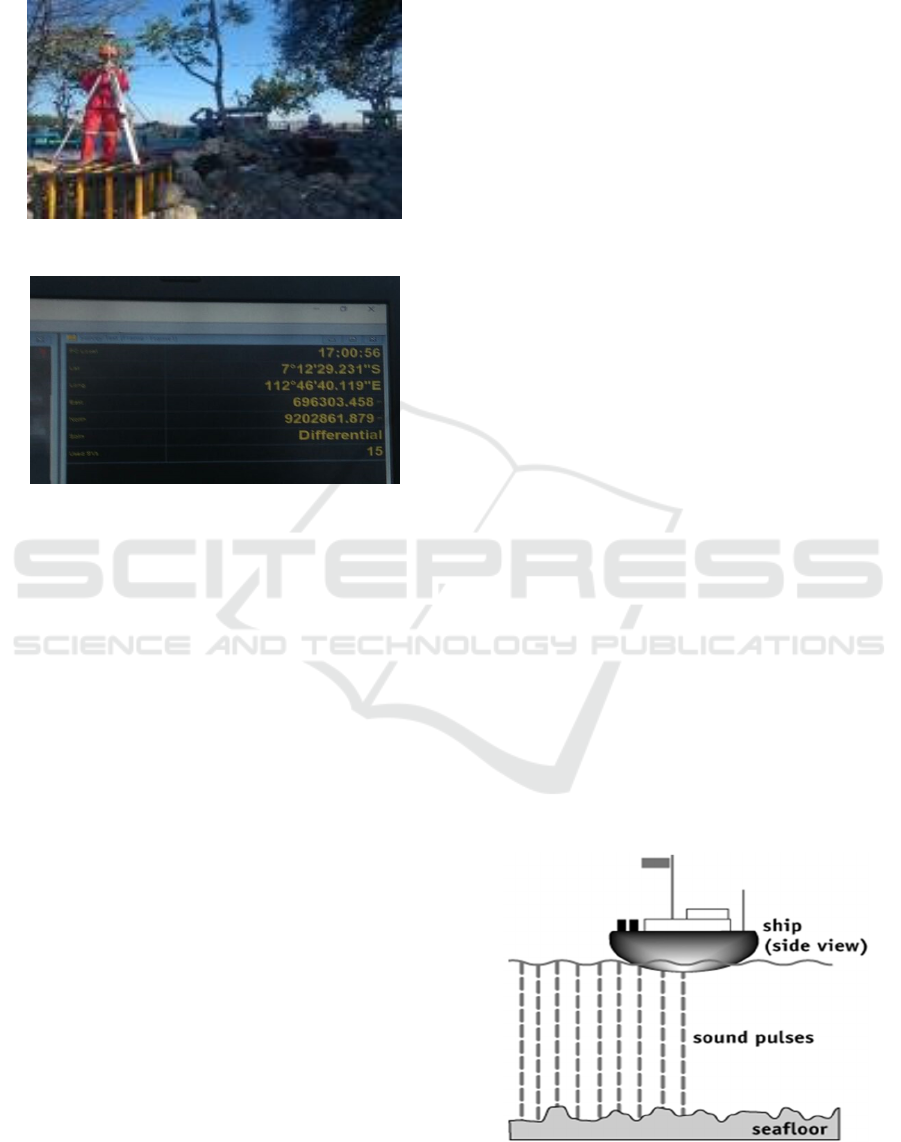
The DGPS antenna is placed above the existing
control point, then the coordinates obtained from the
position of this antenna are recorded in the navigation
software that is used for approximately one hour with
an observation interval every 5 seconds (Figure 3 and
4). The coordinate data obtained are then averaged
Bathymetric Survey for Estimating the Local Scour at Suramadu Bridge
265
and the results are compared with the coordinates of
the existing control points.
Figure 4: Determine Point Control.
Figure 5: Output of Determine Point Control.
2.5 Singlebeam Echosounder
Single beam echo sounder is a measurement device
that uses a single beam as the sender and receiver of
sound wave signals. The working principle of SBES
is to use the principle of measuring the phase
difference in pulses, which is calculating the time
difference from the time of the emission and
reception of the acoustic pulses. SBES is also quite
accurate, where SBES is able to provide accuracy to
0.1 meters at depths of less than 100 meters
(Lekkerkerk et al, 2006).
Bathymetry systems using a single beam generally
have an arrangement: a transducer (transmitter/
receiver) mounted on the hull or the bearing side of the
ship. This system measures the depth of water directly
from the inquiry vessel. Transmitter mounted on the
hull sends acoustic pulses with high frequency
contained in the beam (sound waves) directly down the
water column. The receiver will capture acoustic
energy emitted from the transmitter.
The data obtained from the process is the time
interval the waves begin to emit and the waves
received again, so that the depth data obtained by the
recording device is a function of the time interval. The
process described in the equation (Poerbandono et al,
2005):
𝑑 ½ 𝑣𝛥𝑡 (1)
Where :
d : see water level (m)
v(t) : sound wave velocity (m/s)
Δt : interval (s)
Transceiver consists of a transmitter that has a
function as a control of the wavelength of the emitted
pulse and provides electrical power for a given
frequency and the receiver receives repeatedly
reflected waves at high speeds, up to the order of the
speed of the millisecond. Continuous water depth
recording from under the ship results in a high-
resolution depth measurement along the surveyed lane.
The single beam echo sounder used to make 3D
combined with the physical surface of the base
location, the physical surface of the seabed location,
which used to conduct preliminary surveys before
using multiband sonar. Single beam echo sounder
consists of two types, namely:
a. Single frequency is a single echo sounder that
uses only one frequency, namely high
frequency.
b. Dual frequency is a single echo sounder that
uses two frequencies, namely high frequency
and low frequency. High frequency provides
more accurate depth in relation to shipping
safety, while low frequency is able to penetrate
into the seabed mud deep) so it is not safe for
shipping.
The frequency range used in this system
according to the WHSC (Woods Hole Science
Centre) Sea-floor Mapping Group operates the
frequency range from 3.5 Hz to 200 kHz. Single beam
echo sounder is relatively easy to use, but this device
only provides depth information along the track line
traversed by the ship. This activity the use of Single
beam Echo sounder (SBES) for areas that covered by
Multiband Echo sounder (MBES) because, the ship is
less than the minimum MBES operation.
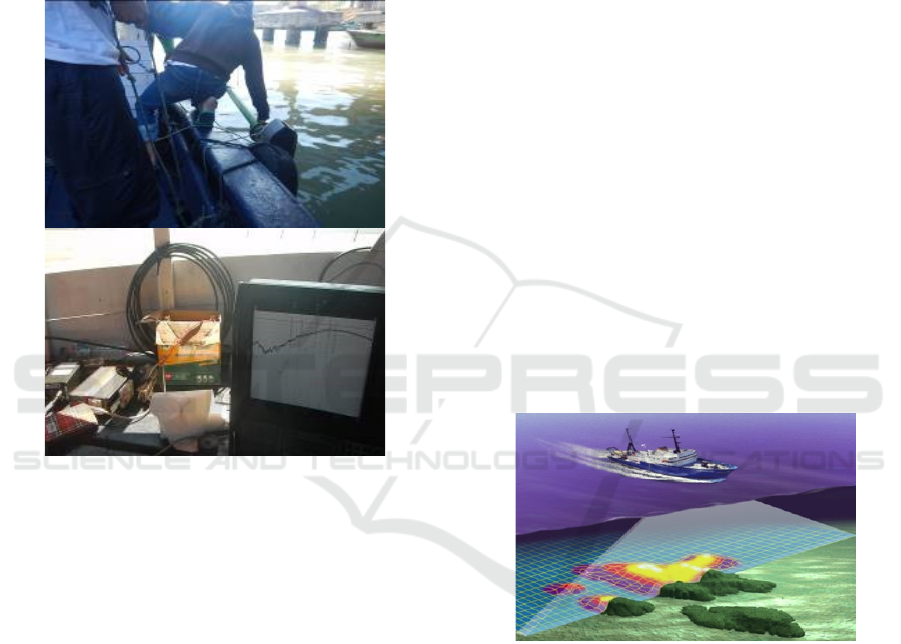
Figure 6: Bathymetry SBES Method.
ISOCEEN 2019 - The 7th International Seminar on Ocean and Coastal Engineering, Environmental and Natural Disaster Management
266
Correction for bathymetry measurements by the
SBES method with the following equation:
D = Du + s – h + BC (2)
Where :
D : definitive of hight
Du : echosounder water level measuring
s : transducer
h : water level hight
BC : barcheck correction
Figure 7: Echo sounder SBES Filed Survey.
2.6 Multibeam Echosounder
Multi beam Echo Sounder (MBES) is a used in
seafloor mapping alng with a Single Beam Echo
Sounder (SBES). MBES can measure a wider range
of water depths and can acquire high resolution
images simultaneousley through the beamforming
process. (Jung et al, 2017).
Multi beam sonar (MBS) technology developed
to examine in detail large stretches of the seafloor
surface, providing accurately positioned and
excellent 2-D and 3-D images of features as small as
a few centimetres or covering areas as large as
hundreds of square meters (Stanley et al, 2011).
The principle of operation of this device based on
the sound beam (beam) that emitted and reflected
directly toward the seabed, and captured again
through sensors that are on the MBES device. The
detection algorithm on the seabed, to determine the
depth and distance of the transversal, calculates the
two-way propagation time between sending and
receiving. Multi beam Echo sounder can produce
bathymetry data with high resolution.
Unlike the side, scan sonar beam pattern that
owned by MBES it widens and crosses the hull. Each
beam emits one sound pulse and has its own
reception. When the ship moves, the MBES sweep
results in an area of the seabed surface area (Moustier,
2005).
The transducer contained in the multi beam sonar
consists of a series of elements that emit sound pulses
at different angles. Usually only one beam is
transmitted but it produces a lot of reflected energy
from each of the transmitted sound pulses. The ability
of each transducer element to reclaim the reflected
sound pulse depends on the calibration method of the
ship's motion applied.
This MBES has excellent accuracy in measuring
depth. In addition to having excellent accuracy, the
advantage of using this MBES is a wide range of
measurement areas (Moustier, 2005). Coverage of the
seabed area that surveyed by ships using multi beam
in one sweep is called swath. The swath width for
each type of multi beam echo sounder can vary.
The principle of MBES is roughly the same as
measurement devices that use acoustic waves, such as
SBES and sonar side scans, which is simply by
emitting acoustic waves through its reflected wave
transmitter.
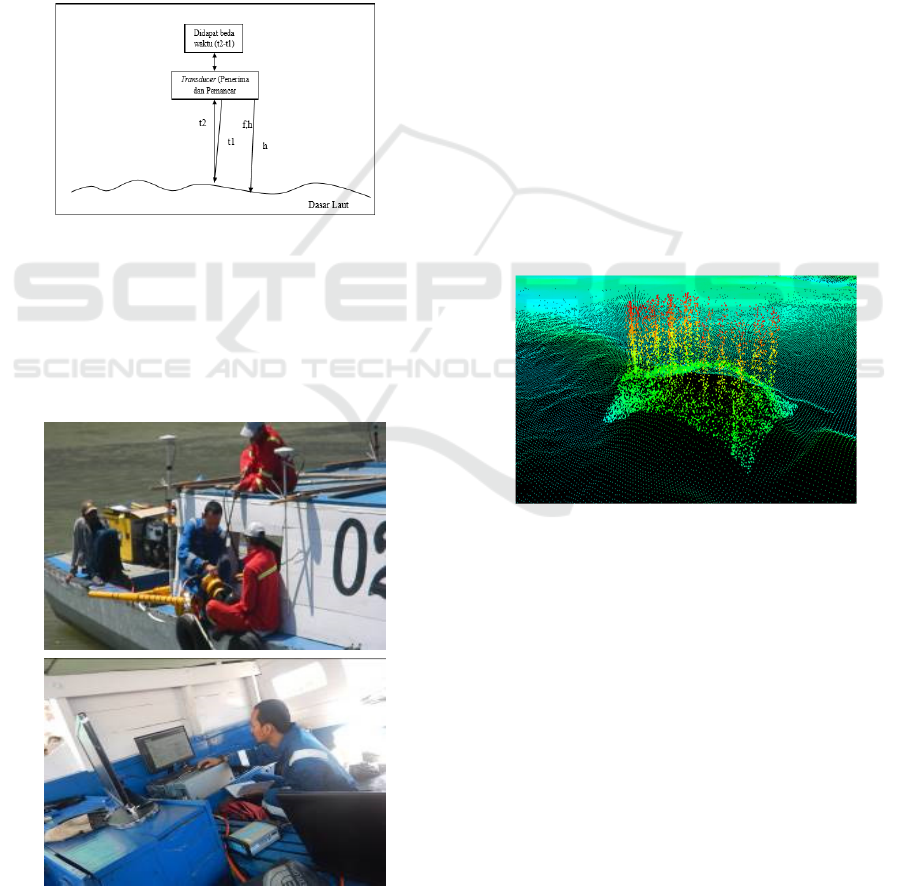
Figure 8: Bathymetry MBES Method.
Then measure the time difference between the
waves when the initial emitted until the reflection of
the wave is captured again by the sensor. With the
previously determined speed of sound propagation in
the study area, so that it can be calculated the depth
of the seabed.
Transducer configuration is a combination of
several projectors arranged like an array (matrix). The
projector is part of the MBES transducer which
functions as a channel to emit acoustic pulses towards
the seabed. All acoustic signals from all directions
reflecting objects on the seabed will be received again
by the hydrophone array. All acoustic signals will be
Bathymetric Survey for Estimating the Local Scour at Suramadu Bridge
267
received by each hydrophone simultaneously with a
difference in time of reception of 4/3 to 8/3 mill
seconds depending on the length and duration of the
acoustic signal.
In general, MBES uses interferometric techniques
to detect the direction of reflected waves as a function
of time. By using the accumulation of acoustic signals
received on two separate arrays, an interference
pattern will be formed.
Based on the existing relationship a direction will
be determined. When this information is combined
with distance, depth data will be generated (Sasmita,
2008). The geometrical image of the acoustic waves
emitted by MBES can be seen in Figure 7.
Figure 9: Transducer Mechnisme.
The phase difference of pulses in MBES means
that it is a function of the difference between the
transmitting and receiving time phases. Then the
calculation of the travel time and direction of the
beam angle of each stave is determined from the
measurement of the MBES pulse phase difference.
Figure 10: Echo sounder MBES Field Survey.
3 RESULT
The results of the bathymetry survey obtained around
the seashore can be concluded as follows:
a. The area around Surabaya was surveyed as far
as 1.7 km in front of the beach. The area
surveyed is in accordance with the planned area
in the 500 m corridor to the left and right of the
Suramadu Bridge.
b. According 2016 bathymetery data Table 2, that
the water sea level was 7 – 8 m.
c. In the results of the cross section overlay data
for 2016 with 2017 across the position of Pillar
46 also obtained changes in the form of
sedimentation and scouring at certain spots. The
part that forms the ridge or embankment tends
to occur sedimentation while the lower part
occurs scouring. Sedimentation values that
occur along cross sections 500 west and 500 east
are 0-0.7m per year and the highest
sedimentation rates are seen in the cross section
of STA 575 and 600. While the scouring value
is 0 - 0.9 m per year especially in the STA 700
area up to 825.
Figure 11: Seabed in P46 Pillar.
d. When looking at changes in the results of the
cross section on Pillar 47, the back of the west
and east pillars is very visible in the 3D image
as shown below, where changes occur in
sedimentation at the top of the embankment and
scouring at the bottom of the embankment such
as dark appearance on the underside of the
embankment. The value of this change varies
with the sedimentation value of 0 -1 m per year
as seen in the cross-section and sedimentation 0
- 1.1 m per year.
ISOCEEN 2019 - The 7th International Seminar on Ocean and Coastal Engineering, Environmental and Natural Disaster Management
268

Figure 12: Seabed in P47 Pillar.
Besides the seawater depth map, from
measurements with Multi beam echo sounder, you
can also see the profile of the seabed surface around
Pillars P-46 and P47. The condition of the profile seen
in the 3D image below.
Figure 13: 3D Image Sea bed in Main Bridge.
Table 2: Bathymetry Data.
No. Of
Pillars
Preliminary
data
Design 2016 2017
46 -19,995 -31,495 -27,495 -28,395
47 -15,600 -26,960 -23,100 -24,200
From the table above presented in the graph, in
Figure 13. From the data obtained from preliminary
data, bathymetry survey data in 2016 and 2017, which
can explain that scouring, occurred in the main span
until 2016 occurred at 7-8 meters, but in 2017, the
scouring has stabilized result 0 – 1 meters.
Figure 14: Scouring Graphic in Main Bridge.
4 CONCLUSION
The survey results are also presented in the form Point
Cloud with a grid size of 1.0 m. All depth data use the
MSL reference so that it will be commensurate when
compared to 2016 measurement data that use the
same reference. The maximum water depth that
measured in the corridor of the survey area is 22.8 m
and this depth find to the west of the Main Pillar of
P-47.
The water depth of 22.8 m is in the elongated
scouring area that occurs along the southern part of
the P-47 pillar where this scour is parallel to the
sedimentation, which is located side by side in the
northern part of the P-47 pillar. Underneath there is a
scoring direction to the west of Pillar 47.
The depth of water between the main pillars to a
distance of 300 m from the bridge ranges from 15 to
22 m with a composition that is almost evenly
distributed and regularly in the West and East.
Sedimentation occurs forming embankments
longwise to the west and followed on the main pillars
that range between 0 - 1 meter form the embankment
which can be seen clearly on the appearance of 3D
images.
5 RECOMMENDATION
To ensure that the local scouring is not gives damege
to the bridge in the further, bathymetry survey has to
periodically, that level of local scouring can be
estimated as reference to maintenace the bridge.
REFERENCES
Abidin, H.Z. 2000. “Penentuan Posisi Dengan GPS dan
Aplikasinya”. PT. Pradnya Paramita. Indonesia.
Ahmad, N., Mohammad, T., Suif, Zuliziana. 2016.
“Prediction of Local Scour around Wide Bridge Piers
under Clear Water Conditions”. International Journal of
GEOMATE. Vol. 12 (34):135-139.
Akib, S., Fayyadh, M.M., Shirazi, Primasari, B., Idris, M.F.
2011. “Innovative Countermeasure for Integral Bridge
Scour”. International Journal Of Physical Sciences Vol.
6(21):4883-4887.
Akib, S., Mamat, N.L., Basser, H., Jahangirzadeh, A. 2014.
“Reducing Local Scouring at Bridge Piles Using Collar
and Geobags”. The Scentific World Jurnal. Vol. 2014.
Anugroho, A, Subardjo, P., Cristian, B.Y. 2017.
“Bathymetry Mapping Study As A Consideration In
Determining Shipping Channel In Pramuka Island
Waters, Seribu Islands, DKI Jakarta”. The International
Journal of Marine and Aquatic Resource Conservation
Bathymetric Survey for Estimating the Local Scour at Suramadu Bridge
269

and Co-existance. Vol. 2(1):12-17.
Jatnika, A.W., Sinaga, A., Munaf, D.R. 2006. “The
Construction of Science and Technology Culture on the
Development of Suramadu Bridge”. Asia-Pacific
Structural Engineering and Construction Conference.
Malaysia.
Jung, D., Kim., J., Byun, G. 2017. “Numerical Modeling
and Simulation Techniue in Time Domain for
Multibeam Echo Sounder”. International Journal of
Naval Architecture and Ocean Engineering. Vol.
10:225-234.
IHO. 2008. IHO Standards for Hydrographic Surveys 5th
Edition. Monaco
Lekkerkerk, Huibert, J. 2011. Global Navigation Satellite
Systems State Of Affairs .
Masjedi, A., Bejastan, M.S., Esfandi, A. 2010.
“Experimental Study on Local Scour around Single
Oblong Pier Fitted with a Collar in a 180 degree flume
bend”. International Journal of Sediment Research. Vol
(24):304-312.
Moustier, D. 2005. Course Multbeam Sonar Method.
Publication Data, United Kingdom.
Tang H.W., Ding, B., Chiew, Y.M., Fang, S.L. 2009.
“Protection of Bridge Piers against Scouring With
Tetrahedral Frames”. International Journal Of
Sediment Research. Vol (24):385-399.
Stanley, J.D., Nickerson, G.A.J., Bernasconi, M.P.,
Bernasconi, P., Fischer, S., Mcclure, N., Segal, T.,
Royal, J.G. 2017. “Multibeam Sonar Technology and
Geology to Interpret Ancient Harbour Subsidence off
Corotone Penisulla Italy”. The International Journal of
Nautical Archaeology. Vol. (117):127-141.
Poerbandono dan Djunarsjah, E. 2005. Survei Hidrografi.
Refika Aditama. Bandung. Indonesia.
Qhomariyah, L dan Yuwono. 2016. “Analisa Hubungan
Antara Pasang Surut Air Laut Dengan Sedimentasi
Yang Terbentuk”. Jurnal Teknik ITS. Vol. 5(1).
Rinaldy N.Y., Arief, L.N., Sawitri, S. 2014. Analisis
pengukuran batimetri dan pasang surut untuk
menentukan kedalaman kolam pelabuhan (Studi Kasus:
Pelabuhan Tanjung Perak, Surabaya). Jurnal Undip.
Vol 3(4):25-36.
Roy, C. 2017. “Effect of Bridge Pier Geometry on Local
Scouring”. International Journal of Earth Sciences and
Engineering. Vol. 10(02).
Sasmita, D. K. 2008. “Aplikasi Multibeam Echosounder
(MBES) untuk Keperluan Batimetrik”. Skripsi,
Departemen Teknik Geodesi Fakultas Teknik Sipil dan
Perencanaan Institut Teknologi Bandung, Bandung.
Indonesia.
Yu, X. 2005. “Numerical Study on Topographycal Change
and Local Scour Caused By Suramadu Bridge”.
China:China Highway and Bridge Corporation.
ISOCEEN 2019 - The 7th International Seminar on Ocean and Coastal Engineering, Environmental and Natural Disaster Management
270
