
Modelling Water Quality in Welang River Estuary, Pasuruan
Indri Ika Widyastuti and Suntoyo
Department of Ocean Engineering, Faculty of Marine Technology, Institut Teknologi Sepuluh Nopember (ITS),
Surabaya, 60111, Indonesia
Keywords: Modelling, Water Quality, Welang River, Estuary, Pasuruan.
Abstract: Land use activities for agriculture, plantations, industrial areas, fishponds and settlements in the Welang
watershed can affect water quality in the Welang estuary. Waste disposal from these activities into the river
can reduce water quality. The purpose of this study is to apply a numerical model to assess the water quality
in the Welang estuary in accordance with permitted water quality standards in the coastal water. 2D numerical
model with Hydrodynamic and Ecolab module is used to simulate the distribution of DO and pH as water
quality parameters. Result of the hydrodynamic model showed that the current velocity flows into upstream
at the tide, whereas at the ebb the current flows into downstream. The water quality modelling results show
the minimum value of DO is 1.80 mg/l, and pH between 7.74 -7.87, while, the DO quality standard must be
more than 3 mg/l, and pH is 6-9. Modelling results show that water quality in the Welang estuary is lightly
polluted, because DO values are not in accordance with the water quality standards for class III based on
government regulation number 82/2001.
1 INTRODUCTION
Welang River is one of the major rivers in East Java
that crosses Malang Regency, Pasuruan Regency, and
Pasuruan City. The upstream river is located at
Lawang, Malang Regency and estuary in the Madura
Strait in Kraton Regency, west of Pasuruan City. The
Welang watershed from upstream to estuary has an
area of 518 km
2
with the main river length of 36 km
and an average width of 25 m (Public Works and
Water Resources Pasuruan, 2019). Upstream of the
Welang river is agriculture, plantation, industrial and
residential area. Midstream of the Welang river is
residential area and agriculture. The downstream is an
agricultural area, fishpond, and industrial area. Various
land-use activities in the Welang watershed can affect
the river water quality. Organic and inorganic waste
generated from these activities directly or indirectly
enter the river will accumulate in the estuary causing
the water quality in the estuary to decrease.
Previous research by Suntoyo et al. (2015) aims to
determine the condition of water quality in the Porong
river estuary due to mud disposal in Sidoarjo. The
parameters used in modelling are chemical demand
(COD), total suspended solid (TSS), phosphate and
nitrate. The results showed that the water quality in
Porong estuary still within safe criteria, because the
water quality parameters none of which exceed the
quality standard based on government regulation
number 82/2001. Another research was carried out by
Gopal et al. (2018) to find out the water quality at the
mouth of the Uppanar river. This river is an agricultural
area, settlement and fishing port downstream, barren
land and industrial centre in the upstream and middle.
The results showed that the values of nitrate,
phosphate, iron and lead exceed the permissible limit
of WHO drinking water guidelines.
Research about water quality at the Welang estuary
has never been done before. Therefore, research is
needed to assess whether water quality in the Welang
estuary in accordance with permitted water quality
standards. The parameters used to assess water quality
are dissolved oxygen (DO) and power of hydrogen
(pH). DO is a very important parameter for knowing
water quality (Thomann and Mueller, 1987).
2 STUDY AREA
The study area is located in the Welang Estuary,
Pasuruan East Java Province (Figure 1). Geogra-
phically located between 7.57-7.60 south latitude and
112.86-112.89 east longitude.
Widyastuti, I. and Suntoyo, .
Modelling Water Quality in Welang River Estuary, Pasuruan.
DOI: 10.5220/0010218702510256
In Proceedings of the 7th International Seminar on Ocean and Coastal Engineering, Environmental and Natural Disaster Management (ISOCEEN 2019), pages 251-256
ISBN: 978-989-758-516-6
Copyright
c
2021 by SCITEPRESS – Science and Technology Publications, Lda. All rights reserved
251

Figure 1: Study area in Welang estuary.
3 MATERIAL AND METHOD
3.1 Data Collection
Water quality measurements were performed at 5
points in the surface (Figure 1). The measurement
point is along the river to the coastal. Measurement of
water quality parameters are DO and pH.
3.2 Method
Modelling simulation was done with input bathymetry,
river flow discharge, tides, and water quality
parameters. River flow discharge data is used as
boundary conditions in rivers, while tides are used as
boundary conditions at sea. The simulation was carried
out for 30 days with the time step interval is 3600s,
number of steps is 720. The boundary condition shown
in Figure 2. The hydrodynamic model is use for water
surface and currents 2D modelling. The continuity
equation and the momentum equation used for
hydrodynamic modelling as follows:
Continuity equation:
∂ζ
𝜕𝑡
+
∂u
𝜕𝑥
+
∂
v
𝜕𝑦
=
∂d
𝜕𝑡
(1)
Momentum equation:
• Axis – x
∂u
𝜕𝑡
+
∂
𝜕𝑥
𝑢
ℎ
+
∂
𝜕𝑦
𝑢𝑣
ℎ
+𝑔ℎ
∂ζ
𝜕𝑥
+
𝑔𝑢
√
𝑢
+𝑣
𝐶
ℎ
−
1
𝜌
∂
∂x
(
ℎ𝜏
)
+
∂
∂y
ℎ𝜏
−𝛺
−
𝑓
𝑉𝑉
+
ℎ
𝜌
𝜕
𝜕𝑥
(𝑝
)=0
(2)
• Axis – y
∂
v
𝜕𝑡
+
∂
𝜕𝑦
𝑣
ℎ
+
∂
𝜕𝑥
𝑢𝑣
ℎ
+𝑔ℎ
∂ζ
𝜕𝑦
+
𝑔𝑢
√
𝑢
+𝑣
𝐶
ℎ
−
1
𝜌
∂
∂y
ℎ𝜏
+
∂
∂x
ℎ𝜏
−𝛺
−
𝑓
𝑉𝑉
+
ℎ
𝜌
𝜕
𝜕𝑥𝑦
(𝑝
)=0
]]
(3)
Where ζ = water surface (m), 𝑡 = time (s). g =
gravitation acceleration (m/s
2
), 𝑥 dan 𝑦 = space
coordinat (m), 𝑢 dan 𝑣 = flux density in direction of
x and y (m
3
/s/m), 𝑓(𝑉) = wind friction factor, 𝑃
=
atmospheric pressure (kg/m/s
2
), 𝜌
= water density
(kg/m
3
), Ω= parameter of Coriolis, h = water depth
(m), d = water depth varied with time (m), C =
resistance coefficient Chezy (m/s), 𝜏
,𝜏
,𝜏
=
component of effective shear stress, V, V
x
, V
y
= wind
velocity in direction of x and y (m/s).
ECO Lab equation used to simulate the DO and
pH distribution pattern in a given time is shown as
follows:
𝑃
=
𝑑𝑐
𝑑𝑡
= 𝑝𝑟𝑜𝑐𝑒𝑠𝑠
(4)
Where 𝑃
= ECO Lab process, 𝑐 = the concentration of
the ECO Lab state variable, 𝑛 = number of processes
involved for specific state variable, 𝑝𝑟𝑜𝑐𝑒𝑠𝑠 = user
specified expression containing argument such as
mathematical function, build in function, number,
forcing, constants, and state variable.
The calibration of the hydrodynamic model and
water quality was conducted by comparing the data
of modelling results with the measurement data. The
calibration of hydrodynamic modelling uses the root
mean square error (RMSE) and mean absolute
percentage error (MAPE) methods, whereas for ECO
Lab modelling only uses MAPE. The RMSE equation
as follows (Wei, 2006):
𝑅𝑀𝑆𝐸=
1
𝑀
𝑒
(4)
Where, M is amount of data and 𝑒
is obtained from
the following equation:
𝑒
=𝑍
−𝑍
(
𝑙
)
(5)
Where, 𝑍
is measurement data and 𝑍
(
𝑙
)
is
modeling data. The equation for calculating MAPE as
follows:
𝑀𝐴𝑃𝐸=
1
𝑀
𝑒
𝑍
100%
(6)
ISOCEEN 2019 - The 7th International Seminar on Ocean and Coastal Engineering, Environmental and Natural Disaster Management
252
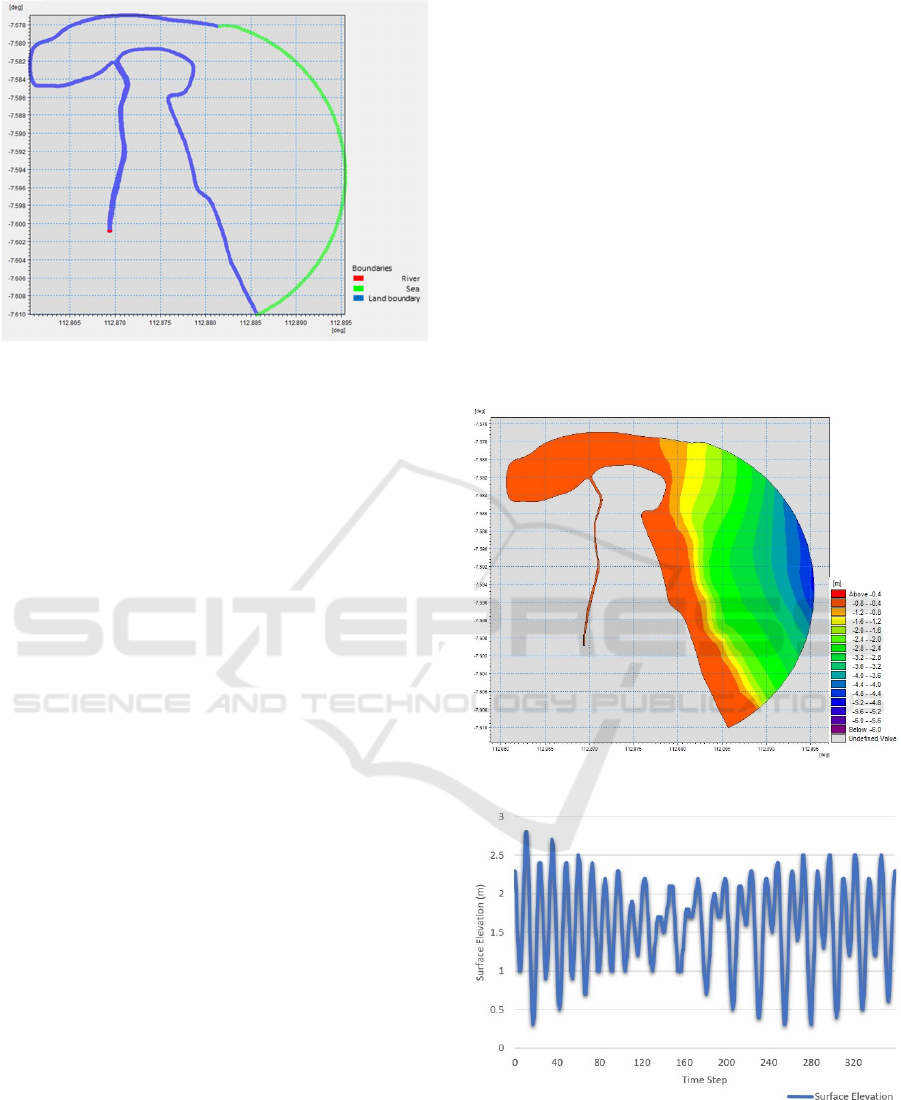
Figure 2: Boundary condition of modelling.
4 RESULTS AND DISCUSSION
4.1 Bathymetry
Bathymetry modelling in the Welang estuary is
shown in Figure 3. The depth at the Welang estuary
ranges from 0-5.5 meters.
4.2 Model Validation
The calibration of the hydrodynamic model was
conducted by comparing simulation results at point 3
with the measurement data. For the hydrodynamic
model, the root mean square error (RMSE) value is
0.01 and the mean absolute percentage error (MAPE)
value is 0.64%.
Table 1 shows the measurement data at point 3
and the results of the water quality modelling. The
difference in value is relatively small. DO value of the
field measurement result is 4.08 mg/l, while the
modelling result is 4.75 mg/l. pH value of the field
measurement result is 7.87, while the modelling result
is 7.84. MAPE value for DO is 16.42% and for pH is
0.38%. It can be concluded that the results of water
quality modelling give good results.
Table 1: Validation of modelling results with measurement
data at point 3.
Water
Quality
Parameters
Field
measurements
Modelling
Result
MAPE
(%)
DO 4.08 mg/l 4.75 mg/l 16.42
pH 7.87 7.84
0.38
4.3 Hydrodynamic Simulation
The types of tides that occur at the Welang estuary is
mixed tide prevailing semidiurnal. The water surface
elevation at the highest tide reaches 2.8 m in the
simulation step of 35. While at the lowest tide, water
surface elevation is 0.5 m in the simulation step of 42.
Figure 4 shows the tidal graph at the Welang estuary.
Current speed at high tide between 0-0.06 m/s,
whereas at low ebb 0.0-0.28 m/s. Current flow into
upstream at the highest tide, while at the lowest ebb
the current flow into downstream. Currents flow to
upstream or towards river mouths during high tide
conditions with the maximum current speed of 0.13
m/s (Figure 5a). During the low ebb, current flow into
downstream or toward the coastal. Maximum current
speed is 0.30 m/s (Figure 5b).
Figure 3: Bathymetry in Welang estuary.
Figure 4: Water Surface Elevation.
Modelling Water Quality in Welang River Estuary, Pasuruan
253
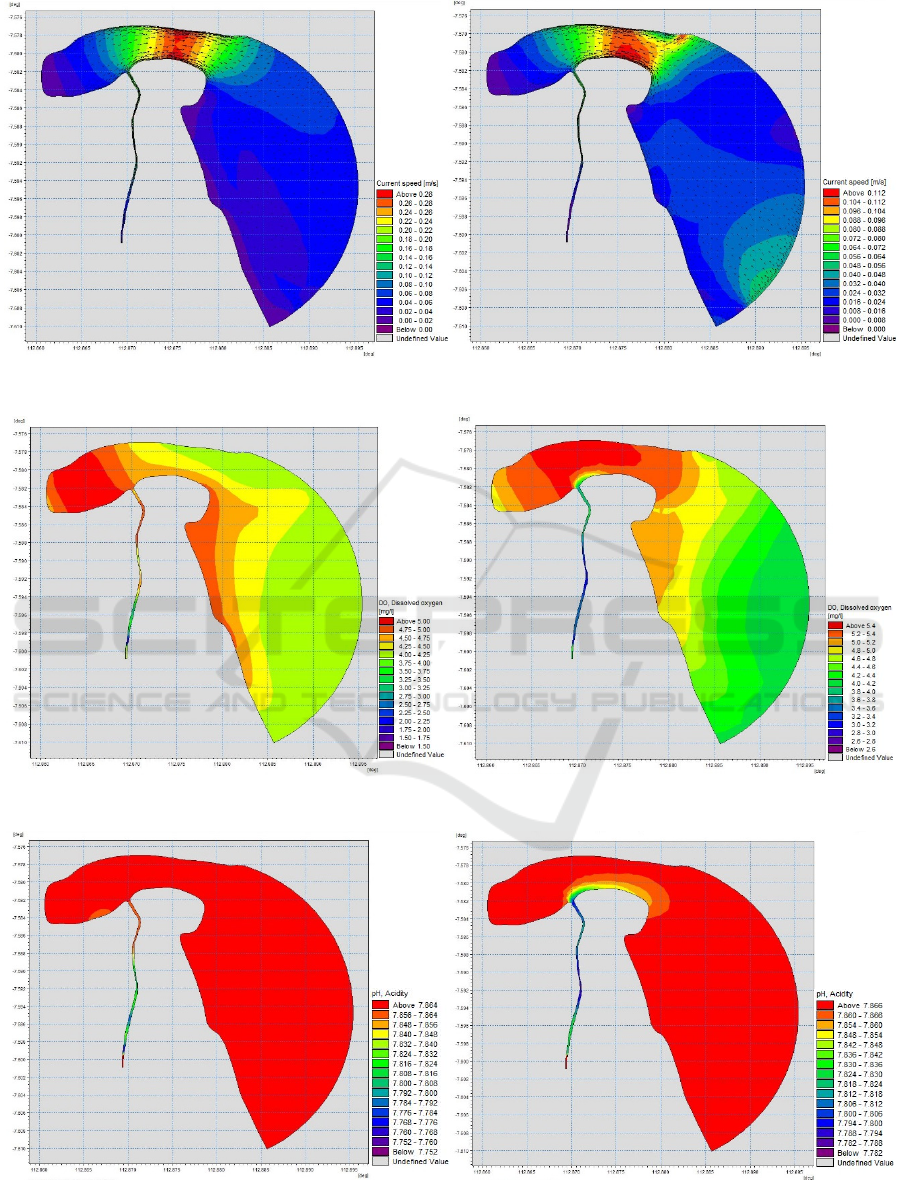
Figure 5: Current distribution at highest tide (a) and lowest ebb (b).
Figure 6: Distribution of DO during tide condition (a), and during ebb condition (b).
Figure 7: Distribution of pH during tide condition (a), and during ebb condition (b).
ISOCEEN 2019 - The 7th International Seminar on Ocean and Coastal Engineering, Environmental and Natural Disaster Management
254

4.4 Water Quality Parameters
Water quality measurements have been conducted for
5 points in the study area (Figure 1), where
measurement data are given in Table 2. The highest
concentration of DO at station 3 reaching 4.08 mg/l,
while the lowest at station 1 with a value of 1.07 mg/l.
The highest pH at station 5 reached 7.941, while the
lowest at station 1 with a value of 7.735.
The modelling results of DO shown in figure 6.
DO concentration at tide is lower than at ebb. DO
distribution varies between 1.80-5.24 mg/l in the river
body to the coastal at tide (Figure 6a). DO
concentrations in river bodies are smaller than in river
mouth and coastal area. At the river bodies, maximum
DO concentration is 4.97 mg/l, the minimum DO
concentration is 1.80 mg/l. In the estuary,
concentration of DO maximum value is 5.24 mg/l and
minimum is 4.01 mg/l. When at the ebb, the spreading
of DO does not vary much with at tide. Concentration
of DO ranged from 3.01-5.46 mg/l (Figure 6b). The
highest DO concentration is 5.46 mg/l around the
estuary. The maximum DO concentration in the river
is 4.23 mg/l, while the smallest concentration is 3.01
mg/l. In the estuary, concentration of DO maximum
value is 5.46 mg/l and a minimum of 3.7 mg/l. DO
concentrations at the river mouth of and coastal area
are greater than in river bodies during tide and ebb.
Figure 7 shows the distribution of the pH in for
tide and ebb condition, it was indicated that the value
of pH in the river body and estuary are not much
different with range 7.741-7.864 (Figure 7a). The
value of pH in the river body is lower than in the
estuary and coastal area. At high tide, the maximum
value of pH at the coastal area which is 7.860, while
maximum value at the river is 7.743. At ebb, the
distribution of pH also has the same tendency as the
current tidal conditions (Figure 7b). The maximum
value of pH is 7.866 at estuary and the minimum
value is 7.866 at river body.
Table 2: Water quality measurement data.
Station DO (mg/l) pH
1 1.07 7.735
2 1.18 7.778
3 4.08 7.876
4 3.43 7.93
5 3.14 7.941
4.5 Water Quality of Welang River
Estuary based on Quality Standard
Water quality in Welang estuary analysed under the
government regulation number 82/2001 on the
management of water quality and water pollution
control. Classification of Welang estuary included in
water quality class III. The modelling result of water
quality parameter compared with the value of the
water quality standard provided in the regulation
(Table 3). Table 3 shows the DO value is less than the
water quality standard. Based on government
regulations, the DO quality standard must be more
than 3 mg/l, while the modelling results show the
lowest DO value is 1.80 mg/l. pH value of the
modelling result showed still relatively safe. Water
quality standards of pH are 6-9, while modelling
results show the values between 7.743-7.87.
Table 3: Water quality in Welang estuary.
Water
Quality
Parameters
Water Quality
Standard
Value of
modelling Result
(Water class III)
DO >3 mg/l 1.12 - 6.93 mg/l
pH 6 - 9 7.743 - 7.87
5 CONCLUSIONS
The modelling results show the minimum value of
DO is 1.80 mg/l, and pH between 7.743-7.87, while,
the DO quality standard must be more than 3 mg/l,
and pH is 6-9. Modelling results show that water
quality in the Welang estuary is lightly polluted,
because DO values are not in accordance with the
water quality standards for class III based on
government regulation number 82/2001.
REFERENCES
DHI. 2014. Mike 21/3 Ecological Modelling- Short
Description. Mike by DHI.
DHI. 2014. Mike 21/3 Flow Model FM-hydrodynamic-
Scientific Documentation. Mike by DHI.
Government of Indonesia Republic. 2001. Government
Regulation Number 82/2001. The Management of
Water Quality and Water Pollution Control. Jakarta.
Gopal, V., Shanmugasundaram, A., Nithya, B., Magesh, N.
S., & Jayaprakash, M. 2018. Water quality of the
Uppanar estuary, Southern India: Implications on the
Modelling Water Quality in Welang River Estuary, Pasuruan
255

level of dissolved nutrients and trace elements. Marine
Pollution Bulletin, 130 (January), 279–286.
Suntoyo, Ikhwani, H., Zikra, M., Sukmasari, N. A.,
Angraeni, G., Tanaka, H., … Kure, S. 2015. Modelling
of the COD, TSS, Phosphate and Nitrate Distribution
Due to the Sidoardjo Mud Flow into Porong River
Estuary. Procedia Earth and Planetary Science, Vol.
14, pp. 144–151.
Thomann, R.V., and Mueller, J.A. 1987. Principles of
Surface Water Quality Modeling and Control, Harper-
Collins, New York.
Wei, W.W.S. 2006. Time Series Analysis: Univariate and
Multivariate Methods -2
nd
Edition, Pearson Education,
Inc., Boston.
ISOCEEN 2019 - The 7th International Seminar on Ocean and Coastal Engineering, Environmental and Natural Disaster Management
256
