
The Coffee Value Chain Analysis to Support Farmers Livelihood in
Horsik Village, Ajibata Sub-district, Toba Samosir District,
North Sumatra
Henry Sitorus
1
, Ria Manurung
1
, Rizabuana Ismail
1
, Roida Lumbantobing
2
1
Department of Sociology, Universitas Sumatera Utara, Medan, Indonesia
2
Department of Sociology, FISHK, IAKN, Tarutung
Keywords: Coffee Farmers, Low Income, Capacity and Technology Empowerment, Coffee Processing.
Abstract: Coffee is currently very loved by many people. One coffee producer from Horsik village, Toba Samosir is
farming on the hills of Lake Toba. This paper describes how to plant and manage Arabica coffee based on
local community knowledge. The traditionality of technology that is applied causes low production results
so that people's incomes are insufficient for socio-economic life. It is necessary to develop the capacity of
farmers 'resources and technological support to increase farmers' production and livelihood.
1 INTRODUCTION
The history of coffee in North Sumatra started in
1696 during colonialism when Dutch Governor of
Batavia (read: Jakarta) received seeds of arabica
coffee (Coffee Arabica) from India. Indonesia
considered as suitable for coffee plantations because
of its position near the equator with mountainous
regions across the islands, creating micro-climates
for the growth and production of coffee. The first
plantation centralized in Java Island managed by the
Dutch East India Company, known by its Dutch
initials VOC (Vereeningde Osst-Indische Company).
In 1717, VOC shipped 907 kilogram coffee to
Europe. Indonesia became the third place, outside of
Arabia and Ethiopia, where coffee was widely
cultivated (Neilson, 2012). By the mid 0f 1870s,
VOC expanded Arabica coffee growing areas in
Sumatra, Bali, Sulawesi and Timor islands. In North
Sumatra highlands, coffee was first grown in 1888
and followed in Gayo Highland (Aceh) in 1924. In
North Sumatra, coffee was first grown near Lake
Toba. After Gayo, several area which become the
central of Arabica coffee plantation was Lintong,
Mandheling, Sidikalang and Brastagi.
In the late of 1800, Dutch colonialists established
large Arabica coffee plantation in Eastern Java.
Coffee rust disease (Hemileia vastatrix) destroyed
the plantation which grown at lower latitude in 1876
and spread to other islands. To substitute the loss,
new variant of coffee or known as Robusta (C.
canephor var. robusta) was introduced in 1900. The
robusta coffee was planted in Kerinci and spread
quickly in Sumatra during 1920s. Dutch owned
plantation in Java Island was nationalized in 1950s
after national independence. Right now most of
plantation was managed by state-owned company
namely Perusahaan Terbatas Perkebunan Nusantara
(PTPN). PTPN revitalized the plantations by
introducing new varieties of coffee Arabica. These
varieties were adopted by smallholders through the
government and various development programs. The
result, according to International Coffee
Organization (ICO), Indonesia was the fourth largest
producer of coffee in the world in 2014 with an
estimated production reached 540,000 metric tons in
2014.
A value chain is the process of creating value
from the conception of a product through to its final
consumption. It describes the full range of activities
that are required to bring a product or service from
conception, through the intermediary phases of
production and delivery to final consumers, and final
disposal after use (ILO, 2015). Value chain
development for livelihoods and economic
increasing focuses on value chains in which market
demand is substantial and represented as
entrepreneurs or employees. Interventions are then
designed to strengthen the competitiveness of the
value chain while expanding the share of value
438
Sitorus, H., Manurung, R., Ismail, R. and Lumbantobing, R.
The Coffee Value Chain Analysis to Support Farmers Livelihood in Horsik Village, Ajibata Sub-district, Toba Samosir District, North Sumatra.
DOI: 10.5220/0010122704380443
In Proceedings of the 3rd International Conference on Social and Political Development (ICOSOP 3 2019) - Social Engineering Governance for the People, Technology and Infrastructure in
Revolution Industry 4.0, pages 438-443
ISBN: 978-989-758-472-5
Copyright
c
2020 by SCITEPRESS – Science and Technology Publications, Lda. All rights reserved

added that reaches target groups. Such interventions
connect micro and small enterprises to larger
companies with access to wider markets, creating
forward and backward linkages where farmers can
participate.
Therefore, however the assessment is designed, it
will need to incorporate micro-macro linkages, these
being. the linkages between issues that influence
livelihoods and economic recovery at the individual,
household, and community level (the micro level)
and those issues that relate to the economy, policy
framework, and systems of governance at provincial,
national and, where relevant, regional levels (the
macro level) (UNDP, 2013). In detail, the mapping
and analysis will cover the market size, volume,
distance, demand for and supply chain/competition,
type of producers (large, medium, and small),
existence of middle man, men and women led
business/trades, available mode of transportation and
market associations/trade organizations. It will also
capture information about credit institutions, training
providers, market associations, and enabling actors
in the value chains of selected commodities.
The intervention developed, as follow up of the
assessment; consist of vertical and horizontal
aspects. Vertical value-chain interventions focus on
strengthening dialogue between large enterprises
that dominate the value chain and smaller enterprises
in order to identify opportunities for increased
participation in the value chain by small, local firms.
Horizontal value-chain interventions focus on the
access that smaller, less powerful businesses have to
the business and financial services they require to
participate more effectively in national and global
value chains, as well as to the collective actions they
can engage in through business associations and
cooperatives.
2 METHOD
Method to meet the research objectives, this study
used a mix of quantitative and qualitative methods.
It employed strategies of inquiry that involve
collecting data either simultaneously or sequentially
to best understand research problems. The data
collection involved gathering both numeric
information as well as text information so that the
final database represents both quantitative and
qualitative informations (Creswell, 2003).
Purposive sampling methodology is selected for
quantitative approach to focus on particular
characteristics of a population that are of interest,
which will best enable us to answer the research
questions. Considering that the projects has varied
approach to achieve the same outcomes, maximum
variation sampling techniques will be exercised to
capture and to describe the central theme that cut
across a great deal of participants or program
variation. Any common patterns that emerge from
great variation are of particular interest and value in
capturing the core experience and central, shared
aspects or impacts of a program (Patton, 1990).
The criteria being used to determine the
respondents is designed together with the program
owner and considered purposed theoretical approach
that being used as the basis of this study. The criteria
are: (i) covered 50 farmers interviewed in the sample
area; (ii) 20% of the producer groups operational in
current project; (iii) the respondent is listed as
beneficiaries of the program; and (iv) the sampling
will cover 30% of female respondents to get gender
perspective of the program.
Qualitative approach emphasized on culturally
specific information about the values, opinions,
behaviors, and social contexts of particular
populations and to identify intangible factors, such
as social norms, socioeconomic status, gender roles,
ethnicity, and religion, whose role in the research
issue may not be readily apparent. The strength of
qualitative research is its ability to provide complex
textual descriptions of how people experience a
given research issue. It provides information about
the “human” side of an issue – that is, the often
contradictory behaviors, beliefs, opinions, emotions,
and relationships of individuals. Qualitative methods
are also effective (Denzen et al., 2000).
The methodology being used to obtain
qualitative data consist of:
a. Document study consist of production and trades
volume before and during the period of eruption;
underlying policies, institutional and
infrastructural issues that affect the
competitiveness of the selected value chains; and
the current planned investment and priorities of
governments and development agencies in the
sectors;
b. Key informant interview participated by District
Agriculture Office; District Cooperative,
Industry and Trade Office; District Statistics
Bureau; District Planning Agency; Key
Distributors at village until district level;
Pesticides Suppliers at district level, Farmers
Group Leaders, and Community Leaders.
c. Focus Group Discussion (FGD) involved
farmers, local trader, and consumers.
The following data specific to 3 commodities
were collected: a) Data on costs, production, sales
The Coffee Value Chain Analysis to Support Farmers Livelihood in Horsik Village, Ajibata Sub-district, Toba Samosir District, North
Sumatra
439

volumes, values and margins. b) Data on service
providers, type of facilities and services they offer,
terms and conditions of accessing such services,
processing, marketing, constraints faced and
opportunities available to the providers. c) Other
value chain institutions like market information
providers, input suppliers, and technology providers
also provided data on nature of services, their target
recipients, constraints and opportunities.
3 RESULT AND DISCUSSION
The History of Coffee Commodity in North
Sumatra: Production of Coffee Commodities in Desa
Horsik
The analysis of value chain mapping of coffee
commodity in Desa Horsik is divided into four steps:
mapping the main process of Value Chain;
identifying the actors and the supporting institution
in the Value Chain (VC); mapping the Value Chain
distribution, and identify potentials problems and the
solutions.
Based on the mapping process, there are 5 stages
applied in VC for coffee commodity in Desa Horsik
those are input providing; planting and harvesting;
collecting; processing; distribution and trading.
Mapping of value change of coffee commodity in
desa horsik.
3.1 Input and Supply of Coffee
Commodity in Horsik Village
Seventy households (HH) live in Horsik village.
Most of the villagers work as farmers. Compared
with other commodity such as cocoa, coffee is the
major product in these villages. In 2018, Horsik
Village produced 23.00 ton of coffee parchment.
Coffee commodity supports the income generation
of the villagers in this village. The cost for
production cost is affordable since they just need to
put expense in subsidized fertilizer. For production,
the farmers is using their own capital because
limited access to micro finance institutions such as
bank and cooperation. There is a financial institution
in Horsik Village which can give financial support
for the farmers. Input and supply stage for coffee
commodity consists of supplying seeds, fertilizer
and pesticide. Farmers do not need to buy the seeds
because it is already provided by nature. Hence, they
never use certified seeds. In term of fertilizer, the
association of farmer groups (Gapoktan) receives
subsidized fertilizer from government regularly. The
subzidised fertilizers are urea, KCL and SP. Only
few farmers use pesticide. They buy the pesticide
from pesticides store in Parapat.
The farmers have limited knowledge on how to
conduct Good Agricultural Practices (GAP) even
though the government already regulated the
standards since 2006. The reasons for the late
implementation are the lack of number of
agricultural field facilitator who could assist the
farmers in day to day activity and the farmers have
limited access to information about GAP. Gapoktan
members who were involved in the trainings did not
consistently apply and share the knowledge to other
farmers. Meanwhile, Local District Agriculture
Service has limited resources to monitor the impact
of the training.
3.2 Planting and Harvesting
Farmers in target area plant the coffee seeds within
space of 2 x 2 meters. If they have 1000 m2 means
that they can plant for about 150 seeds. The
fertilizing method is applied differently amongst
farmers. Due to the high cost of fertilizer and the
lack of knowledge in using organic fertilizer,
farmers conduct fertilizing based on their financial
condition. Most of them rely on government’s
subsidy through Gapoktan. Farmers start to harvest
the coffee after 3-4 years planting period with major
production of 4-5 months in a year. It takes 7-14
harvesting days for each month. Farmers can harvest
their crops themselves in picking the right coffee
cherry since they never been trained before; only
based on field experience. However, since the
farmers only focus on having quick process during
harvesting, this concern has been abandoned.
When the coffee bean has been harvested, it
should be cleaned using water and being fermented.
It would be better done in the flowing water.
However, farmers in Horsik Village using the
method by soak the coffee in pails. After being
cleaned, the coffee is processed for pulping. Pulping
is a process to peel and take the coffee pit. It can be
done manually or using a machine that bought in
Parapat for IDR 500.000. After being peeled, the pits
are dried and sorted. In sunny days, it takes 2 hours
to dry the pits before sell them to the collectors in
Parapat market.
ICOSOP 3 2019 - International Conference on Social Political Development (ICOSOP) 3
440
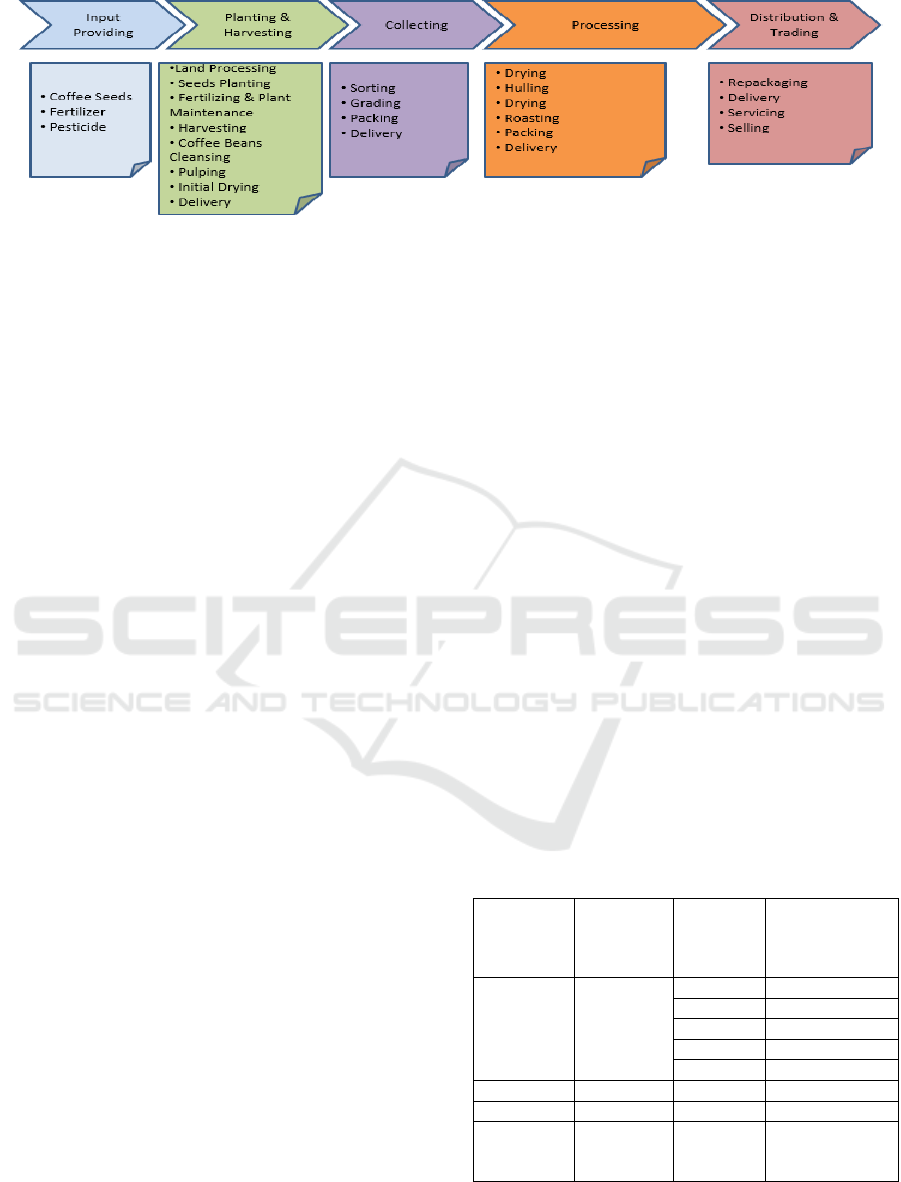
Figure 1. Map of Value Change Process for coffee commodity.
3.2.1 Collecting
The collecting stage happens when the collectors
come to collect the coffee directly from the farmers
in Toba Samosir Dictrict. There are only few
collectors in Parapat Market. The well-known ones
is Joko. These collectors sort the coffee pits based
on the physical performance. If the coffee is
physically good, collector will pay IDR 20,000
rupiahs per kilogram. In the other hand if it is not
good, they will pay around IDR 18,000 per
kilogram.
3.2.2 Processing
The processing stage is being done in Siborong-
borong. This process is done by whole sellers,
manufactures or cafes. The most well-known actors
is Joko. The first step in processing stage is Huller
process. This is a process when the green bean
separated from its horn cover. Huller process
produces green beans. They will be sorted manually
by hand picking before they were sold to local
market or being exported. The farmers usually ride
motor cycle to transport the coffee to the collectors
in Parapat. The commodity sells to local and
international market. Every 2 weeks, the farmers
take their coffee to the collectors. The coffee from
this villages considered low and based on
observation and discussion with local farmers, the
reason for low quality is the hesitance of farmers to
give fertilizer periodically. They only gives fertilizer
once they have money to buy it.
Value chain stages role input and supply for
production this stage involves the pesticides store
that that provide the farmers with information about
pesticide products and spraying service; Agriculture
Store in Parapat which provides fertilizer; and
Gapoktan who managed subsidized fertilizer.
Planting and Harvesting the VC actors in this stage
are the farmers and the farmers focus on preparation
of the field, maintenance and disease treatment and
harvesting. Collecting the VC actors of this stage are
pooled/intermediate trader open a small shop in
Parapat. Marketing and distribution the VC actors in
this stage are supplier/grocery, exporter, distributor,
retailer and coffee shop. Coffee bean suppliers are
located in Medan, Sidikalang and Siborong-Borong.
They are Joko, Sari Makmur, Ecom etc Supported
institutions Agriculture District Office, Agriculture
Extention Agency, Food Security Agency, micro
finance institutions and Community Development
Board.
3.2.3 Financial Analysis of Coffee
Commodity
Value Chain mapping of coffee commodity assumes
that the final product is roasted coffee. The actors
are located in Siborong-borong. The roasted coffee
price is IDR 59,000 per kilogram which the roasting
process itself costed IDR 15,000. The price of
roasting process is higher than the green bean in
farmers/collectors levels. Roasting process is
expensive since it determines the taste of the coffee
that is why coffee from the same area can be
different in taste.
Table 1: Economic Analysis of Green Bean (Primary
Data, 2019)
Description
Parchment
with
moisture
40 %
Process/
kg
Green Bean
with Moisture
13%
Price/kg 25.000
53.000
Hulling 250
Transport 1.000
Worker 1.500
Yield 50 % 50.000
Margin/kg 750
Market Collectors
in Parapat
Market
Sub importer
The Coffee Value Chain Analysis to Support Farmers Livelihood in Horsik Village, Ajibata Sub-district, Toba Samosir District, North
Sumatra
441

Table 2: Economic Analysis of Roasted Bean (Primary Data, 2019)
Process/kg
Coffee Premium
Quality
Process/
kg
Roasted and
ground coffee
Process/Kg
Coffee with 70 gram/
pack
77.000 150.000 Rp 15.000/pack
worker 3.000 Roasted fee 35.000
Packs and
label
26.000
Tools
depreciation
500 Transport 2.000 Worker 5.000
worker 2.000
Tools
depreciation
2.000
Packaging 5.000 Electricity 1.000
75 % 70.670 80 % 93.750
2.830 9.750 11.000
roaster Café End consumer in
Parapat, Samosir,
Balige and others as
tourism area
Cost production for farmers in input process is
varied amongst farmers. They explain that the use of
fertilizer and pesticide depends on their financial
condition. For one kilogram of coffee, the farmers
need to spend IDR 2.500 for the fertilizer. Based on
this fact, farmers have limitation in coffee
cultivation especially in the domain of product
management and cultivating knowledge.
In average, the farmers get the margin about
34.73% - 37.27% with the price assumption of IDR
23,000 – IDR 24,500 per kilogram coffee. This
margin is the second highest margin after the roaster
one.
This margin is fair since they take a lot of
process in the coffee production even though
farmers in both villages have lack of knowledge in
coffee production. Soil fertile gives advantage and
simplifies the farming process as the plants can still
grow with limited maintenance. Coffee collectors in
Parapat got cost margin about 0.84% - 1.69 % or
equal to IDR 500 – 1000 per kilogram coffee pits. In
the peak season of harvest time (October-
November), collectors get 40-50 ton per day of
coffee pits. It means they get profit about IDR
40,000,000 –IDR 50,000,000 per day.
4 CONCLUSIONS
1. Seedlings, no special seeds utilization by farmer
mostly they put free on their own land.
2. Fertilizing, no pattern on fertilizer and pesticide
utilization. Plant maintenance, lack of knowledge
to maintain the crop has influence the harvesting.
Post harvest, there is no peeling machine in the
village that can be used by all farmers. The
farmers also had limited knowledge to maintain
the machine. Coffee branding and packaging is
not being done at farmers’ level. The farmers
only sell dried coffee in which its price being
determined by collectors in Parapat market after
passed sorting steps. Cash flow management,
most of the farmers do not know about cash flow
management in coffee production.
3. Gapoktan capacity building. Gapoktan members
not yet well organized in conducting their
program. The group still focus on managing
government support only.
4. Financial Institution, no financial institution at
village level.
5. Pulping tool, the cost to provide this machine is
high and none of the farmers has capacity to
maintain it.
6. Household management, the ability manages
income and expense still need to be increased so
that farmers can set up better planning during
cropping season.
REFERENCES
Asbjorn Eide (et.all), 1995, Economic, Social and Cultural
Rights, A Textbook.
Chambers, R., 1994, Participatory Rural Appraisal:
Challenges, Potentials and Paradigm, IDS, Brighton,
UK.
Chambers, R & Conway, GR, 1991, Sustainable rural
livelihoods: practical concepts for the 21st century,
IDS Discussion Paper 296.
Cook, KE, 2008, “In-depth Interview” in LM Given, the
Sage Encyclopedia of Qualitative Research Methods,
Safe, London.
ICOSOP 3 2019 - International Conference on Social Political Development (ICOSOP) 3
442

Cornwal, et. al., 1995. What is Participatory Research;
Elsevier Science Ltd.
Creswell, 2003, Research Design: Qualitative,
Quantitative, and Mixed Methods Approachs, Second
Edition, University of Nebraska.
Hennink, M.M. ,2007, International focus group research:
A handbook for the health and social sciences.
Cambridge University Press: Cambridge.
Neilson, J. (2008). Regulasi swasta global dan
restrukturisasi rantai nilai dalam sistem kopi petani
kecil Indonesia, Pembangunan Dunia.
Neilson, J. (2012). Kopi (Indonesia): 1900 hingga
sekarang: Asia Timur dan Tenggara.
Nutz and Sievers, 2015, A Rough Guide to Value Chain
Development, ILO.
Maskrey, A., Module on Community-based Disaster Risk
Management, CBDRM-2 Handout, Bangkok, (1998);
Mukherjee, A, 1995. Participatory Rural Appraisal;
Methods and Application in Rural Planning, Vikas
Publishing House PVT LTD.
Patton, 1990, Qualitative Evaluation and Research
Methods, Beverly Hills, CA: Sage.
United Nation, United Nation Partnership for evelopment
Framework 2011 – 2015 Indonesia
UNDP, 2013, Livelihoods and Economic Recovery in
Crisis Situations, New York.
UNDP, 2012, Development of Inclusive Markets in
Agriculture and Trade (DIMAT); An Assessment of
the Beans Value Chain in Uganda.
The Coffee Value Chain Analysis to Support Farmers Livelihood in Horsik Village, Ajibata Sub-district, Toba Samosir District, North
Sumatra
443
