
Social Activities Effect on Household Enterprise: A Descriptive
Analysis Form East Indonesia
Riswanti Budi Sekaringsih
Faculty of Islamic Economics and Business, State Islamic University (UIN), Sunan Kalijaga, Yogyakarta, Indonesia
Keywords: Informal Financial Market, Rotating Saving and Credit Association, Expenditure, Income, IFLS EAST.
Abstract: This research aims to explore empirically east Indonesian household entreprise on social activities and
financial wealth. We explore various indicators for example if individual have borrowed money from financial
institution, the number of community activites that they follow, joining rotating saving and credit association,
and their income from non-farm and farm business. This research uses IFLS (Indonesian Family Life Survey)
East that has wide range information on financial inclusion indicators and other socio-economics variables
that are not provided by other almost-similar-type database in East Indonesia. We use describtive statistic and
ordinary least square to estimate how social activites affected on household income and expenditure. The
findings that household who joining rotating saving and credit association will have higher expenditure and
lower income. Most of Indonesian people joining social activites that related on their expenditure and income.
More over this research leed people to know how to make informal financial market more efficient than
before.
1 INTRODUCTION
Economy crisis that hit Indonesia in the middle of
1997 and 2008 proved that micro and small
enterprises have proven as a self-sufficient business
who have a strong resistance. The data show that.
Data shows the number of micro and small
entrepreneurs 55,206,444 units that absorb
101,722,458 workers (Kementerian Koperasi dan
Usaha Kecil dan Menengah, 2015).
The definition of micro business is a business that
has assets or net assets of up to Rp. 50 million,
excluding land or buildings for business premises and
an annual sales turnover of up to Rp. 300 million
(Pemerintah Republik Indonesia, 2008). Usually
these micro-businesses are looking for a living and
are not export-oriented. Generally small and medium
micro business operators are households. This
business is carried out jointly by all household
members. The income earned will be used to finance
all household needs.
Household enterprise in this paper consists of two
types of households, the first is a household that
manages a business either independently or working.
The two agricultural households that process the land
then sell the produce. The household works
independently to fulfill their daily needs.
Unfortunately sometimes the household enterprise
has a low income so they have difficulty accessing
capital. This difficulty can be seen in their way to gain
financial access.
Financial acceas not only include primary savings
mobilization units with little or no lending; primary
lending units that are hardly involved in savings
mobilization. Further SOFIA (Survey on Financial
Inclusion and Access) found that limited access to
financial services has been identified as one of the key
constraints to people's participation in economic
activity in eastern Indonesia. Thats why in Indonesia
arises a lot of informal finance. This informal finance
is not related to banking.
The Eastern Indonesian Household Life Aspect
Survey (SAKERTI TIMUR or SAKERTIM) or also
known as the Indonesian Family Life Survey East
(IFLS East) conducted in 7 provinces in Eastern
Indonesia including: East Nusa Tenggara, East
Kalimantan, Southeast Sulawesi, Maluku, Maluku
North, West Papua and Papua. By using this
household data in East Indonesia. This study wants to
describe the effect of social activities undertaken by
households on income. This household income is
devoted to households that have businesses both
agricultural and non-agricultural. This research
consists of introduction, theoretical foundation,
methodology, discussion and closing.
52
Sekaringsih, R.
Social Activities Effect on Household Enterprise: A Descriptive Analysis Form East Indonesia.
DOI: 10.5220/0010114700002898
In Proceedings of the 7th ASEAN Universities International Conference on Islamic Finance (7th AICIF 2019) - Revival of Islamic Social Finance to Strengthen Economic Development Towards
a Global Industrial Revolution, pages 52-58
ISBN: 978-989-758-473-2
Copyright
c
2022 by SCITEPRESS – Science and Technology Publications, Lda. All rights reserved

2 LITERATURE REVIEW
When associated with income, consumption is the
portion of income spent on consumption needs.
Whereas savings are the portion of income that is
saved or not spent. Therefore, income is equal to
consumption and savings. This concept does not only
apply to households but to households that have
businesses. To increase income, it is necessary to
increase capital and access to obtain better finance
than before.
Limited access to financial services has been
identified as one of the key constraints to people's
participation in economic activity for many living in
eastern Indonesia who are in rural areas, small
farmers, and micro to medium household enterprises
(SOFIA et al., 2017).
According to Abebe, et.al. (Abebe, Tekle, &
Mano, 2018), promoting savings is important to
enterprise development because one way of building
adequate capital to overcome credit constraints and
withstand transitory business shocks, a safer option
for storing wealth than keeping money at home,
creating a relationship with formal financial
institutions, the cost of internal financing of
investment through savings is often much lower than
the cost of accessing credit and help in cases of
emergencies.
In Ethiopia (Abebe et al., 2018) , we found that
entrepreneurs who received only the financial literacy
training did not significantly increase saving. They
conducted a randomized controlled trial with 426
samples of operating micro-entrepreneurs in Addis
Ababa. Microentrepreneurs do not know the
importance of internally accumulating financial
resources and they also lack the necessary financial
or it is difficult to keep it up over the course of their
business operations. Because many household
enterprises have difficulty accessing formal finance,
they make certain associations. These include
savings, lending to members of associations or groups
such as: savings collectors and money keepers,
commercial lenders (money lenders), friends, family
and non-commercial lenders, self-help financial
groups that include different levels of savings and
credit rotating ones and licensed cooperative societies
or unions (State, 2013).
These are the group of informal finance as the
Rotating Savings and Credit Association (ROSCAS,
Arisan in Bahasa). They are the most basic forms of
savings and credit arrangements including regular
fixed amounts of contributions to a common pool of
funds by members in turn. Orders of receiving the
amounts are decided by negotiation, lottery or any
other agrements. Sometimes this method can be
called a lottery saving.
State, et.al (2013) Found that the informal finance
sector has considerable experience and knowledge
about dealing with small business borrowers and that
their performance in relation to financing small
business has been positive especially in Asia and
Latin America. Using A multi-stage sampling
technique to obtain information from 240
respondents. Then the data is analyzed using
descriptive and inferential statistics. Informal sources
of credit have been known to gain preferences from
micro and small-scale entrepreneurs. Informal
financial markets have been recognized as an engine
of rural and urban development.
3 ANALYSIS MODEL
3.1 Data and Method
3.1.1 Data
This paper uses IFLS East. IFLS East is a survey that
has been conducted in 2012. This survey cover in 7
provinces in Eastern Indonesia including: East Nusa
Tenggara, East Kalimantan, Southeast Sulawesi,
Maluku, Maluku North, West Papua and Papua.
Information in individual and household data levels
cover all socio-economic information, such as
education, occupation, religion, health, marriage,
active in the community and so forth. Furthermore, at
the community level we can obtain information about
the condition of infrastructure, socio-economic
conditions, and various social programs in the
community including the existence of financial
facilities that exist in every village.
In this study, we combine information of
individual, household, and community levels. The
purpose is to obtain a comprehensive picture of
household who being enterprise both in farm and non-
farm business and their demographic, socio-
economic and community characteristics. According
to that, we have 2310 households. More detail
explanation about our sample can be found in
Appendix.
3.1.2 Method
Descriptive statistics is used to get first description
and to compare average of each variable. For
instance, we compare the percentage of household
who have join community activities, rotating saving
and credit association and their income or
Social Activities Effect on Household Enterprise: A Descriptive Analysis Form East Indonesia
53
expenditure. The results are tabulated by using
STATA 14 and then transferred to the Microsoft
Excel 2016.
For control variables, we combine some variables
from individual and household levels. For individual
characteristics, we consider age, gender, education
level, and marital status as control variables. While
for household characteristics, we consider household
members, and household’s location. Lastly,
community characteristic will be represented by the
number of community activities and urban or rural
area. Then the formulate econometric specifications
as follows:
Financial Enterprise
)1(εββXcβXhβXdββY
i54i3i2i10i
XaXk
(1)
Where Y in the first model are the nominal amount of
income or expenditure in household. Then Xd
i
are
demographic characteristics (education, age, gender,
and marital status), Xh
i
is household characteristics
(education level of head household and the number of
household’s member), Xc
i
is community
characteristics (urban/rural), Xc
i
is number of
community activities that household join, and Xa
is
household join in rotating saving and credit
association. This research applies crossection data
analysis.
3.1.3 Result and Analysis
Before performing regression analysis, it is important
to look at descriptive statistics that enables us to see
common features. For this research we found 2,310
households who lives in the sample province. In our
study we tried to combine households that have
farming businesses and households that have non-
farm businesses. Further on figure 1. is 63.4% of the
respondents are farmers who have cultivated land.
This means that more than half of farmers in
Indonesia have land to be cultivated either by planting
rice or other food crops.
Figure 1: Percentace Of Responden Who Are Being Farmer
and Having Land.
Besides farmers we also observe households that
have a businesses or we called them household
enterprises. Small businesses run are generally small
business and intended to make a living. This
household business is usually carried out by
household members or all family members or helping
other families with kinship. In Figure 2, 40.83% of
households have a business. Coverage of household
enteprise that are run generally are micro-small and
medium businesses.
Figure 2: Percentace Of Who Being Household Enterprise.
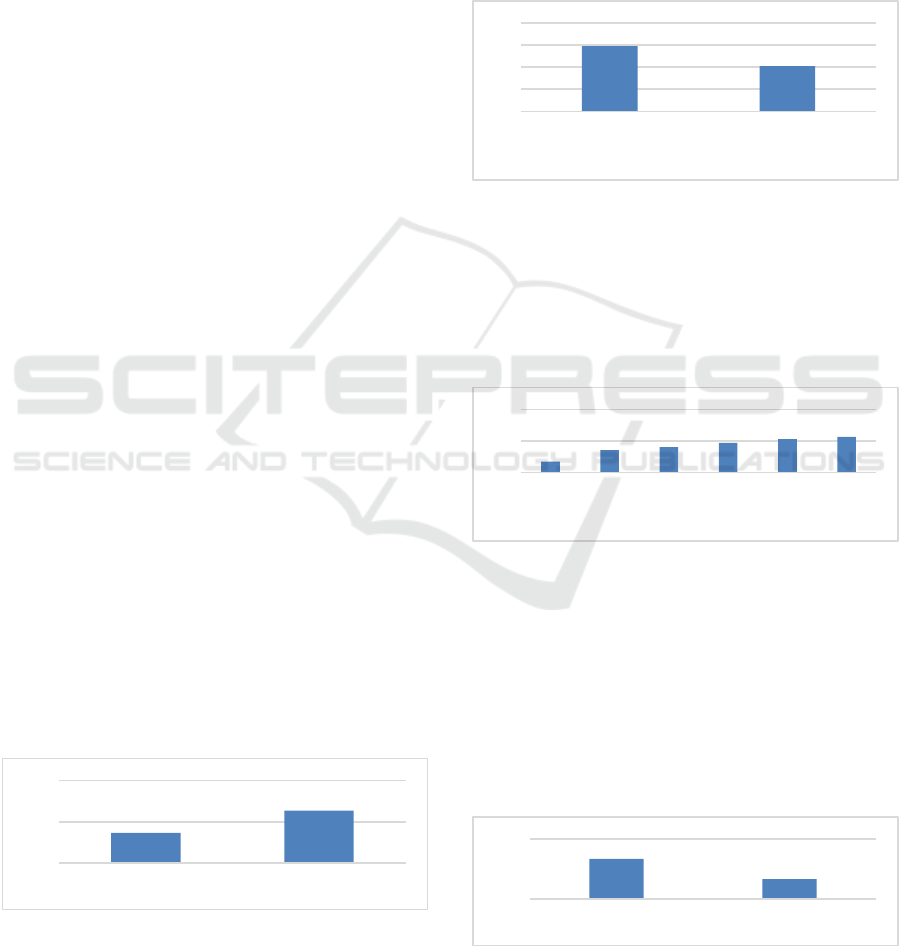
Then about their social activities. Most of East
Indonesian people love to join social activities. This
fact can be proved on figure3, there are only 6.97%
who aren’t join any social activities. This ini meant
more than 93% respondent joint minimal one social
activities.
Figure 3: Percentace Of Number Social Activities That
Followed By Household.
Further if we see figure 4, its only 32.94% of
household in East Indonesia who are joining rotating
saving and credit association or arisan. Social
activities that most they are joining can be community
meeting, cooperatives, village saving and loans,
PNPM Madani, and women activities (PKK). the
more social activities will have an impact on the
reduced time to work.
Figure 4: Percentace of Household who Joining Arisan.
0
50
100
No Land Farmer Own Land Farmer
0
20
40
60
80
No Household
Enterprise
Own Household
Enterprise
6,97
14,24
16,15
18,83
21,17
22,65
0
20
40
0 1 2 3 4 5 and
more
67,06
32,94
0
100
not participate participate arisan
7th AICIF 2019 - ASEAN Universities Conference on Islamic Finance
54
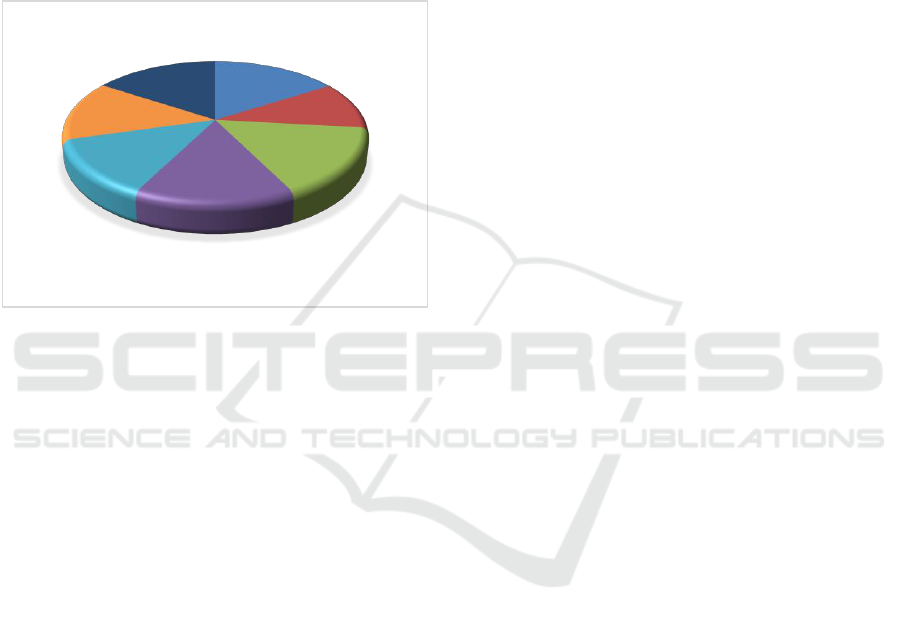
As shown in appendix, we know that 45% of
responden were living in urban area. Further if we see
in figure 5, we can find out that the respondent was
on the seven province of east Indonesia. And the
biggest respondent are comming from West Nusa
Tenggara and South East Sulawesi, 16% of total
respondent. More over 42% of the sample are joining
community activites that related to finance. 47% said
that they join arisan or rotating saving and credit
association. And the average money that they
contribute about 343.190.9 rupiah in month.
Figure 5: Percentace Of Household Location Distribution.
For financial numbers, we found that the average
total income is 24.300.000 rupiah in year. Meanwhile
for non farm business enterprise 8.623.800 rupiah in
month and 5.836.482 rupiah for farm business
enterprise.
As explained before, we have two variables. Each
interest variable will have three difference types of
regression and each type will be distinguished by the
type of enterprise, which is farm or non- farm. To test
those regression we use Ftest for overall variables and
T-test for every variables.
For income variable we found that age has
negative impact on farm income. This is mean that if
the farmer geting older they got lower income as the
decrease of their power. Join arisan or rotating saving
and credit association has negatif impact specialy on
farming. Its the same case for household who has loan
that has negative impact on income.
The otherwise for expenditure, age, education,
and join arisan or rotating saving and credit
association has positive impact on expenditure. Its
mean they get older their spending is getting bigger.
Household who has higher education mean spend
more money than other. And who join rotating saving
and credit association its mean more money to spend.
But household size has negative impact in
expenditure.
4 CONCLUSIONS
This research attempts to explain how social activities
determinant East Indonesia income and expenditure.
Together with all the variable gender, age, eduvation,
marital status, household size, house location, join
arisan, ever having loan and being farm or
enterpreneur are affect on household income or
expenditure. We found that social activities has
negative impact specially in income. Its show that
social activities not a good way to collect capital for
household enterprise.
Because of the inaccessibility of formal
institutions, household entreprise arrange themselves
to start business with resources from their self. Other
possible mechanisms, maybe we need to put some
social cultural factor that could explain East
Indonesian Income and Expenditure, require further
research
REFERENCES
Abebe, G., Tekle, B., & Mano, Y. (2018). Changing Saving
and Investment Behaviour: The Impact of Financial
Literacy Training and Reminders on Micro-businesses.
Journal of African Economies, 27(5), 587–611.
https://doi.org/10.1093/jae/ejy007
Kementerian Koperasi dan Usaha Kecil dan Menengah.
(2015). No Title Perkembangan Data Usaha
Mikro, Kecil, Menengah (UMKM) Dan Usaha Besar
(UB) Tahun 2010 - 2015. Retrieved from
http://www.depkop.go.id/uploads/laporan/1562040307
_SANDINGAN_DATA_UMKM_2010-2015_.pdf
Pemerintah Republik Indonesia. (2008). Undang-Undang
Republik Indonesia Nomor 20 Tahun 2008. Retrieved
from https://jdih.kemenkeu.go.id/fulltext/2008/20TAH
UN2008UU.htm
SOFIA, (BPS), K. K. dan U. K. dan M. B. P. S., Ibrahim,
N., Verliyantina, Anantadjaya, S. P., Finardi, B. A., …
Intan K. P., E. (2017). The Model of Crowdfunding to
Support Small and Micro Businesses in Indonesia
Through a Web-based Platform. International Journal
of Entrepreneurship and Small Business, 4(1), 51–62.
https://doi.org/10.13189/ujaf.2017.050101
State, O. (2013). Estimating Growth In Investment Of
Micro And Small Scale Enterprises In Nigeria Ojenike
Joseph Olusola Olowoniyi Adeyemi Olusola. 3(1), 111–
123.
Wooldridge, J. M. (2002). Econometrics Analysis Of Cross
Section And Panel Data. Cambridge: MIT Press.
Wooldridge, J. M. (2003). Introductory Econometrics: A
Modern Approach 2E. Ohio: Thomson South-Western.
West Nusa Tenggara
16%
East
Kalima
ntan
11%
South
East
Sulawesi
16%
Maluku
15%
North
Maluku
13%
West
Papua
14%
Papua
15%
Social Activities Effect on Household Enterprise: A Descriptive Analysis Form East Indonesia
55

APPENDIX
Descriptive Statistic
Variable
Description
Obs
Mean
Std. Dev.
Min
Max
hhid12
0
pid12
2,310
1
0
1
1
pidlink
0
age
age
2,310
44.18095
13.09813
17
105
sex
gender 1=male
2,310
0.831602
0.374301
0
1
marstat
marital status
2,310
2.090043
0.378774
1
3
educ
years in school
2,310
7.642857
4.595098
0
18
hhsize
household member
2,310
4.221645
2.046717
1
16
lnpce
log per capita expenditure
2,310
13.48855
0.802055
10.98917
16.10149
pce
per capita expenditure
2,310
999970.9
952227
59229.16
9835334
urban
=1 urban
2,310
0.286147
0.452057
0
1
trrel
religions
2,297
1.836308
0.966885
1
5
tragm
=1 moslem
2,310
0.54329
0.49823
0
1
hos_stat
=1 house ownership
2,310
0.764935
0.424131
0
1
kegiatan
number of community
activities
2,310
3.122078
1.760396
0
9
keg_keu
number of community
activities that related to finance
activities
2,310
0.954978
0.852814
0
4
ca_fin
1 = community activities that
related to finance activities
2,310
0.663204
0.472717
0
1
arpart
=1 join arisan
2,310
0.329437
0.470111
0
1
artype
arisan type
761
1.390276
0.751392
1
8
arattd
arisan in year
760
15.65
16.46007
0
144
aravrg
arisan in month
760
1.630263
1.377929
0
12
arcon1
arisan contribution in year
758
1944914
4.118.290
8000
54,000,000
arcon2
arisan contribution in month
758
162076.2
343.190.9
666.6667
4,500,000
arrec1
arisan recieve in year
761
1769616
4156741
0
50,000,000
arrec2
arisan recieve in month
761
147468
346395.1
0
4,166,667
income
total income
2,310
24.300.000
44,800,000
15000
772,000,000
inc_labor
labor income
2,310
9.680.017
20,800,000
0
173,000,000
inc_other
other income
2,310
194.361.5
2.212.642
0
52,000,000
inc_nfarm
non farm business income
2,310
8.623.800
37,900,000
0
772,000,000
inc_farm
farm business income
2,310
5.836.482
11,100,000
0
86,200,000
own
=1 own business
2,310
0.408225
0.491612
0
1
petani
=1 own land and farmer
2,310
0.634199
0.481758
0
1
7th AICIF 2019 - ASEAN Universities Conference on Islamic Finance
56

Income as dependent variable
(1)
(2)
(3)
pendapatan
inc_farm
inc_nfarm
age
-33995.4621
-60657.6497
***
21436.6841
(63701.1089)
(18240.4239)
(61079.4576)
sex
-1095811.5620
1170550.1974
-2608242.5378
(4314354.6069)
(611220.7596)
(4347781.7993)
educ
68455.0822
-1524.9096
56056.9765
(244881.9196)
(68203.3437)
(235265.9682)
marstat
-1666741.2313
912500.9310
-2921284.5885
(4560501.4111)
(715045.2357)
(4577974.4343)
hhsize
-227124.7812
-131915.5998
-37874.7302
(416756.8085)
(114917.2182)
(406653.1027)
urban
-1151019.7199
490947.5287
-1459708.5419
(2058358.7091)
(524304.6548)
(1969800.6544)
arpart
-2671144.6908
-1183540.3107
*
-1763874.5267
(1493025.7529)
(466807.5912)
(1465285.9700)
lever
952625.9470
-1387749.0339
**
2406430.0891
(2858993.4064)
(500724.0466)
(2833040.9997)
own
17787819.1504
***
20782562.9824
***
(1845396.8136)
(1904093.0392)
petani
-2286921.7622
4047816.1860
***
(1751161.9937)
(449347.0344)
_cons
16049948.7196
4092108.7815
*
7841332.0274
(13376087.3109)
(2044517.1419)
(13108406.2593)
Number of observations
2310.0000
2310.0000
2310.0000
Number of groups
Standard errors in parentheses
*
p < 0.05,
**
p < 0.01,
***
p < 0.001
Ln PCE as dependent variable
(1)
(2)
(3)
lnpce
lnpce
lnpce
age
0.0025
*
0.0024
*
0.0024
*
(0.0011)
(0.0011)
(0.0011)
sex
0.0401
0.0395
0.0371
(0.0418)
(0.0418)
(0.0418)
educ
0.0402
***
0.0402
***
0.0401
***
(0.0035)
(0.0035)
(0.0035)
marstat
-0.0163
-0.0171
-0.0194
(0.0425)
(0.0426)
(0.0425)
hhsize
-0.1761
***
-0.1758
***
-0.1755
***
(0.0077)
(0.0077)
(0.0077)
urban
0.4019
***
0.4051
***
0.4047
***
(0.0318)
(0.0317)
(0.0318)
Social Activities Effect on Household Enterprise: A Descriptive Analysis Form East Indonesia
57

(1)
(2)
(3)
lnpce
lnpce
lnpce
arpart
0.1079
***
0.1082
***
0.1058
***
(0.0301)
(0.0300)
(0.0300)
lever
0.0788
*
0.0786
*
0.0792
*
(0.0382)
(0.0382)
(0.0382)
own
0.0379
0.0461
(0.0278)
(0.0274)
petani
-0.0486
-0.0553
*
(0.0279)
(0.0276)
_cons
13.6689
***
13.6902
***
13.6445
***
(0.1202)
(0.1193)
(0.1192)
Number of observations
2310.0000
2310.0000
2310.0000
Number of groups
Standard errors in parentheses
*
p < 0.05,
**
p < 0.01,
***
p < 0.001
7th AICIF 2019 - ASEAN Universities Conference on Islamic Finance
58
