
Numerical Study of Bilge Keel Length Variations of Floating
Breakwater to Optimize Transmission Coefficient
Haryo Dwito Armono
1
, Ketut Suastika
2
, Asfarur Ridlwan
1
and Tito Biaperi
1
1
Department of Ocean Engineering, Institut Teknologi Sepuluh Nopember, Sukolilo, Surabaya, Indonesia
2
Department of Naval Architecture, Institut Teknologi Sepuluh Nopember, Sukolilo, Surabaya, Indonesia
Keywords: Floating Breakwater, Bilge Keel, Wings Plate, Computational Fluid Dynamics, Transmission.
Abstract: Waves and winds that move dynamically often cause damage on the coast so a protective beach building is
needed. Breakwater is a coastal protection structure to destroy the incoming wave energy before reaching the
coast. One type of breakwater is floating breakwater, this structure has an advantage compared to the fixed
breakwater. Research on floating breakwater has been developed with the main goal of being the most
efficient structure and can absorb waves well. In this research, floating breakwater simulation modeling with
variations in bilge keel length was conducted. Validation is done by comparing the results of (GH Dong,
2008) with numerical results of the breakwater pontoon type. There are four variations of bilge keel length,
namely 0 m, 0.6 m, 0.9 m, and 1.2 m. So, four variations can be concluded that the longer the bilge keel, the
better absorb the waves.
1 INTRODUCTION
Coastal areas need to be considered for safety against
erosion and wave surges. One of the structures to
protect the coast from waves is a breakwater. There
are two types of breakwater, bottom-founded
breakwater, and floating breakwater. Floating
breakwater has the advantage of bottom-founded
breakwater: (1) The time of construction is shorter
because it has been done in fabrication, (2) floating
breakwater can be easily moved, reassembled with
different layouts, and can be moved to different
locations, (3) floating breakwater is suitable for
muddy soil, (4) floating breakwater is more
environmentally friendly because it does not cause
pollution and sedimentation.
Floating breakwater (FB) research began around
one century ago, many studies and model tests were
carried out to develop floating breakwater. As
technology develops, research on floating breakwater
is rapidly increasing. There have been many studies
exploring floating breakwater where exploration will
continue to be developed to obtain the most optimal
results.
Experimentally and numerically of floating
breakwaters have been studied. According to G.H
Dong (2008), floating breakwater can be used
effectively in coastal areas with relatively mild wave
conditions. His experiment was to find a simple and
relatively inexpensive type, by studying 3 types of
structures including the shape of a single box, double
box, and board net. (Wang and Sun, 2010) conducted
a study of porous breakwater where the structure was
fabricated with large numbers of diamond-shapes
blocks arranged to reduce transmitted wave height
and the mooring force. (Drimer et al., 1992)
conducted a study of the simplification of a floating
breakwater design where width and wavelength are
the greater than the gap between the breakwater
position and sea bed. (William and Abul-Azm, 1997)
conducted a study of the hydrodynamic
characteristics of a dual pontoon floating breakwater
consisting of a rectangular floating cylinder
connected by a rigid deck. (Liang et al., 2004)
conducted research on the reflection and wave
transmission of floating breakwater spar bouys as a
well mooring forces.
This paper presents numerical simulation to
analysis transmission coefficients using
computational fluid dynamics (CFD) method. The
basic geometry is pontoon floating breakwater that
modified in several length variations of bilge keel on
the bottom of structure. Data parameters and
numerical model verifications based on the result of
experiments that conducted by (G.H. Dong., 2008).
Armono, H., Suastika, K., Ridlwan, A. and Biaperi, T.
Numerical Study of Bilge Keel Length Variations of Floating Breakwater to Optimize Transmission Coefficient.
DOI: 10.5220/0010060501910197
In Proceedings of the 7th International Seminar on Ocean and Coastal Engineering, Environmental and Natural Disaster Management (ISOCEEN 2019), pages 191-197
ISBN: 978-989-758-516-6
Copyright
c
2021 by SCITEPRESS – Science and Technology Publications, Lda. All rights reserved
191
2 NUMERICAL SIMULATIONS
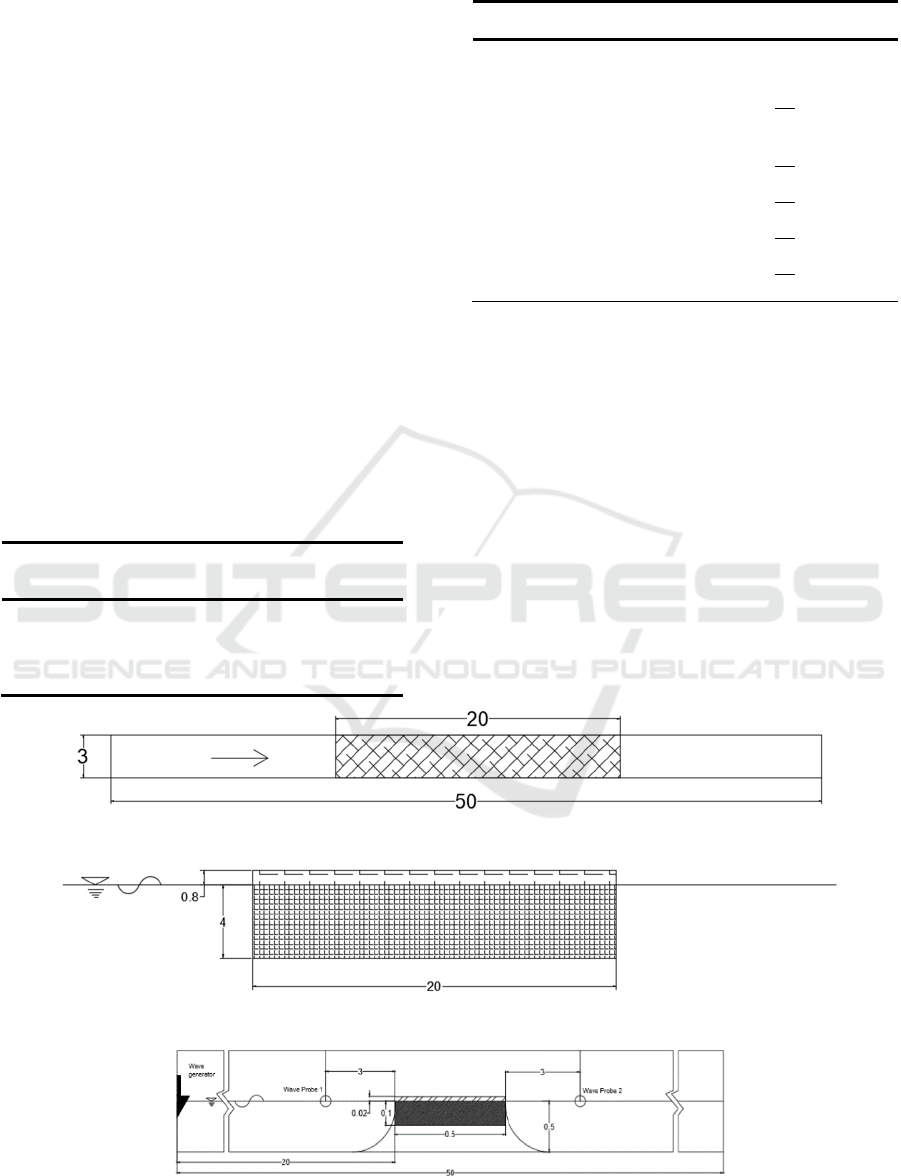
2.1 Dimension of Floating Breakwater
Floating breakwater dimension is obtained from
international journal data entitled “Experiments on
wave transmission coefficients of floating
breakwaters” by G.H Dong (2008). See figure 1 and
figure 2 for cross section of the prototype of floating
breakwater by GH Dong. The data will be used to
compare the G.H Dong experimental test with a
numerical test. The data that will be used in numerical
test modelling are as follows, see table 1.
2.2 Data Parameters
Research conducted by (G H Dong, 2008) uses
environmental data (wave height and wave period
data). The test uses a model scale, so the enviromental
data used data that has been scaled too. The data are
scaled by assuming Froude scaling to be valid. For
detail, see table 2.
Table 1: Pontoon Dimensions.
No Dimension
Prototype
[m]
Scale
Model
[m]
1 Length (L) 20 1:40 0.50
2 Width (B) 6 1:40 0.15
3 Height (H) 4.8 1:40 0.12
Table 2: The Wave Parameter Data (Froude Scaling).
No. Dimension Prototype Scale Model
1. Wave
Heigh
2.5 m 1:40 0.0625m
2 Wave
Period
6 s
1:
√
40
0.949 s
7 s
1:
√
40
1.107 s
8 s
1:
√
40
1.265 s
9 s
1:
√
40
1.423 s
10 s
1:
√
40
1.581 s
2.3 The Wave Flume
Wave flume that is modeled is in the State Key
Laboratory of Coastal and Offshore Engineering,
Dalian University of Technology, China. The flume
is 20 m long, 3 m wide, 1 m high, and 0.5 m water
depth. The flume is filled water with density of 1000
kg/m
3
. The flume is equipped with a hydraulically
driven, piston-type irregular wave generator at one
end and a wave absorber at the other. The floating
breakwater model is located at 20 meters from the
wave maker. The waves come from the left toward
the right across the structure. The number of wave
probes used is two, probe 1 is located 3 meters in front
of the structure and probe 2 is located at 3 meters
behind the structure. See, Fig. 3 for illustration.
Figure 1: Basic Cross-section Pontoon FB (Top View).
Figure 2: Basic Cross-section Pontoon FB (Side View).
Figure 3: Sketch of Wave Flume (Side View).
ISOCEEN 2019 - The 7th International Seminar on Ocean and Coastal Engineering, Environmental and Natural Disaster Management
192

2.4 Developed Floating Breakwater
Developed floating breakwater is intended to
determine shapes of floating breakwater which is
effective in reducing wave energy. Developed shape
of floating breakwater refers to the single-box
floting breakwater by GH Dong. Therefore, this
research will be changed variations of bilge keel
length. The developed floating breakwater can be
seen on figure 4.
2.5 Wave Measurements and Analysis
The objective of this study was to obtain the
transmission coefficient (C
T
), the ratio of transmitted
wave height (H
T
) to incident wave height (H
i
). See
equation 1 below:
C
T
= H
T
/ H
i
(1)
Measurement of transmitted and incident wave
heights were represented by surface elevation using
wave gauges.
2.6 Mooring System
The structure is connected to the sea bed by mooring
chains. There are six mooring chains on each side of
floating breakwater. Each mooring chain is 0.1 m in
diameter, 60 m in length, and 230 kg/m in unit mass.
2.7 Boundary Conditions
The purpose of boundary conditions is to determine
model conditions that represented experiment
conditions. See figure 5. Boundary conditions used in
the model are as follow:
(1) Free surface (Wave): A wave boundary condition
was defined at left (X Min). A surface wave
entered the computational domain and
propagated in the direction normal to the
boundary. The wave was set 2
nd
stokes as wave
generator represent the physical wave conditions
at the boundary.
(2) Outflow: The outflow boundary condition was
defined at right (X Max). It allowed users to
numerically investigate the effects of wave
interactions with structures. The capability
permited a reduction in the extent of the
computing mesh needed for accurate
computations. A wave-absorbing layer used to
reduce reflection of periodic wave at an open
boundary.
(3) Symmetry: The symmetry condition was defined
at front (Y Min), behind (Y Max), below (Z
Min), and up (Z Max). No-slip conditions were
imposed using the wall shear-stress options
described in the Prandtl Mixing Length model. A
symmetry condition can be specified as free-slip
conditions that have a non-zero wall shear-stress.
2.8 Meshing
Mesh block is used to determine the area that
modelled. The smaller mesh will be more detailed,
but the output files will be larger and simulations run
longer. Floating breakwater modelling used two mesh
block, (1) Block A with a meshing size of 0.06 m at
total length (X-axis) is 20 m, total width (Y-axis) is 3
m, and total height (Z-axis) is 1 m, (2) Block B with
a meshing size of 0.01 at length (X-axis) is 19.95-
20.19, width (Y-axis) is 1.2-1.8, and height (Z-axis)
is 0.4-0.6. See figure 6 for the illustration.
3 RESULTS AND DISCUSSION
3.1 Validation
Validation is done by comparing the experiment
result with the modelling result. The comparison uses
a transmission coefficient which is illustrated in one
graph (H/L Vs K
t
). Validated if the modeling results
show the similarity of trend curve with experimental
results. If not, redesign the geometry model and do
the modeling again until the results really match.
= 20, B= 6, S= 0 (m) L=20, B= 6, S=0.6 (m) L=20, B= 6, S=0.9 (m) L=20, B= 6, S=1.3 (m)
Figure 4: Developed of Floating Breakwater (S = Bilge Keel Length) in meter.
Numerical Study of Bilge Keel Length Variations of Floating Breakwater to Optimize Transmission Coefficient
193
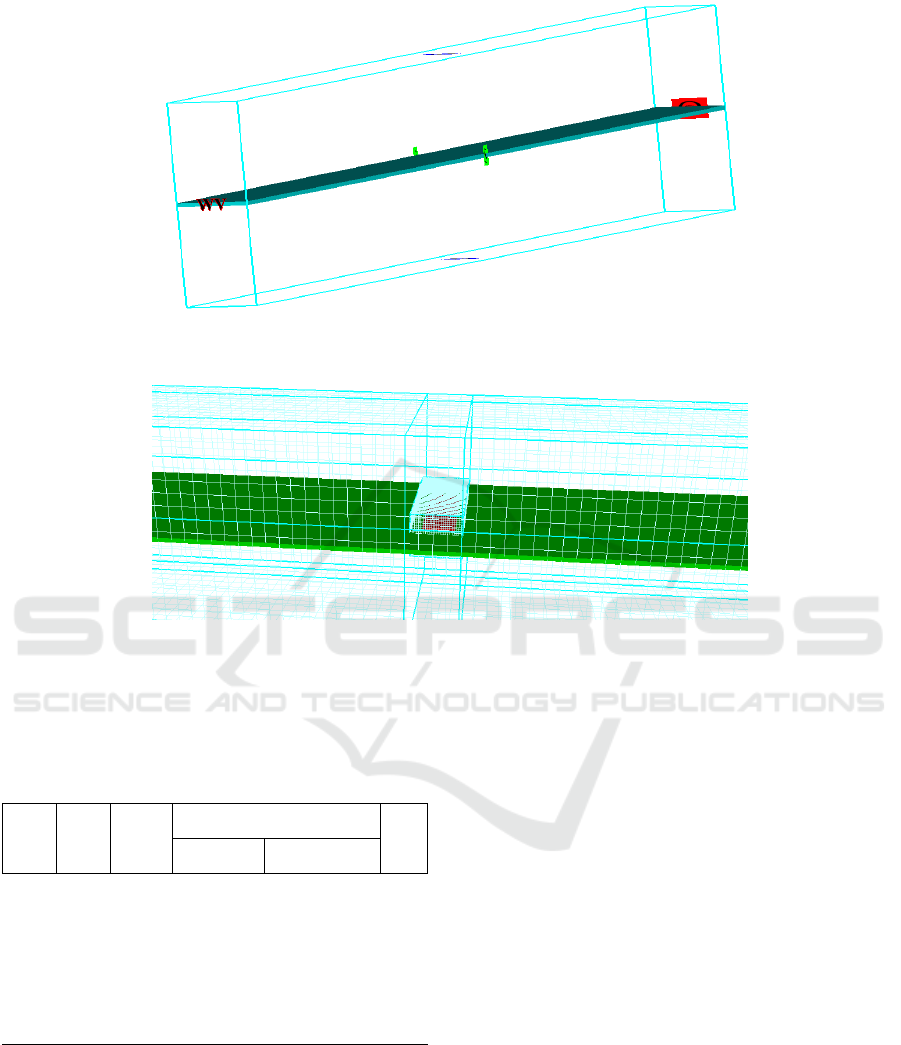
Figure 5: Boundary Conditions Model.
Figure 6: Mesh-size Model.
Here, the results of modeling validation with the
experiment are shown on tabel 3. More detail see
figure 7.
Table 3: The Validation of Transmission Coefficient.
H T H/L
K
T
Eror
Numeric Experiment
0.0625
0.949 0.0452 0.325 0.356 7%
1.107 0.0345 0.661 0.654 2%
1.265 0.0282 0.908 0.844 8%
1.425 0.0238 0.960 0.873 10%
1.581 0.0206 0.891 0.815 10%
The graph on figure 7 explain that the transmission
coefficient in numerical modeling and experiment
test has almost the same similarity and valid based on
Mean Absolute Percentage Error (MAPE) theory.
However, there are still difference in value of
transmission coefficient which may be caused by
differences in recording wave gauges or meshing
size.
3.2 Transmission Coefficient Result
3.2.1 Model 1 (Without Bilge Keel)
Data from modeling of floating breakwater in Model
1 (without bilge keel) were obtained from recording
of waves elevation on wave gauges in the form of
time series data. The data is then processed using
statistics Wave Analysis (WAVAN). The following
is transmission coefficient result in Model 1, see
table 4.
3.2.2 Model 2 (0.6 m Length of Bilge Keel)
Data from modeling of floating breakwater in Model
2 (0.6 m length of bilge keel) were obtained from
recording of waves elevation on wave gauges in the
from of time series data. The data is then processed
using statistics Wave Analysis (WAVAN). The
following is transmission coefficient result in Model
2, see tabel 5.
ISOCEEN 2019 - The 7th International Seminar on Ocean and Coastal Engineering, Environmental and Natural Disaster Management
194
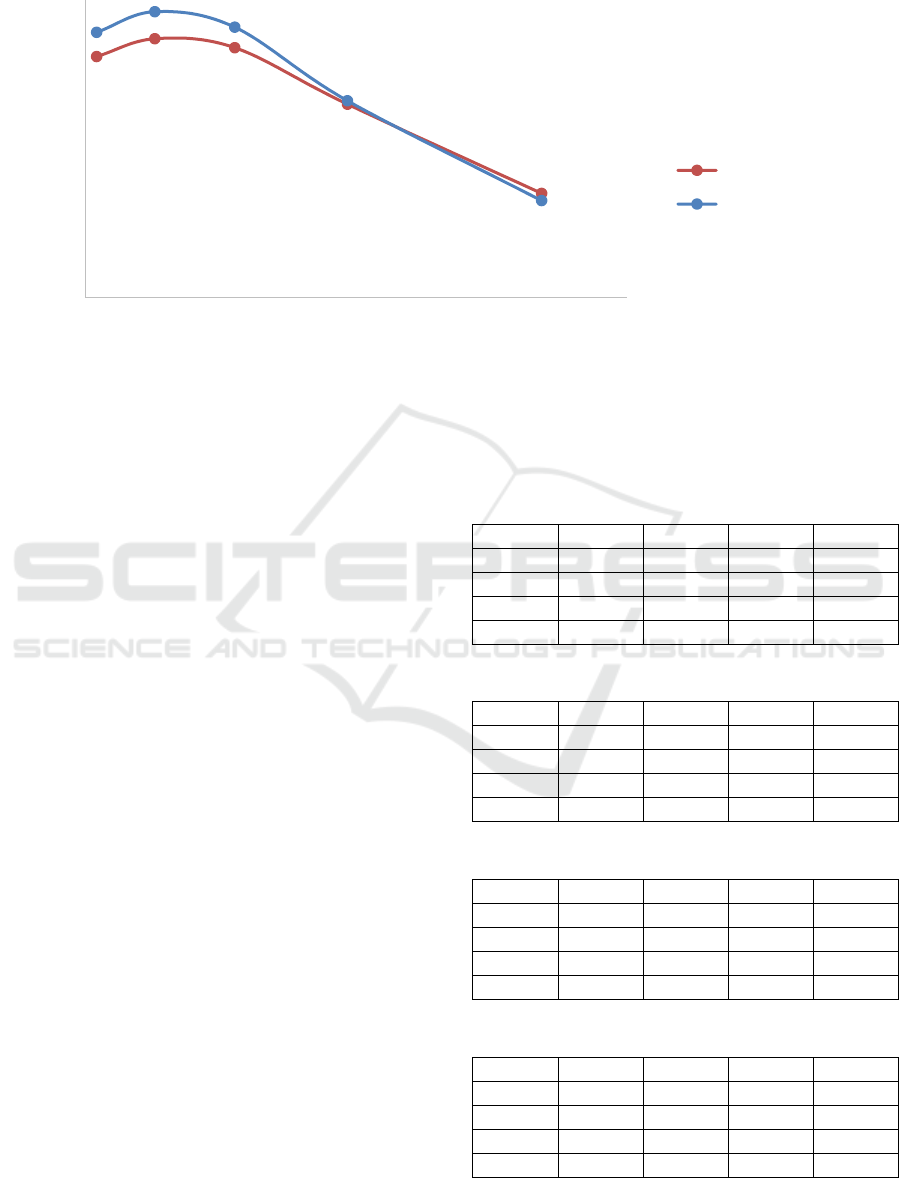
Figure 7: Validation graphic (K
T
Vs H/L).
3.2.3 Model 3 (0.9 m Length of Bilge Keel)
Data from modeling of floating breakwater in Model
3 (0.9 m length of bilge keel) were obtained from
recording of waves elevation on wave gauges in the
from of time series data. The data is then processed
using statistics Wave Analysis (WAVAN). The
following is transmission coefficient result in Model
3, see tabel 6.
3.2.4 Model 4 (1.3 m Length of Bilge Keel)
Data from modeling of floating breakwater in Model
4 (1.3 m length of bilge keel) were obtained from
recording of waves elevation on wave gauges in the
from of time series data. The data is then processed
using statistics Wave Analysis (WAVAN). The
following is transmission coefficient result in Model
4, see tabel 7.
3.3 Comparison Model Result
In order to know the results that are easily understood,
numerical modellings of Model 1 up to Model 4 are
compared in one graph as shown in figure 8. Figure 8
shows the correlation of transmission coefficient (K
T
)
with wave steepness (H/gT
2
) at depth of 0.5 meters
and variations in wave height (H) and wave period
(T). Transmission coefficient in model 1 ranges from
0.233-0.390, model 2 ranges between 0.221-0.377,
model 3 ranges between 0.210-0.370, and model 4
ranges between 0.205-0.365. The higher the wave
height the smaller the wave period is the steeper the
wave steepness. Figure 8 shows that each model has
a transmission coefficient that continues to decrease
with increasing wave steepness.
Table 4: Graphic of K
T
Vs H/gT
2
on Model 1.
No H
i
T
i
H/gT
2
K
T
1 0.0240 0.800 0.004 0.390
2 0.0380 0.684 0.009 0.298
3 0.0550 0.658 0.012 0.281
4 0.0550 0.575 0.016 0.233
Table 5: Graphic of K
T
Vs H/gT
2
on Model 2.
No H
i
T
i
H/gT
2
K
T
1 0.0240 0.800 0.004 0.377
2 0.0380 0.684 0.009 0.287
3 0.0550 0.658 0.012 0.270
4 0.0550 0.575 0.016 0.221
Table 6: Graphic of K
T
Vs H/gT
2
on Model 3.
No H
i
T
i
H/gT
2
K
T
1 0.0240 0.800 0.004 0.370
2 0.0380 0.684 0.009 0.278
3 0.0550 0.658 0.012 0.260
4 0.0550 0.575 0.016 0.210
Table 7: Graphic of K
T
Vs H/gT
2
on Model 4.
No H
i
T
i
H/gT
2
K
T
1 0.0240 0.800 0.004 0.365
2 0.0380 0.684 0.009 0.265
3 0.0550 0.658 0.012 0.250
4 0.0550 0.575 0.016 0.205
0
0.1
0.2
0.3
0.4
0.5
0.6
0.7
0.8
0.9
1
0.02 0.025 0.03 0.035 0.04 0.045 0.05
transmission coefficient
H/L
Numeric and Experiment Validation
Experiment Modeling
Numeric Modeling
C
CC
Numerical Study of Bilge Keel Length Variations of Floating Breakwater to Optimize Transmission Coefficient
195

Figure 8: Comparison of Four Models Results (K
T
Vs H/gT
2
).
4 CONCLUSIONS
In this study, a two-dimensional numerical simulation
was analysed for floating breakwater. Previously, the
results were validated by experiments that had been
carried out by G.H Dong. After that, the development
of floating breakwater shapes are analysed by
numerical simulation using Computational Fluid
Dynamics (CFD) method. There are four
development shapes of floating breakwater analysed
that are based on the length of bilge keel. The results
are that longer the bilge keel, the more efficient the
transmission coefficient can reduce wave energy.
ACKNOWLEDGEMENTS
This study was in part of founded Directorate General
of Resources for Science Research. The Author
would like thanks to the team research and the
Directorate General of Resources for Science,
Technology and Higher Education; Ministry of
Research, Technology and Higher Education, the
Republic of Indonesia, which funding this project of
research.
REFERENCES
Armono, HD. Supriadi, H., Yuniardo., RK. 2009.
“Pemakaian Floaton untuk Pemecah Gelombang
Terapung (Floating Breakwater)”, Prosiding Seminar
Nasional Teori dan Aplikasi Teknologi Kelautan IX,
Kampus ITS Surabaya
Armono, HD., Suastika., KS., Sujantoko., Sholihin.,
Supriadi, H. 2011. “Laporan Akhir Riset Andalan
Perguruan Tinggi dan Industri : Rancang Bangun
Floating Breakwater High Density Polyethylene untuk
Pulau-pulau Kecil di Indonesia”, LPPM ITS
Bellingham Marine Industries Inc., 2014, Unifloat Wave
Attenuator Systems, [brochure], (www.bellingham-
marine.com, diakses pada tanggal 1 September 2018)
Dong, G.H., Zheng, Y.N., Lia, Y.C., Tenga, B., Guanc,
C.T., Lin., D.F. 2008. “Experiments on Wave
Transmission Coefficients of Floating Breakwaters”,
Ocean Engineering 35 (2008) 931–938.
Drimer, N., Agnon, Y., Stiassnie, M. A simplified
analytical model for a floating breakwater in water of
finite depth, Applied Ocean Research Vol. 14 (1)
(1992) 33-41, https://doi.org/10.1016/0141-1187(92)
90005-5.
Fahli Achmad Zulfikar Fazli , Minggu, 20 Nov 2016 15:37
WIB, Indonesia Hanya Punya Lima Pelabuhan Marina,
di akses 2 Sep 2018 dari http://news.metrotvnews.com/
peristiwa/MkMynMpk-indonesia-hanya-punya-lima-
pelabuhan-marina,
Floating Breakwaters., di akses 2 September, 2013, dari
http://sfmarinausa.com/floating-breakwaters/
Floating Breakwaters di akses 2 September, 2013, dari
http://www.freepatentsonline.com
Floating breakwater in Messolonghi, Greece., di akses 2
September, 2013, dari http://www.fdn-engineering.nl/
floating-breakwater-in-messolonghi
Fousert M.W. 2006, Floating Breakwater , “A Theoretical
Study of a Dynamic Wave Attenuating System”,
Master Thesis, Delft University of Technology.
Hirt, C.W., and Nichols, B.D., (1981). "Volume of Fluid
(VOF) Method for the Dynamics of Free Boundaries",
Journal of Computational Physics Vol. 39, pp. 201-225.
Kurniawan, R. (2013). Model Numerik Koefisien
Transmisi pada Floating Breakwater Trapesium dengan
FLOW3D, Tugas Akhir Jurusan Teknik Kelautan FTK
ITS.
0.0
0.1
0.2
0.3
0.4
0.5
0.6
0.002 0.007 0.012 0.017 0.022
Transmission Coefficient
H/gT^2
Model 1
Model 2
Model 3
Model 4
ISOCEEN 2019 - The 7th International Seminar on Ocean and Coastal Engineering, Environmental and Natural Disaster Management
196

Liang, N.K., Huang, J.S., Li, C.F. A study of buoy floating
breakwater Ocean Engineering, 31 (2004), pp. 43-60.
Mangor, K. 2004. “Shoreline Management Guidelines”.
DHI Water and Environment, 294p.
Pena, E., Ferreras, J., Sanchez-Tembleque, F.,
2011.”Experimental Study on Wave Transmission
Coefficient, Mooring Lines and Module Connector
Forces with Different Designs of Floating
Breakwaters”. Ocean Engineering 38 (2011)1150–
1160.
Pusat Penelitian Kelautan ITS, 2015. Road Map Penelitian
Pusat Penelitian Kelautan ITS 2015-2019.
US Army Corps of Engineers., (2000), “Coastal
Engineering Manual”
Wang, H.Y., Sun, Z.C. Experimental study of a porous
floating breakwater, Ocean Engineering 37 (5–6)
(2010), 520-527. https://doi.org/10.1016/j.ocean
eng.2009.12.005.
Williams, A.N. , Abul-Azm, A.G. Dual pontoon floating
breakwater, Ocean Engineering 24 (5), (1997), 465-
478, https://doi.org/10.1016/S0029-8018(96)00024-8.
Numerical Study of Bilge Keel Length Variations of Floating Breakwater to Optimize Transmission Coefficient
197
