
Wind and Significant Wave Height at Indonesian Seas
based on ERA5 Reanalysis Data from 2008 to 2018
Ocha Bahtara and Muhammad Zikra
a
Department of Ocean Engineering, Institut Teknologi Sepuluh Nopember, Surabaya, Indonesia
Keywords: Significant Wave Height, Wind, ERA5 Reanalysis Data.
Abstract: Wind and waves are important elements in coastal engineering and oceanography. Research on variations of
in-situ winds and wave’s measurements is still very limited in Indonesia. Therefore, wind speed and
significant wave height data from ERA5 reanalysis data, provided by the European Centre for Medium-Range
Weather Forecast (ECMWF), and is used in this study. ERA5 data that has a spatial resolution of 0.25 ° x
0.25 ° is used to analyze correlation between wind speed and significant wave height at Indonesian seas in
2008 to 2018. The results show that wind speed and significant wave height in the closed water (inter-island
in Indonesian archipelago) has a higher correlation compared to the Indonesian open sea that facing the Indian
Ocean or Pacific Ocean.
1 INTRODUCTION
Wave height at sea level is very dependent on sea
wind conditions. Understanding of tides and waves of
sea water is a major requirement in the management
of coastal areas (Yulius et al, 2017, Khoiri, 2015).
Information about the sea wave itself is also very
much needed in various maritime interests and
activities. There are so many maritime studies that
require this information, for example in research on
breakwater structures (Torum et al, 2012). Significant
wave height data is used to determine the speed of
sediment transport on sandy beaches (Van Rijn,
2014). Significant wave height data is also needed in
planning offshore buildings, for example in research
on water breaking on ships (Dehghani et al, 2017) or
effect of global warming on wave climate (Zikra et al,
2015).
Significant wave height is one of the important
variables in disaster mitigation and coastal
vulnerability using the CVI (Coastal Vulnerability
Index) method (Serafim et al, 2019). This is used to
estimate the vulnerability of coastal areas to the
impacts of disasters that might occur. In the field of
shipping, the height of sea waves is one of the
important factors that are taken into account in
a
https://orcid.org/0000-0001-6400-8042
determining the recommendations of ship shipping
safety (Lutfiana and Tirono, 2013).
Analysis of significant wave height needs to be
done because of the importance of information about
significant wave heights needed for the benefit of
research and maritime activities. One of the data that
can be used in a significant wave height analysis is
satellite data. Satellite data from the European Center
for Medium Range Weather Forecast (ECMWF) will
be used in this final project. ECMWF is considered to
have reliable atmospheric data for research and
evaluation (Hwang et al, 2019). ERA5, the fifth
generation of ECMWF Reanalysis, is one of the
global atmospheric reanalysis data products provided
by ECMWF. ERA5 is an ECMWF product made to
replace its predecessor, ERA-Interim. ERA5 data has
a higher resolution than ERA-Interim (Hersbach and
Dee, 2016). ERA 5 has a grid size of 0.25° x 0.25°,
while the ERA-Interim has a grid resolution of 0.75°
x 0.75°. Olauson (2018) concluded that ERA5 has a
lower error value and has more advantages than
MERRA-2 (Olauson, 2018). Because of the various
advantages of ERA5, the ERA5 data will be used in
this research to analysis the variation of significant
wave height (Hs) and wind speed in Indonesian
waters.
Bahtara, O. and Zikra, M.
Wind and Significant Wave Height at Indonesian Seas based on ERA5 Reanalysis Data from 2008 to 2018.
DOI: 10.5220/0010060001730180
In Proceedings of the 7th International Seminar on Ocean and Coastal Engineering, Environmental and Natural Disaster Management (ISOCEEN 2019), pages 173-180
ISBN: 978-989-758-516-6
Copyright
c
2021 by SCITEPRESS – Science and Technology Publications, Lda. All rights reserved
173
2 DATA
The wind and wave data used in this study is obtained
from ECMWF ERA5 (https://www.ecmwf.int). Data
obtained is hourly data in Indonesia seas during 2008
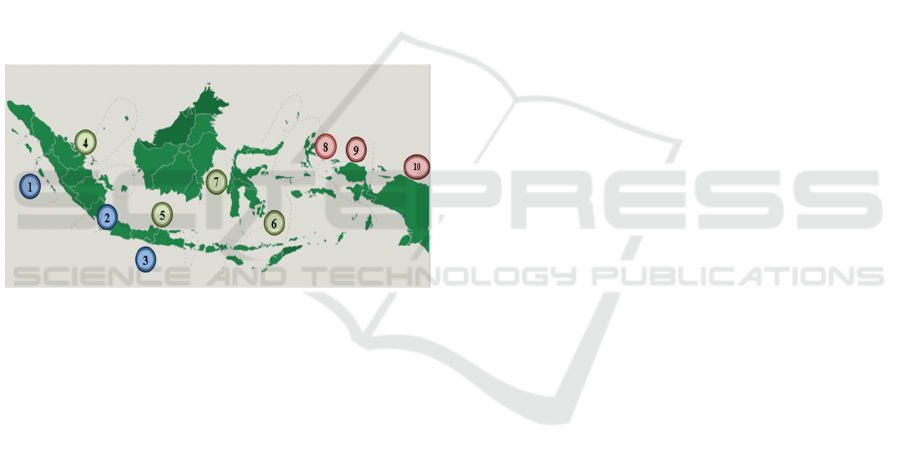
to 2018. The location points reviewed are:
1. Western Sumatera, Indian Ocean (3,75° S and
99,75° E)
2. Sunda Strait (6° S and 105,75° E)
3. Southern Java (8° S and 110° E)
4. Malaka Strait (3,75° N and 99,75° E)
5. Java Sea (6,75° S and 112,5° E)
6. Flores Sea (6,75° S and 121,5° E)
7. Makassar Strait (1,5° S and 117,5° E)
8. Halmahera Sea (1,5° N and 129,25° E)
9. Northern Papua (0,25° Sand 135° E)
10. Jayapura (2,25° Sand 140,5° E)
Figure 1: Reviewed location points in Indonesian Seas.
These locations are divided into 3 zones, namely open
water zone facing the Indian Ocean (locations 1, 2
and 3), sheltered water zone (locations 4, 5, 6, and 7),
and open water zone facing the Pacific Ocean
(locations 8, 9 and 10).
3 RESULT AND DISCUSSION
3.1 Variation of Wind Speed
The trend of wind speed on monthly average during
2008-2018 can be seen in Table 1. In Southern
Sumatera, the statistically significant trend is only
appeared in September's with monthly maximum
wind speed of 0.193 m.s
-1
/year. In Sunda Strait, the
monthly maximum wind speed has a significant
increasing trend of 0.176 m.s
-1
/year. Monthly
maximum wind speed and mean wind speed in
Southern Java have a significant increasing trend in
November and December. The trend of monthly
maximum wind speed in Southern Java has a
significant increasing
The trend of monthly maximum wind speed in
November is 0.279 m.s
-1
/year and in December is
0.364 m.s
-1
/year. The monthly mean wind speed trend
in November is 0.104 m.s
-1
/year and in December is
0.126 m.s
-1
/year. Monthly maximum wind speed in
Malaka Strait has a value of increasing trend at 0.191
m.s
-1
/year in February, 0.201 m.s
-1
/year in April,
0.208 m.s
-1
/year in November, and 0.255 m.s
-1
/year in
December. Whereas the monthly mean wind speed in
Malaka Strait has a significant increasing trend in
January (0.147 m.s
-1
/year), February (0.066 m.s
-
1
/year), May (0.051 m.s
-1
/year), June (0.046 m.s
-
1
/year), September (0.174 m.s
-1
/year), October (0.147
m.s
-1
/year), and December (0.112 m.s
-1
/year). The
calculation of monthly mean wind speed trend in Java
Sea shows that there is no significant trend every
month throughout the period of 2008-2018.
Meanwhile the monthly maximum wind speed trend
value in Java Sea in June has a significant increasing
trend of 0.095 m.s
-1
/year. The calculation of
maximum wind speed and monthly mean trend in
Flores Sea shows that there is no significant trend
every month throughout 2008-2018. The monthly
average wind speed in Makassar Strait in December
had a significant increasing trend of 12.52 m.s
-1
/year.
The trend was also significantly increase by 0.125
m.s
-1
/year in March, in contrast there was no
significant monthly maximum wind speed trend value
in Makassar Strait throughout the years of 2008-2018.
Moreover, the monthly maximum wind speed in
Halmahera Sea has a significant decreasing trend in
May (-0.375 m.s
-1
/year) and a significant increasing
trend (0.172 m.s
-1
/year) in October. The monthly
mean wind speed in Halmahera Sea has a significant
decreasing trend in May (-0.07 m.s
-1
/year) and a
significant increasing trend in March and April of
0.117 m.s
-1
/year and 0.039 m.s
-1
/year.
Furthermore, monthly maximum wind speed in
Southern Papua does not have a significant trend
throughout 2008-2018. The monthly mean wind
speed in Utara Papua has a significant increasing
trend in February by 0.099 m.s
-1
/year, 0.081 m.s
-
1
/year in April, 0.091 m.s
-1
/year in November, and
0.113 m.s
-1
/year in December. Monthly maximum
wind speed in Jayapura in October has a decreasing
trend of -0.115 m.s
-1
/year. The mean monthly wind
speed in Jayapura has an increasing trend in February
(0.136 m.s
-1
/year), November (0.079 m.s
-1
/year), and
December (0.093 m.s
-1
/year). Wind rose at 10
reviewed location points during 2008-2018 can be
seen in Figure 3.
ISOCEEN 2019 - The 7th International Seminar on Ocean and Coastal Engineering, Environmental and Natural Disaster Management
174
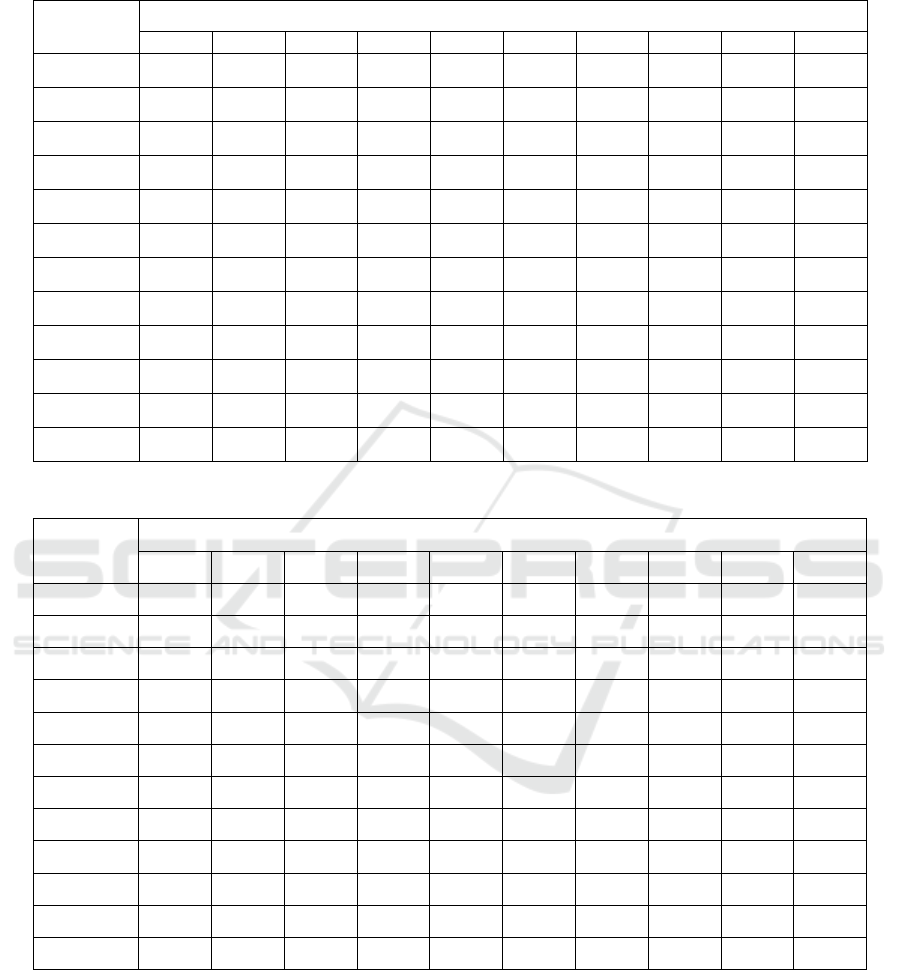
Table 1: Monthly mean wind speed trend 2008-2018.
Month
Monthly Mean Wind Speed Trend (m.s
-1
/year)
1 2 3 4 5 6 7 8 9 10
January
0.095 0.029 -0.024 0.147 -0.074 -0.104 0.057 -0.003 -0.043 -0.068
February
-0.111 -0.060 -0.016 0.066 -0.081 -0.100 0.035 0.052 0.099 0.136
March
-0.063 -0.058 -0.018 0.004 0.042 0.121 0.074 0.117 0.071 0.081
April
0.018 -0.013 0.002 0.035 0.022 -0.063 0.009 0.039 0.081 0.056
May
-0.060 -0.015 0.046 0.051 0.059 0.032 -0.019 -0.070 -0.007 0.017
June
-0.041 0.004 0.019 0.046 0.007 -0.007 -0.029 -0.027 -0.013 0.029
July
-0.029 0.005 -0.015 0.073 0.050 -0.004 0.028 0.073 -0.015 -0.068
August
0.014 0.034 0.003 0.085 0.023 -0.006 0.097 0.120 -0.019 -0.033
September
0.084 -0.019 -0.025 0.174 0.061 0.052 -0.011 0.090 -0.026 -0.018
October
0.028 0.009 -0.001 0.147 0.021 -0.015 0.043 0.068 -0.018 -0.040
November
0.084 0.025 0.104 0.080 0.070 0.047 0.083 0.061 0.091 0.079
December
0.037 0.057 0.126 0.112 0.100 -0.007 0.125 0.060 0.113 0.093
Table 2: Monthly mean significant wave height trend 2008-2018.
Month
Monthly Mean Significant Wave Height Trend (m/year)
1 2 3 4 5 6 7 8 9 10
January
0.014 0.012 0.000 0.002 -0.013 -0.018 0.006 0.001 -0.012 -0.009
February
-0.008 -0.017 -0.005 0.007 -0.015 -0.024 0.007 0.013 0.014 0.015
March
0.000 -0.010 0.004 0.001 0.008 0.021 0.007 -0.004 -0.004 -0.001
April
-0.002 -0.001 0.006 0.003 0.003 -0.008 0.002 0.006 -0.005 0.006
May
0.004 -0.002 0.005 -0.004 0.012 0.010 0.000 -0.004 -0.010 -0.003
June
0.013 0.005 0.007 0.003 0.000 0.007 -0.003 -0.008 0.003 -0.004
July
0.019 0.006 0.024 -0.001 0.006 0.000 0.001 0.010 -0.001 0.001
August
0.019 0.004 0.011 -0.001 0.001 -0.003 0.012 0.013 0.001 -0.002
September
0.005 -0.001 -0.006 0.003 0.011 0.007 -0.001 0.014 0.011 0.002
October
0.006 0.002 -0.003 0.002 0.003 -0.001 0.007 0.018 0.053 0.010
November
0.009 -0.001 0.009 0.002 -0.002 -0.003 -0.001 0.007 0.003 0.010
December
0.014 0.014 0.016 0.010 0.016 0.008 0.008 0.001 0.013 0.005
3.2 Variation of Significant Wave
Height
Significant monthly mean wave height in Western
Sumatera has a significant increasing trend in August
at 0.019 m/year, while monthly maximum significant
wave height in Southern Sumatera has an increasing
significant trend in July by 0.081 m/year and 0.062
m/year in August. The calculation of the maximum
monthly significant wave height trend in Sunda Strait
shows that there is no significant trend every month
throughout the years 2008-2018, while the monthly
significant wave height trend value in Sunda Strait,
July, has a significant increasing trend of 0.006
m/year.
Wind and Significant Wave Height at Indonesian Seas based on ERA5 Reanalysis Data from 2008 to 2018
175
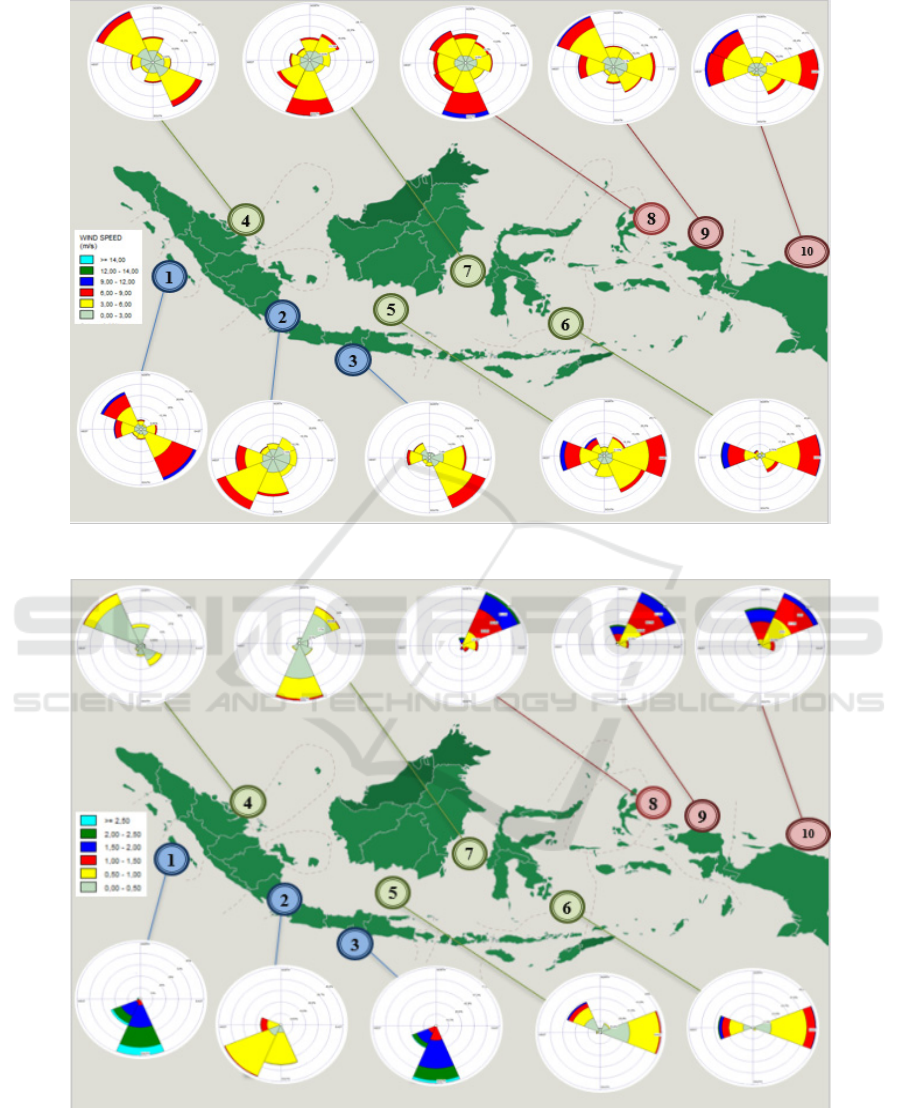
Figure 3: Wind rose at 10 reviewed location points during 2008-2018.
Figure 4: Wave rose at 10 reviewed location points during 2008-2018.
Monthly maximum significant wave height in
Southern Java has a significant increasing trend of
0.05 m/year in May, 0.05 m/year in August, and 0.068
m/year in December.
Furthermore, the monthly mean significant wave
height in Southern Java has a significant increasing
trend in July of 0.024 m/year and December of 0.016
m/year. In February, there was a significant
ISOCEEN 2019 - The 7th International Seminar on Ocean and Coastal Engineering, Environmental and Natural Disaster Management
176
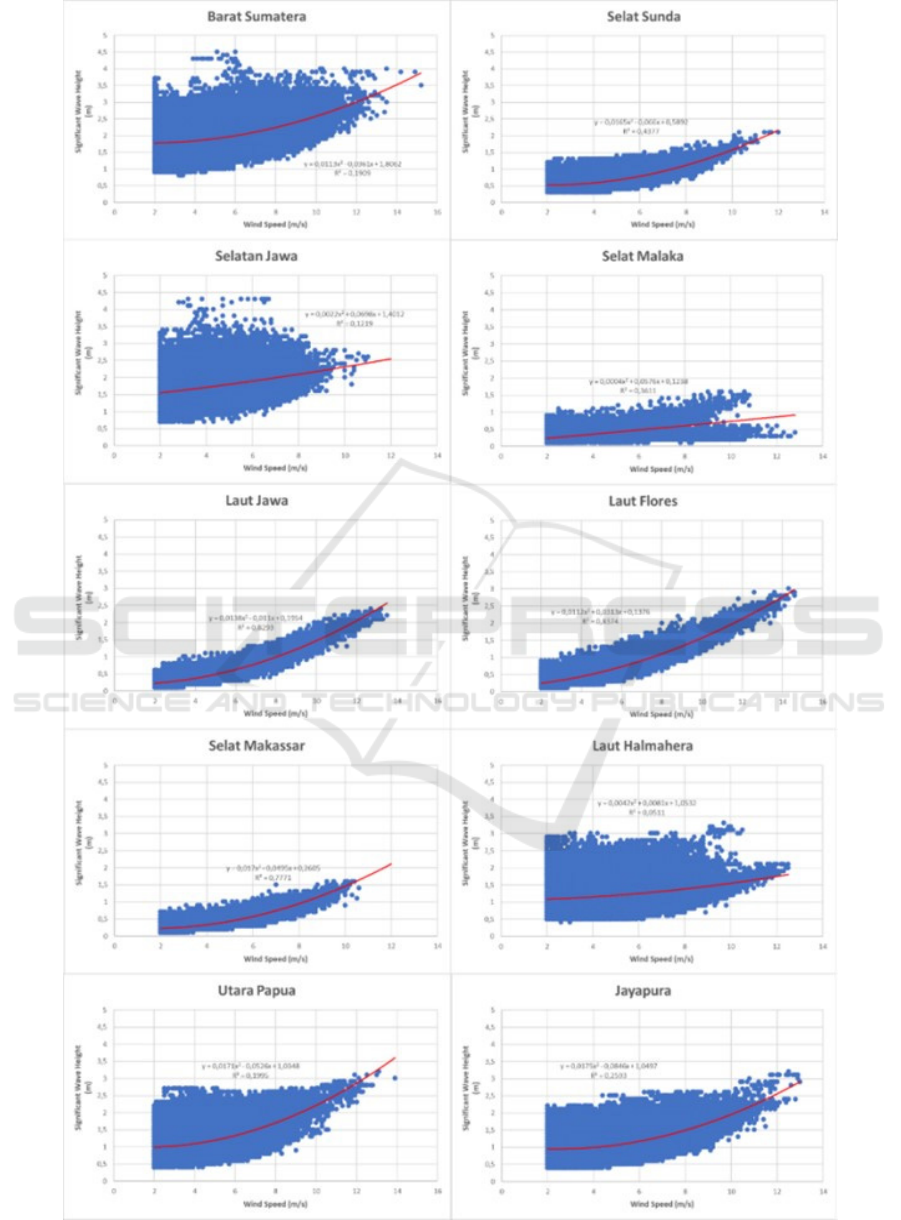
Figure 5: Regression graph of wind speed and significant wave height at Indonesian Seas.
Wind and Significant Wave Height at Indonesian Seas based on ERA5 Reanalysis Data from 2008 to 2018
177
increasing trend in Malaka Strait both at monthly
maximum and mean significant wave height. For the
significant monthly mean wave height, the significant
trend is calculated by 0.007 m/year, while the
maximum monthly mean wave height has a significant
trend of 0.025 m/year. The calculation the monthly
maximum significant wave height trend in Java Sea
shows that there is no significant trend every month
throughout the years 2008-2018. The trend value of
monthly mean significant wave height in Java Sea has
a significant increasing trend of 0.012 m/year in May.
Monthly maximum significant wave height in
Makassar Strait has a significant increasing trend of
0.028 m/year in August. Monthly mean significant
wave height in Makassar Strait has a significant
increasing trend by 0.008 m/year in December. The
calculation of the monthly significant wave height
trend in Northern Papua shows that there is no
significant trend that occurs every month throughout
2008-2018. The trend of the maximum monthly
significant wave height in Northern Papua in
December has a significant decreasing trend of -0.055
m/year. There is no significant trend of monthly
significant wave height in Jayapura during 2008-2018.
Monthly maximum significant wave height in
Jayapura has a significant decreasing trend in June and
August, each at -0.054 m/year and at -0.03 m/year. The
calculation of the monthly maximum and the monthly
mean significant wave height trend in Flores Sea and
Halmahera Sea shows that the trend that exists every
month throughout the years 2008-2018 is not
statistically significant. The calculation of monthly
mean significant wave height trend in 11 years can be
seen in Table 2. Wave rose from 10 reviewed location
points during 2008-2018 can be seen in Figure 4.
3.3 Relationship of Wind Speed and
Wave Height
The relationship of wind speed and significant wave
height in Indonesia during 2008-2018 at each
reviewed location point has a positive correlation. It
can be seen from Table 3 that the sheltered water of
Indonesian archipelago, namely Malaka Strait, Java
Sea, Flores Sea, and Makassar Strait, have a
determination coefficient above 0.3. Even more, Java
Sea and Flores Sea each has a determination
coefficient 0.75. On the other hand, in waters facing
the ocean, Western Sumatera, Southern Java,
Halmahera Sea, Northern Papua, and Jayapura, the
determination coefficient is below 0.3. This means
that the relationship of significant wave height and
wind speed in those waters is not as high as the
relationship in the sheltered waters. Sunda Strait
which is categorized as an open water in this paper
turns out to have characteristics that tend to follow the
characteristics of sheltered waters which have a quite
high correlation between wind speed and significant
wave height with determination coefficient of 0.438.
Regression chart of the correlation between wind
speed and significant wave height in all reviewed
location points can be seen in Figure 5. The
regression method used is quadratic regression or
polynomial order 2.
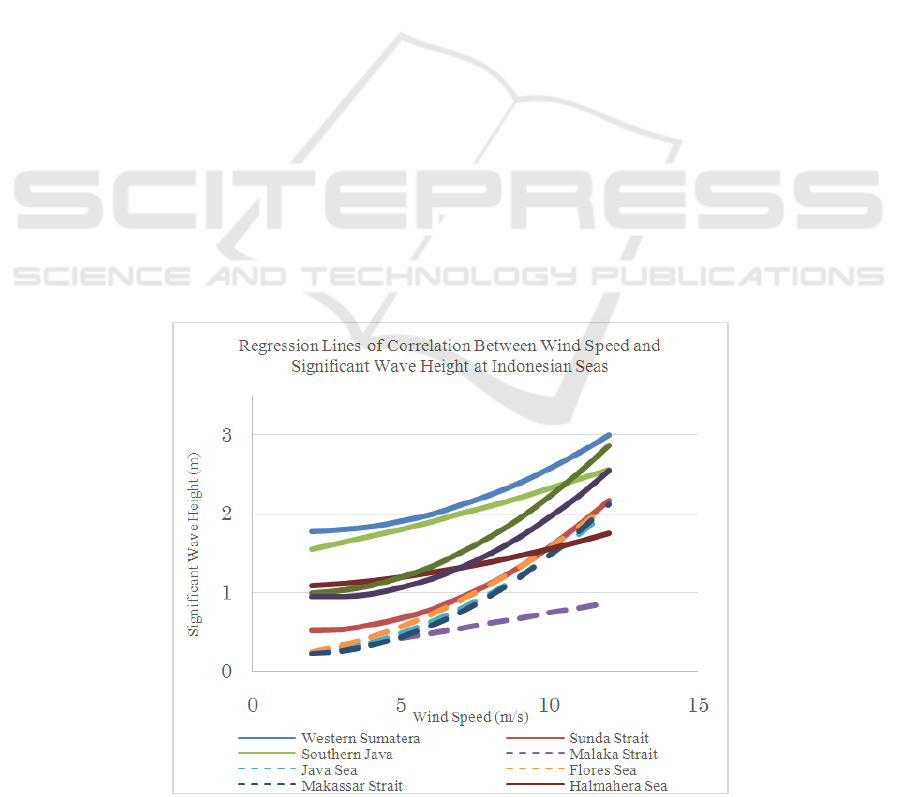
Figure 6: Regression line of wind speed and significant wave height correlation at 10 reviewed location points in 11 years.
ISOCEEN 2019 - The 7th International Seminar on Ocean and Coastal Engineering, Environmental and Natural Disaster Management
178
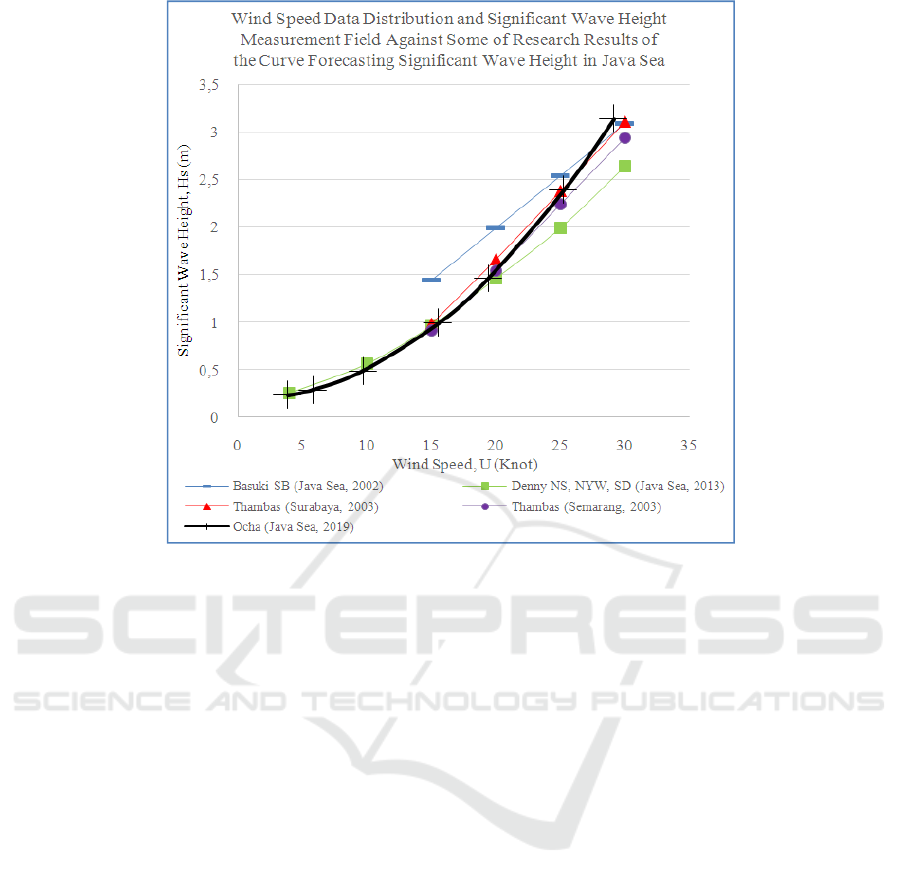
Figure 7: Wind speed data distribution and significant wave height of ERA5 data compared to some studies regarding wave
forecasting in Java Sea.
It can be seen in Figure 6 that the regression lines
of sheltered waters (Malaka Strait, Java Sea, Flores
Sea, and Makassar Strait) are below the open water
regression line, which means that the significant wave
height in sheltered waters is lower than in open
waters. The regression lines of sheltered waters are
also more curved than open waters regression lines. It
means that the correlation between wind speed and
significant wave height in sheltered waters is higher
than the correlation of wind speed and significant
wave height in open waters. The graph only compares
the wind speed and significant wave height without
taking into account of the direction of the wind and
wave itself. Therefore, the graph cannot be used as a
reference in determining the significant wave height
based on wind speed or vice versa.
Figure 7 shows the distribution data of wind speed
and significant wave height from ERA5 compared to
direct measurement field data on some studies of
wave height forecasting in the Java Sea from
Thambas and Yuwono (2003), Denny et al (2017),
Basuki (2000). As seen in Figure 7, the wind speed
data range is limited between 5 knots to 30 knots.
Figure 7 indicated that ERA5 data has similar trend
as other studies in the Java Sea.
4 CONCLUSIONS
Conclusions that can be obtained in this paper
include:
1. Monthly mean wind speed at Indonesian Seas is
about 2 m/s to 9 m/s. Monthly maximum and
monthly mean wind speed at each reviewed
location points have statistically significant
trend, except at Flores Sea.
2. Monthly mean significant wave height at
Indonesian Seas is about 0,2 m to 2,8 m.
Monthly maximum and monthly mean
significant wave height at each reviewed
location points have statistically significant
trend, except at Flores Sea and Halmahera Sea.
REFERENCES
Basuki S. B., 2000. Model Distribusi Kecepatan Angin dan
Pemanfaatannya dalam Peramalan gelombang di
Wilayah Tengah Indonesia, Thesis, Gadjah Mada
University.
Dehghani, S. R., Y. S. Muzychka, G. F. Naterer. 2017.
Water Breakup Phenomena in Wave-impact Sea Spray
on Vessel. Journal of Ocean Engineering.134:50-61
Wind and Significant Wave Height at Indonesian Seas based on ERA5 Reanalysis Data from 2008 to 2018
179

Denny Nugroho Sugianto, Muhammad Zainuri, Alfin
Darari, Suripin, Suseno Darsono and Nur Yuwono.
2017. Wave Height Forecasting Using Measurement
Wind Speed Distribution Equation in Java Sea,
Indonesia. International Journal of Civil Engineering
and Technology, 8 (5): 604-619.
Hwang, S.-O., J. Park, H. M. Kim. 2019. Effect of
Hydrometer Species On Very-Short-Range Simulations
of Precipitation Using ERA5. Journal of Atmospheric
Research. 218: 245-256.
Hersbach, H., D. Dee. 2016. ERA5 Reanalysis Is in
Production. ECMWF Newsletter. 147:7
Khoiri, P. A. 2015. Analisis Kecepatan Angin dan Tinggi
Gelombang Signifikan di Perairan Indonesia
Berdasarkan Data ERA-Interim Periode 1980-2014.
Tugas Akhir. Jurusan Teknik Kelautan. Institut
Teknologi Sepuluh Nopember Surabaya.
Lutfiana, R., M. Tirono. 2013. Pengenalan Pola Cuaca
(Curah Hujan, Tinggi Gelombang, dan KecepatanArus)
Dengan Metode Adaptive Neuro Fuzzy Inference
System (ANFIS) Pada Jalur Pelayaran Surabaya-
Makassar. Jurnal Neutrino. 6: 1.
Olauson, J. 2018. ERA5: The New Champion of Wind
Power Modelling? Renewable Energy.
Serafim, M. B., Eduardo Siegle, A. C. Corsi, Jarbas Bonetti.
2019.Coastal Vulnerability to Wave Impacts Using a
Multi-Criteria Index: Santa Catarina (Brazil). Journal
of Environmental Management. 230:30-32.
Torum, A., M. N. Moghim, K. Westeng, N. Hidayati, O.
Arntsen. 2012. On Berm Breakwater: Recession Crown
Wall Wave Forces, Reliability. Journal of Coastal
Engineering. 60: 299-318.
Thambas, A. H., & Yuwono, I. H. N., 2003. Model
distribusi kecepatan angin dan pemanfaatannya dalam
peramalan gelombang di wilayah tengah Indonesia,
Pulau Java, Sulawesi dan Kalimantan, Doctoral
dissertation, Yogyakarta, Universitas Gadjah Mada.
Van Rijn, Leo C. 2014. A Simple General Expression for
Longshore Transport of Sand, Gravel and Shingle.
Journal of Coastal Engineering. 90: 25-29.
Yulius, A. Heriati, E. Mustikasari, dan R. I. Zahara. 2017.
Karakteristik Pasang Surut dan Gelombang Perairan
Teluk Saleh, Nusa Tenggara Barat. Jurnal Segara. 13:
65-73.
Zikra, M. Hashimoto, N. Mitsuyasu, K. and Sambodho,
2015, Monthly Variations of Global Wave Climate due
to Global Warming, Jurnal Teknologi, Vol.74, No. 5,
27-31.
ISOCEEN 2019 - The 7th International Seminar on Ocean and Coastal Engineering, Environmental and Natural Disaster Management
180
