
Spatial Distribution of Pollutant Distribution in Jakarta Bay from
Hydrodynamic-2D Transport Coupled Model
Corry Corvianawatie, Ahmad Bayhaqi, Dewi Surinati, Mochamad Furqon Ismail, Lestari, Khozanah
and Deny Yogaswara
Research Center for Oceanography, Indonesian Institute of Sciences (LIPI), Jakarta, Indonesia
Keywords: Pollutant, Jakarta Bay, Hydrodynamic, 2D Transport Coupled Model.
Abstract: Being a center of marine activities such as shipping and fishing which are accompanied by massive
development and industrial, Jakarta Bay is susceptible to the environmental degradation from the pollutants.
Observation was conducted in Jakarta Bay during the southeast monsoon (Juli-Agustus) 2015 to collect
physical properties data such as sea surface temperature and heavy metal component. Pollutants distribution
such as Pb, Ni, Zn, Polychlorinated biphenyl (PCB), Polycyclic aromatic hydrocarbons (PAH) and Dichloro-
diphenyl- trocholoroethane (DDT) are simulated using Horizontal 2D hydrodynamic model from Princeton
Ocean Model (POM) with the Arakawa-C grid system. The model domain consists of 400 x 260 grid and
110x110m grid resolution. With the high accuracy rate (92%) for the tidal validation and mean sea level
residual 0.074 m, the simulation shows that pollutant distribution is mainly influenced by ocean current
condition. Observed eddies in the simulation, which are triggered by significant difference of bathymetry and
shear current velocity, indicate that the pollutants from Jakarta Bay are not easily transported by tidal current
into the Java Sea.
1 INTRODUCTION
Jakarta Bay is one of the most heavily used semi-
enclosed coastal waters in the world. Along with the
massive development and industrial activities on the
coast, water pollution caused by the dumping of
industrial and domestic wastewater had been a serious
ecological problem for coral reef (Kunzmann et al.,
2018) as well as fisheries (Irianto et al., 2017).
Research of metal concentration in Sediments in
Jakarta Bay by Arifin (2008) revealed that its
concentration experiences a rapid increased in the last
20 year.
Water quality monitoring by BPLHD-DKI in
2013 found that heavy metals concentration in Jakarta
Bay such as Pb, Ni and Zn has exceeded the specified
quality standard threshold by MenLH. Furthermore,
Susanna and Yanagi (2002) argued that the sources of
pollutants are coming from major river that flows into
the Jakarta Bay.. As consequence, the study to get
information of pollutant distribution are very
essential to obtain the better understanding about
water quality in the Jakarta Bay.
Several studies have been done to assess the
pollution in Jakarta Bay including methods that
involving biota (Soemodihardjo and Kastoro, 1977;
Rees et al., 1999), sediment geochemistry (Sindern et
al., 2016) as well as using a numerical ocean model
simulation (Koropitan et al., 2009; van der Wulp et
al., 2016).
The lack of pollutant dynamics study in the
Jakarta Bay motivated the investigation that is
presented in this paper. This paper aims to simulate
the spatial pattern of pollutant distribution using
hydrodynamic and Horizontal 2D transport coupled
model. This study could give the useful information
about heavy metal concentration in all regions of
Jakarta Bay.
2 METHODS
2.1 Model Design
The coupled Hydrodynamic-Horizontal 2D transport
model are simulated in forty-five (45) days from 1
July until 15 August 2015 with the time step of 2
150
Corvianawatie, C., Bayhaqi, A., Surinati, D., Ismail, M., Lestari, ., Khozanah, . and Yogaswara, D.
Spatial Distribution of Pollutant Distribution in Jakarta Bay from Hydrodynamic-2D Transport Coupled Model.
DOI: 10.5220/0010059501500160
In Proceedings of the 7th International Seminar on Ocean and Coastal Engineering, Environmental and Natural Disaster Management (ISOCEEN 2019), pages 150-160
ISBN: 978-989-758-516-6
Copyright
c
2021 by SCITEPRESS – Science and Technology Publications, Lda. All rights reserved
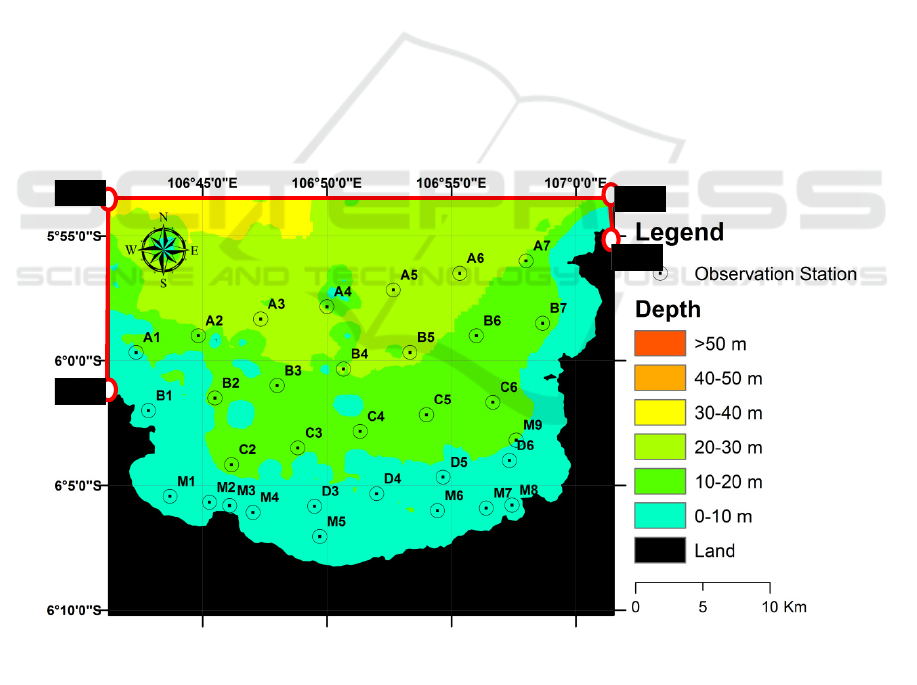
second. The domain of this study lies on 106.633⁰E –
107.033⁰E and 5.868⁰S – 6.118⁰S (see Figure 1).
To simulate the pollutant distribution, horizontal
2D hydrodynamic model from Princeton Ocean
Model (POM) is employed with the additional
numerical solution from 2D transport equation. The
model is built by Arakawa-C grid system, consisting
of 400x260 grid with the resolution 110x110m.
The type of pollutant in this research are Pb, Ni,
Zn, Polychlorinated biphenyl (PCB), polycyclic
aromatic hydrocarbons (PAH) and Dichloro-
diphenyl-trocholoroethane (DDT) with the
consideration of advection and diffusion of these
pollutants.
2.2 Model Input
The several primary
data
such as bathymetry,
coastline,
tide, sea temperature, salinity, river debit
rate are used as model input. While the temperature
and salinity are measured from observation with
thirty two (32) measurement station (see figure 1), the
bathymetry is obtained from Indonesian Navy
(DISHIDROS TNI AL). It is interpolated spatially
into the specified grid size of this study (see figure 1).
Then, the temperature and salinity data are employed
to gain the density reference value in the Bay. The
tidal data for the main force in west, north and east
part of domain come from Tide Model Driver (TMD)
(see figure 1). Besides, the debit rate from five major
rivers and wind velocity are also used as the main
force. Referring the Courant-Friedrichs-Lewy (CFL),
the main forcing data are interpolated into 2 second
.
For the initial value of the model (see figure
2),
this study assumes that the sea is calm (u = 0, v
= 0,
and
η
= 0) and the initial value for pollutant
concentration in the domain model is spatial
interpolation with the Kriging method from field
measurement, conducted by Research Center for
Oceanography, Indonesian Institute of Sciences
(LIPI) on July-August 2015.
The results of the distribution of pollutant
distribution in Jakarta Bay are verified using data
from field measurements including tidal elevation
and sea current velocity. The information regarding
the data for model validation is written in Table 1.
P2
P3
P4
P1
Figure 1: Bathymetry map with the thirty two (32) measurement stations with the open boundary of domain (red line) and
spot for tidal data (red circle – P1, P2, P3 and P4).
Spatial Distribution of Pollutant Distribution in Jakarta Bay from Hydrodynamic-2D Transport Coupled Model
151
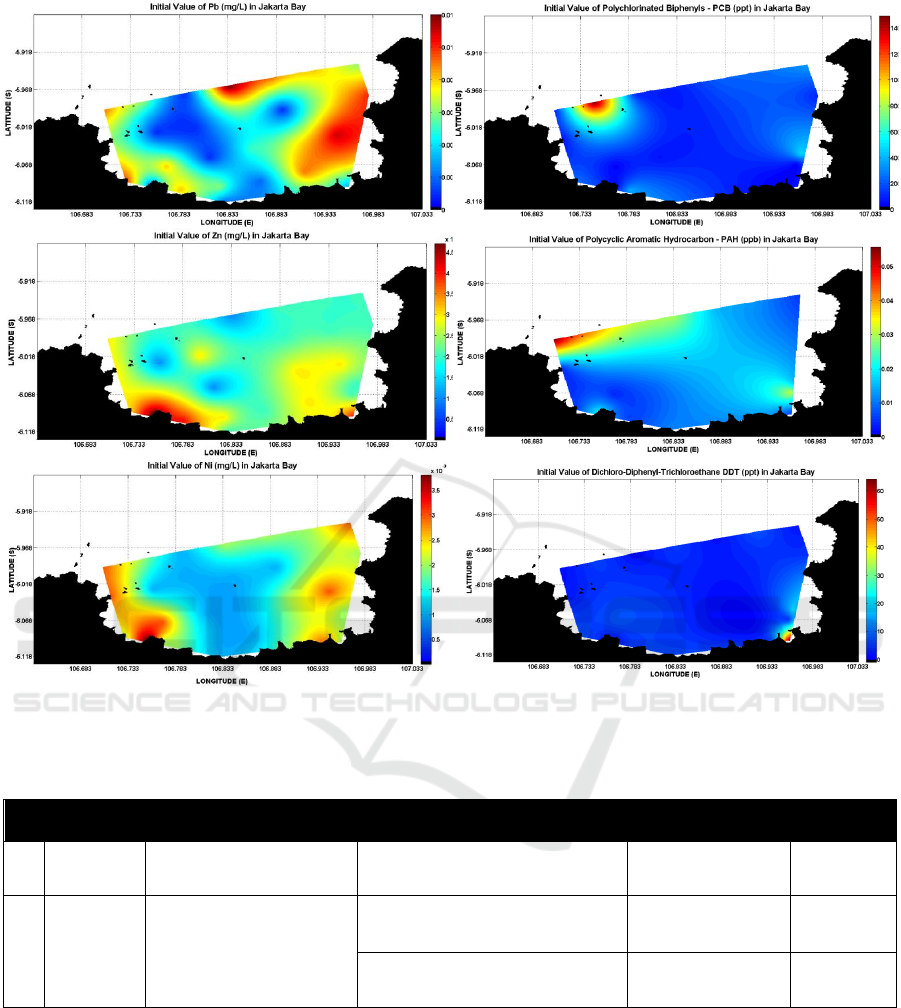
Figure 2: The initial value of heavy metal concentration; Pb (mg/L), Zn (mg/L0, Ni (mg/L) (left panel) and organic pollutant;
PCB (ppt), PAH (ppb), DDT (ppt) (left panel) based on the field measurement July-August 2015.
Table 1: Data for Model Validation.
No Data Source Location
Period
(dd/mm/yy)
Interval
1.
Tidal
Elevation
Agency of Geospatial
Information (BIG)
Kolinlamil statiun, Jakarta 01/07/15 – 31/08/15 5 minute
2.
Current
Velocity
Observation
a. St.B2 (-6.025
o
S and 106.758
o
E)
29/07/15 - 30/07/15 10 minute
b. St.B6 (-5.975
o
S and 106.978
o
E)
30/07/15 - 31/07/15 10 minute
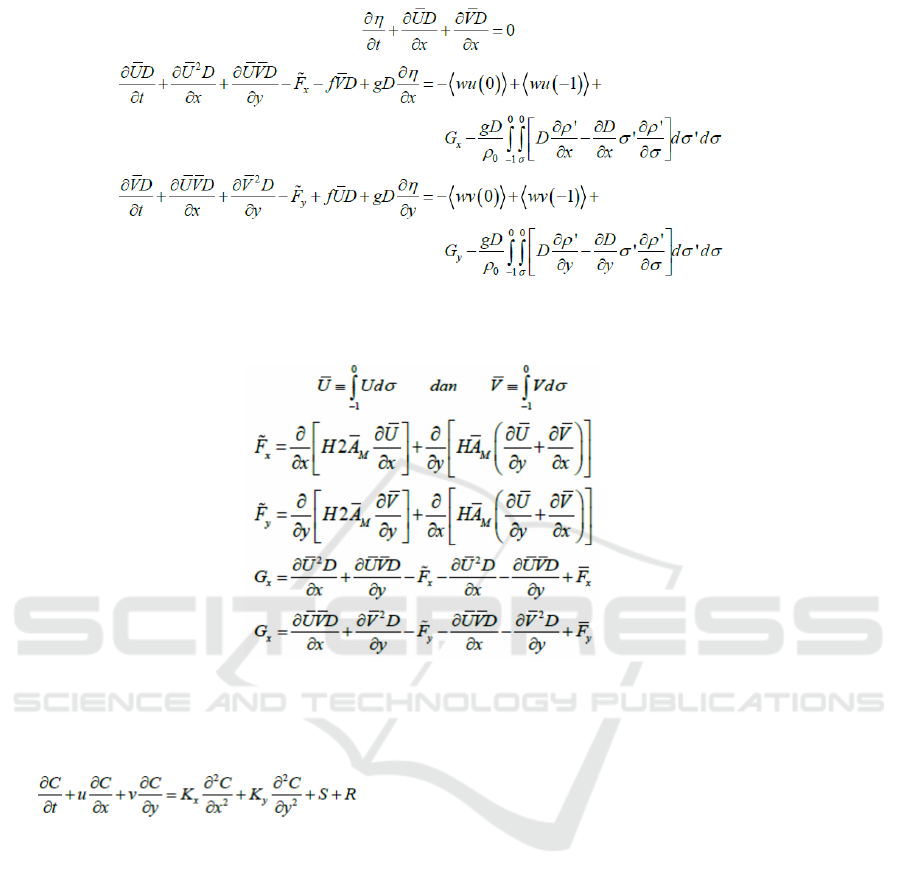
2.3 Model Equation
The governing equation for hydrodynamic and
transport coupled model consists of continuity
equation (1.1), momentum equation in x-y axis (1.2a
and 1.2b) (Mellor, 2004) and transport equation in x-
y axis (1.6a and 1.6b) (Putri and Mihardja, 1999). On
this equation, there is assumption and simplification
which are only consider to advection and diffusion,
the source and sink of heavy metals from chemical
reaction and other factors are not taken into account.
The transport simulation on this study is conducted
only based on the initial value from observation. In
the absence of other supporting data, the input
pollutants during the simulation period are not
reviewed.
Then, this research produces a distribution pattern
and pollutant flushing processes in the Jakarta Bay.
ISOCEEN 2019 - The 7th International Seminar on Ocean and Coastal Engineering, Environmental and Natural Disaster Management
152
(1)
(2a)
(2b)
where,
(3)
(4a)
(4b)
(5a)
(5b)
Generally, 2D transport equation can be written as
(Putri dan Mihardja, 1999):
(6)
where C is , S and R are for source and reaction
respectively. On this study, we ignore the S and R due
to the absence of supporting data. Then, Kx and Ky
are the horizontal diffusion coefficient in x-y which
is different for each parameter. We use 9.45 x 10
-6
cm
2
/s [Pb
2+
], 6.79 x 10
-6
cm
2
/s [Ni
2+
], 7.15 x x 10
-6
cm
2
/s [Zn
2+
] (Li and Gregory, 1974), 3.16 x 10
-11
m
2
/s
[PCB], 2.51 x 10
-11
m
2
/s [PAH] (Rusina et al., 2010)
and 6.86 x 10
-12
m
2
/s [DDT] (Dueri et al., 2005).
3 RESULTS AND DISCUSSION
3.1 Model Validation
The model results are validated using two main
parameters; sea level elevation and ocean current.
The sea level elevation is verified by observation
data, which are obtained from the Agency of
Geospatial Information (BIG) located at Kolinlamil
station, Jakarta. The validation is carried out for 15
days on 10 July 2015 – 25 July 2015 (see Figure 3)
showing the high accuracy of 92% with an average
residual sea level elevation of 0.074 m.
The observational ocean current data from 24
hours measurement at B2 and B6 stations are also
utilized to verify the model result. The measurement
was conducted at 5 m depth in 28-29 July [station B2]
and 29-30 July [station B6] with the interval of 10
minute. The results in station B2 showed that the
accuracy of the zonal and meridional current are 54%
and 55%, respectively. Station B6 has the accuracy
rate of 50% and 73% easting and northing current
correspondingly. Some components show an
accuracy value which is not accordance with the field
data. That conditions are potentially due to the lack of
matching drag coefficient values for surface wind
speed. Based on the wind speed during the simulation
period, the wind is large enough to generate ocean
currents. Therefore, the model results are
underestimated during that condition.
Spatial Distribution of Pollutant Distribution in Jakarta Bay from Hydrodynamic-2D Transport Coupled Model
153
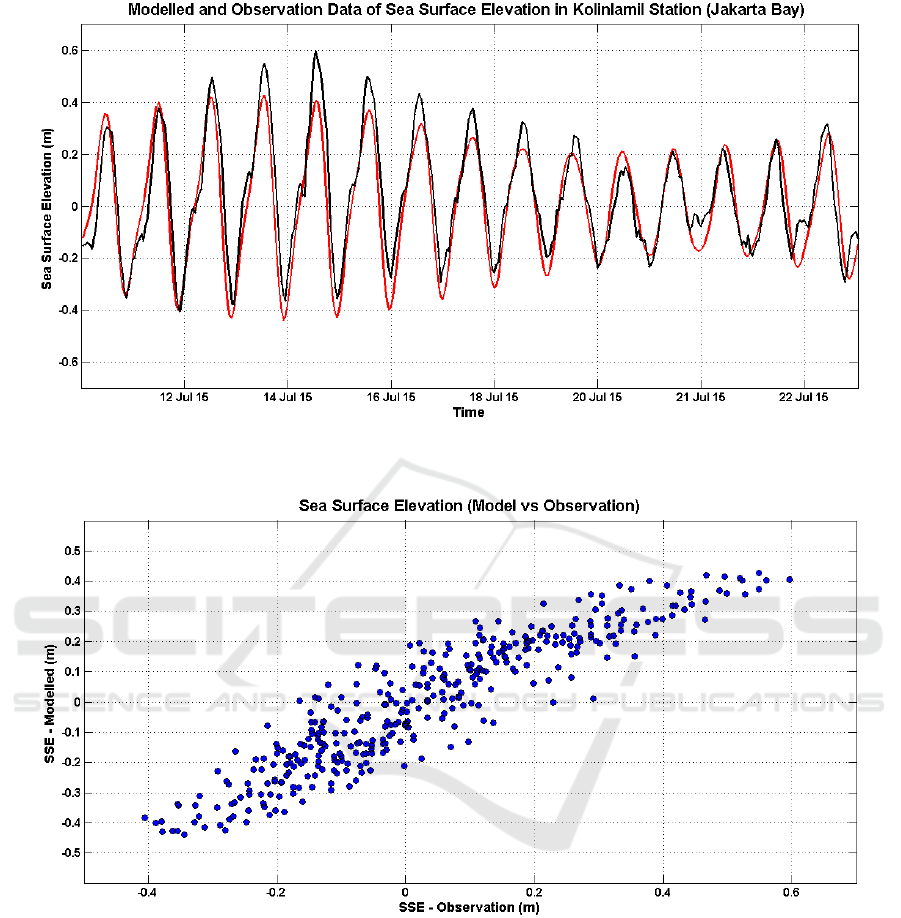
Figure 3: Model Validation between model result (red line) and observation (black line) on 10 – 25 July 2015, located on
Kolinlamil Station, Jakarta.
Figure 4: Model Validation between model result (red line) and observation (black line) on 10 – 25 July 2015, located on
Kolinlamil Station, Jakarta.
3.2 Jakarta Bay Dynamics
Generally, the type of tide in the Jakarta Bay is mix
tide with the flood and ebb tide occur just once in a
day. Furthermore, ocean current patterns in the
Jakarta Bay vary, depending on tides and monsoons.
In some cases, where the wind blows so strong in the
southeast monsoon, the ocean currents move north-
eastward. During the ebb tide phase, the current flows
into the open sea while there are southward currents
in the eastern part of the Bay (Fig 5; upper panel),
while the ocean current dominantly moves into the
mainland when the flood tide (Fig 5; lower panel).
These results are consistent with Putri and Mihardja
(1999) and Sanusi et al (2005). The magnitude of
ocean current varies from 0 until 0.20 m/s. These
conditions also indicate that the pollutant distribution
is more influenced by ocean current than the diffusion
rate
of each pollutant
.
ISOCEEN 2019 - The 7th International Seminar on Ocean and Coastal Engineering, Environmental and Natural Disaster Management
154
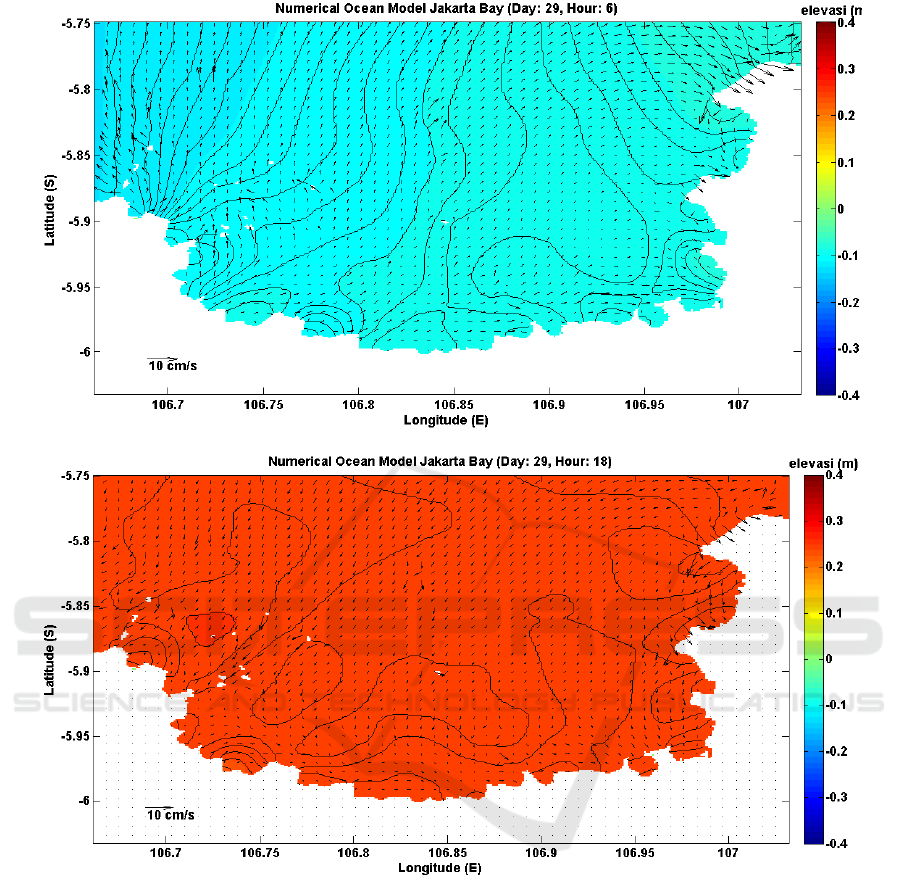
Figure 5: Model Validation between model result (red line) and observation (black line) on 10 – 25 July 2015, located on
Kolinlamil Station, Jakarta.
3.3 Pollutant Distribution
Overall, the model results show the distribution of
pollutant which is mainly influenced by the ocean
current pattern (Figure 6 – 11). The variation of
bathymetry and the shape of the coastline in Jakarta
Bay contributed to eddies current in the several places
along the Jakarta Bay. For the example, the observed
eddy current in the eastern part of Bay is triggered by
shear current velocity. In some areas, the eddy current
are also found due to the significant difference of
bathymetry. The formation of eddies causes the
particle movement that rotate around the centre of
eddies. As a result, the pollutants from Jakarta Bay
are not easily transported by tidal current into the Java
Sea. In addition, the monsoonal cycle also has an
important role to transport the pollutant by moving
the ocean current. It can be indicated from the
simulation result. The pollutant distribution has the
dominant direction into the west while the southeast
monsoon triggers the ocean current to move
southwestward.
Spatial Distribution of Pollutant Distribution in Jakarta Bay from Hydrodynamic-2D Transport Coupled Model
155
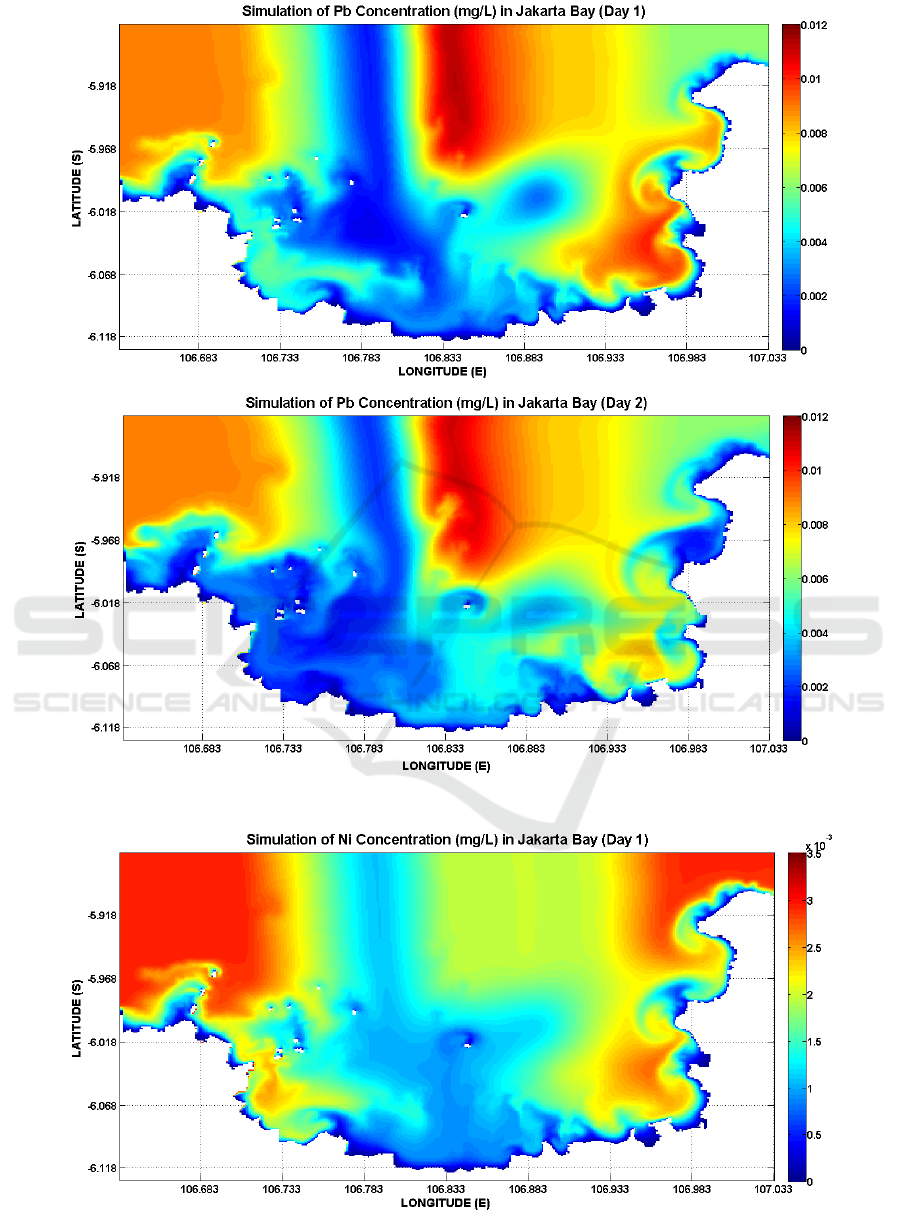
Figure 6: Simulation result of Pb concentration in Jakarta Bay.
Figure 7: Simulation result of Ni concentration in Jakarta Bay.
ISOCEEN 2019 - The 7th International Seminar on Ocean and Coastal Engineering, Environmental and Natural Disaster Management
156
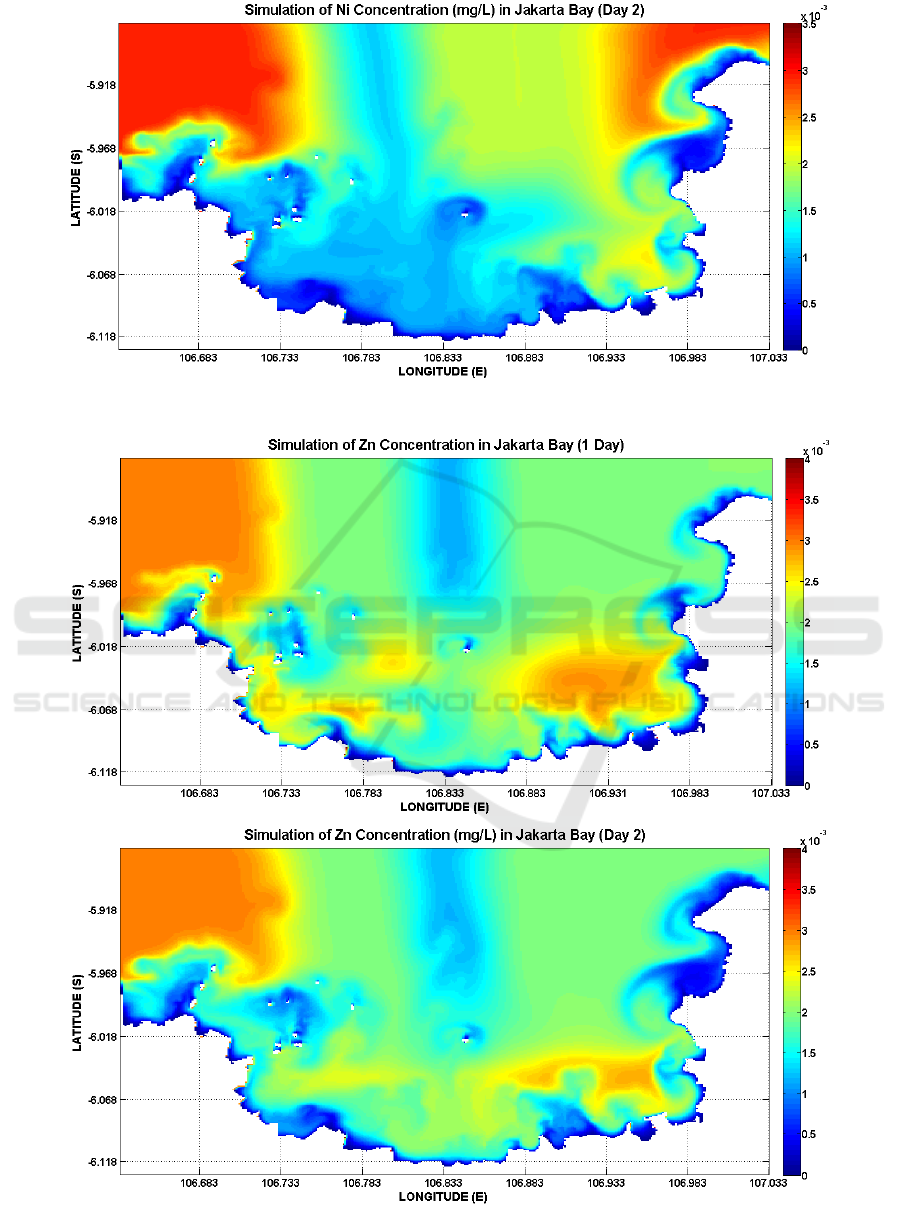
Figure 7: Simulation result of Ni concentration in Jakarta Bay (cont.).
Figure 8: Simulation result of Zn concentration in Jakarta Bay.
Spatial Distribution of Pollutant Distribution in Jakarta Bay from Hydrodynamic-2D Transport Coupled Model
157
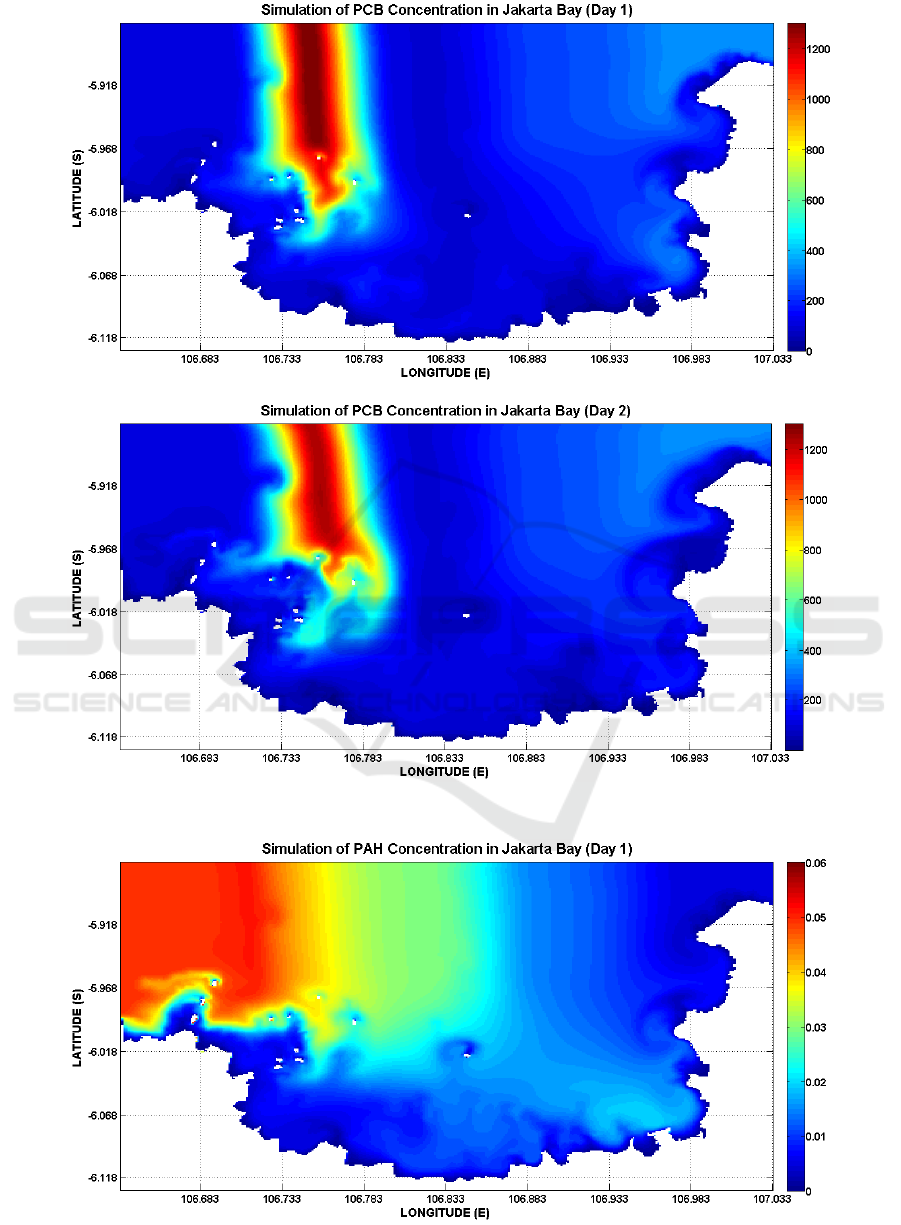
Figure 9: Simulation result of PCB concentration in Jakarta Bay.
Figure 10: Simulation result of PAH concentration in Jakarta Bay.
ISOCEEN 2019 - The 7th International Seminar on Ocean and Coastal Engineering, Environmental and Natural Disaster Management
158
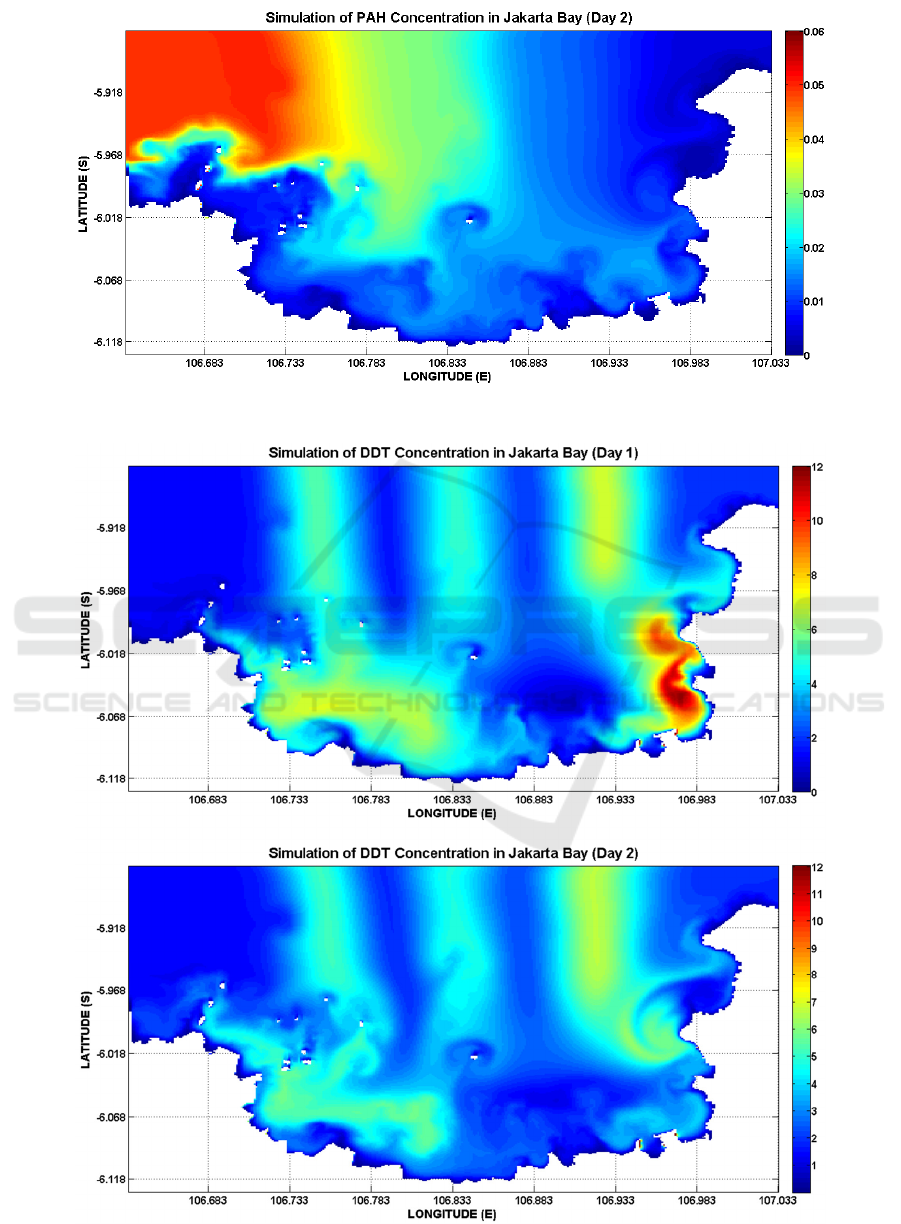
Figure 10: Simulation result of PAH concentration in Jakarta Bay (cont.).
Figure 11: Simulation result of DDTconcentration in Jakarta Bay.
Spatial Distribution of Pollutant Distribution in Jakarta Bay from Hydrodynamic-2D Transport Coupled Model
159

4 CONCLUSION
From the simulation of pollutants distribution using
coupled hydrodynamics-2D transport model, we
conclude that the water movement in Jakarta mainly
driven by tidal condition, debit of river and wind
velocity.
Those ocean-atmospheric factors contributed to
the spatial variation of the pollutant in the Jakarta
Bay. The pollutants from Jakarta Bay are not easily
transported by tidal current into the Java Sea due the
formation of eddy currents.
REFERENCES
Arifin, Z., Trend of metal contaminants in the Jakarta Bay
in Ruyitno et al (eds.) p: 211-228 (2008).
Dueri, S., Zaldivar, J.M., & Olivella, A., Dynamic
Modelling of the fate of DDT in Lake Maggiore:
Preliminary results, European Comission Directorate
General Joint Research Centre, (2005).
Irianto H.E., Hartati S.T., & Sadiyah L. Fisheries and
Environmental Impacts in the Great Jakarta Bay
Ecosystem, Indonesian Fisheries Research Journal, 23
(2): 69078, (2017).
Koropitan A.F., Ikeda M., Damar A, & Yamanaka Y.
Influences of Physical Processes on the ecosystem of
Jakarta Bay: A coupled physical-ecosystem model
experiment, ICES Journal of Marine Science, 66
(2):336-348, (2009).
Kunzmann A., Arifin Z & Baum G. Pollution of Coastal
Areas of Jakarta Bay: Water Quality and Biological
Responses, Mar.Res.Indonesia, 43 (1): 37-51, (2018).
Li, Y-H. & Gregory, S., Diffusion of ions in sea water and
in deep-sea sediments, Geochimica et Cosmochimica
Acta, 88: 708-714, (1974).
Mellor, G.L., 2004, User Guide for a Three-Dimensional:
primitive equation, numerical ocean model, Princeton
University.
Putri, M.R. & Mihardja, D.K., Pemodelan Sirkulasi Air
Laut dan Penyebaran Logam Berat Cadmium (Cd) di
Kolam Pelabuhan Tanjung Priok, Journal of
Mathematical Sciences (JMS), 4(1): 32-50, (1999).
Rees, J.G., Setiapermana D., Sharp V.A., Weeks J.M., &
Williams T.M. Evaluation of the impacts of land-based
contaminants on the benthic faunas of Jakarta Bay,
Indonesia, Oceanologica Acta, 22 (6): 627-640, (1999).
Rusina, T.P., Smedes, F., & Klanova, J., Diffusion
Coefficients of Polychlorinated Byphenils and
Polycyclic Aromatic Hydrocarbons in
Polydimethylsiloxane and Low-Density Polyethylene
Polymers, Journal of Applied Polymer Science,
116:1803-1810, (2010).
Sanusi, H.S., Koropitan, A.F., Haeruddin, & Nugraha,
A.K., Pemodelan Pola Arus dan Sebaran Konsentrasi
Tembaga (Cu) Terlarut di Teluk Jakarta, Ilmu kelautan,
10(3): 165-168, (2005).
Sindern S., Tremohlen M., Dsikowitzky L., Gronen L.,
Schawarzbauer., Siregar T.H., Ariyani F., Irianto H.E.
Heavy Metals in river and coast sediments of the
Jakarta Bay region (Indonesia) – Geogenic versus
anthropogenic sources, Marine Pollution Bulletin, 110
(2): 624-633, (2016).
Susanna Y & Yanagi T. Lower Trophic Level Ecosystem
in Jakarta Bay, Indonesia, La Mer, 40: 161-170, (2002).
Soemodihardjo S & Kastoro W. Notes on the Terebralia
Palustris (Gastropoda) from the coral islands in the
Jakarta Bay Area, Mar.Res.Indonesia, 18: 131-148,
(1977).
Van der Wulp S.A., Damar A., Ladwig N., & Hesse K-J.
Numerical simulation of river discharges, nutrient flux
and nutrient dispersal in Jakarta Bay, Indonesia, Marine
Pollution Bulletin, 110 (2): 675-685, (2016).
ISOCEEN 2019 - The 7th International Seminar on Ocean and Coastal Engineering, Environmental and Natural Disaster Management
160
