
Project Planning of Offshore Pipelines Replacement: Study Case at
Offshore North West Java
Jordy Revanda W. Apcar
1
, Silvianita
1
, Daniel M. Rosyid
1
, Mohd. Faris Khamidi
2
and
Januar Adi Murdan
3
1
Department of Ocean Engineering, Institut Teknologi Sepuluh Nopember, Surabaya, Indonesia
2
College of Engineering, Qatar University, Qatar
3
PT Pertamina Hulu Energi Offshore North West Java, Indonesia
Keywords: Six Sigma Analysis, Critical Path, Fault Tree Analysis, Event Tree Analysis, Top Event, Project Delay,
Offshore Pipelines Installation.
Abstract: There are many factors that lead to project delay, for example hurricane, one of weather factors that make it
impossible to do work or factors like lack of utilities and construction equipment, delays in purchasing
material orders, lack of experienced and skilled human resources in the field, delay costs down to purchase
activities on the project. In addition, there are delays in critical activities because they have a large impact on
the duration of the project. Therefore, it is necessary to do an analysis by looking for activities that are critical
to the project and factors that can cause delays in the new pipeline project because it can endanger the owners
and contractors. This study will discuss three factors, i.e. (1) the determination of the critical path, (2) the
determination of the root causes that can cause delays, and (3) the risk of over time, of new pipelines
replacement project in North West Java, Indonesia. There are 4 indications of delay in this project, which are
delay that occurred in June 2018, September 2018, and October 2018. The biggest deviation between the
targeted value and the actual value occurred in October 2018, which was 5,05%. This study uses six sigma
methods, critical path, fault tree analysis and event tree analysis. The results of fault tree analysis will get the
probability value for the top event of the project delay. The results of the event tree analysis will get the risk
level of each factor that causes delays. Six sigma results will get to the root of the problem, the value of sigma,
and what corrective action is taken.
1 INTRODUCTION
Project implementation must be supported by good
project management. The absence of project
management will bring about change, unclear goals,
non-challenging planning, high risk, poor project
quality, more expensive project costs, and delays in
improving the project. Project management can be
subdivided such as project time management, project
human resource management, and project risk
management (PMBOK, 2008). The company plans to
carry out the offshore pipeline repair and replacement
project. This project covers the aspects of
engineering, procurement, construction, and
installation, called the EPCI project. Pipeline is
located 80 - 200 km northeast of Jakarta. The core of
this project is to replace pipes that are no longer
suitable for use by installing new pipes for pipes that
are already damaged. There are three pipelines
planned to be replaced, namely:
(i) Pipe A with 12"OD and 1 km length
(ii) Pipe B with10" OD and 7.2 km length
(iii) Pipe C with 8" OD and 7.2 km length
The construction project sector has a high level of
responsibility and complexity. All construction
projects can be categorized as complex projects. This
is caused by a direct relationship between complexity
and involves various interredelayd parts that must be
managed with regard to conditions of differentiation
and interdependence, thus causing construction
projects to have high risks (Baccarini, 1996). Based
on the explanation in the paragraph above, this project
is a complex project because it has three projects with
different pipe sizes and lengths. Therefore, this paper
will discuss project risks in the form of overtime
(project delays) that can have an impact on project
cost overruns. Project risk in the form of overtime and
Apcar, J., Silvianita, ., Rosyid, D., Khamidi, M. and Murdan, J.
Project Planning of Offshore Pipelines Replacement: Study Case at Offshore North West Java.
DOI: 10.5220/0010057701130121
In Proceedings of the 7th International Seminar on Ocean and Coastal Engineering, Environmental and Natural Disaster Management (ISOCEEN 2019), pages 113-121
ISBN: 978-989-758-516-6
Copyright
c
2021 by SCITEPRESS – Science and Technology Publications, Lda. All r ights reser ved
113

excess costs must be avoided because it can endanger
all parties such as the owner and contractor, for
example from the owner will suffer losses because the
object of the project cannot operate, so it does not
generate profits. On the other hand, the contractor
must be responsible for delays and the contractor's
good name becomes bad.
Table 1: Indications of Delay in the Development of a New
Pipe Replacement Project on Deteriorated Pipelines.
June
2018
June
2018
Sept
2018
Oct
2018
Planned
Value
0,06% 6,35% 40,11% 53,20%
Earned
Value
0,00% 5,63% 39,71% 48,15%
Table 1 explains that there are indications of
delays in the construction of new replacement pipe
projects for damaged pipelines. Indications occurred
in June 2018, September 2018, and October 2018.
The largest deviation between the planned value and
the value obtained occurred in October 2018 at
5.05%. Many factors can make a project experienced
delay, for example weather factors that make it
impossible to do work or factors of lack of utilities
and construction equipment, delays in purchasing
material orders, lack of experienced and skilled
human resources in the field, delay costs down to
purchase activities on the project, in addition, there
are delays in critical activities because critical
activities have a large impact on the duration of the
project.
Therefore it is necessary to analyze the delay by
looking for any activities that are critical to the project
and factors that can cause overtime. To avoid
overtime in this new pipeline project because it could
endanger the owner and contractor as explained in the
previous paragraph. In this study, we will discuss
determining the critical trajectory, determining the
root cause or factors that can cause delays, a large risk
of delay, and what improvements can be made.
2 BASIC THEORY
2.1 Project Management
Project management is planning, organizing, leading,
and controlling company resources to achieve short-
term goals that have been determined. Project
management has a basic function consisting of
managing the scope of work, time, cost, and quality.
The key to successful implementation of a project if
you can manage these aspects correctly (Samad,
2019).
2.2 Risk
Risk is a combination of the probability of an event
and the impact of the event, the impact can be more
than one for one event. However, risks are generally
seen as negative things such as danger, loss, and other
impacts. These impacts and losses is actually a form
of uncertainty that should be understood and managed
effectively by the project implementer (Szymanski,
2017).
2.3 Critical Path
Critical path is a project management technique that
uses only one-time factor per activity. Critical path or
critical path is the fastest path in project work, every
project included in this path is not given a break /
break for the process. Critical path is a path that
consists of activities which if delay will result in delay
completion of the project Heizer, 2014).
2.4 Six Sigma Analysis
The statistical concept that measures a process that is
redelayd to the sigma number, where the closer to 6
the results will be as expected. Six Sigma is a
management philosophy that focuses on removing
defects by emphasizing understanding, measuring
and improving processes (Brue, 2002). Six Sigma has
5 stages, as follows (Larasatie, 2019):
(i) Define
Define aims to identify the process to be improved
and determine what resources are needed in project
implementation.
(ii) Measure
Measure is an advanced stage of define where at this
stage validation of a problem is done by calculating
and obtaining numbers that can provide clues about
the problem.
(iii) Analyze
At this stage, the cause of the deviation in a project
will be investigated with a hypothesis which will then
be tested.
(iv) Improve
At this stage, the main factors are ascertained and
give new influences so that they get the desired
results. The purpose of this stage is to implement a
new system so that the project can run more
optimally.
(v) Control
Maintain changes that have been made through
ISOCEEN 2019 - The 7th International Seminar on Ocean and Coastal Engineering, Environmental and Natural Disaster Management
114

certain measuring devices so that it can be assessed
whether the new system is optimally implemented in
the project.
2.5 Fault Tree Analysis
Fault tree analysis is a method to identify and analyze
all the factors that might cause a system failure and
provide a basis for calculating the probability of a
failure event. Unwanted events that are on top (top
event) for all root causes that might occur at the
bottom. The causative factors are deductively
identified, logically arranged and represented using
pictures in a tree diagram illustrating the causal
factors and their logical relationship to the peak event
(ISO, 2009).
2.6 Event Tree Analysis
Event tree analysis is a method used to evaluate
processes and events that lead to the possibility of
failure. This method is useful in analyzing the
consequences arising from failures or unwanted
events. The consequences of events are followed
through a series of possibilities. By analyzing all
possible outcomes, it is possible to determine the
percentage of results that lead to both desired and
undesirable results (Silvianita et al, 2017).
Event tree analysis is an analysis technique to
identify and evaluate the sequence of events in a
potential accident scenario after the initial event or
initiating event. Event tree analysis uses a visual logic
tree structure known as an event tree. The purpose of
the event tree analysis is to determine whether the
initiating event will develop into a serious accident or
whether the event is sufficiently controlled by the
safety system and procedures applied in the system
design. Event tree analysis can produce many
different results from one initial event, and this
provides the ability to obtain probabilities for each
outcome (Ericson, 2005). Project delay using ETA
and Bow Tie Analysis for mooring change
replacement can be seen in (Silvianita et al, 2018).
and project delay for HRSG has been discussed
(Silvianita et al, 2017b).
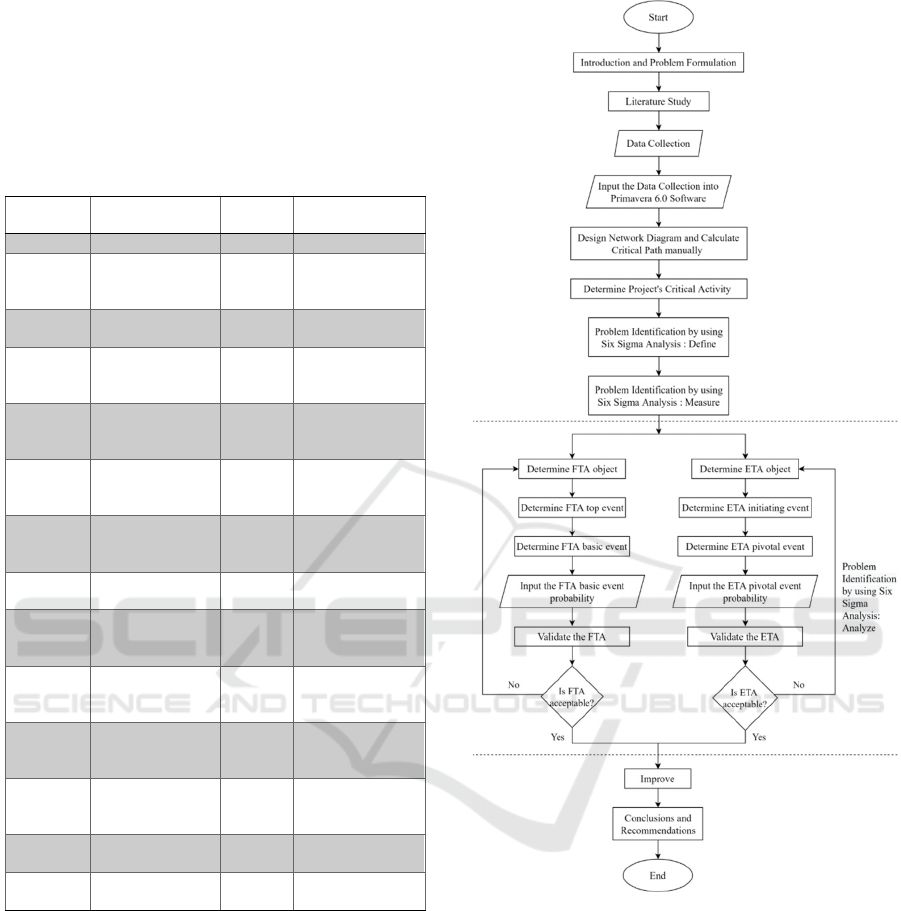
3 METHODOLOGY
The procedures of the research are as follow:
1. Formulations of Problems
The formulations of the problems are decided as the
purpose or the goal of the research.
2. Literature Studies
To support the research itself, literature studies are
needed to develop insight and analysis. In this case,
the literature needed is as follows:
a. A study about offshore pipeline projects.
b. A study about project management and project
delays.
c. A study about critical path methods.
d. A study about six sigma analysis.
e. A study about fault tree analysis
f. A study about event tree analysis.
g. A study about risk matrix
3. Data Collection
Data collection is needed as material to support the
research hypothesis. The data corredelay with the
evaluation and the current conditions. The data
needed are as follows:
a. Pipeline repair and replacement project report
data
b. Pipeline repair and replacement project master
schedule data
c. General data about the pipeline installation project
d. Make a questionnaire to look for the probability
of basic FTA events, pivotal ETA events, and
determination of risk matrices.
4. Data Analysis and Discussion
The data that has been collected will be analyzed and
discussed:
a. Make network diagrams and find project critical
activities using the critical path method.
b. Identification uses 4 stages of six sigma analysis
(define, measure, analyze, and improve).
c. Determine the root causes that can cause the
project to be delayed by using fault tree analysis.
d. Determine risk by using event tree analysis.
e. Determine the probability of project delay.
5. Results and Conclusions
The results of this study are used as a reference for
decision making in planning subsea pipeline projects
in the future, so as to advance the performance and
smoothness of all underwater pipeline project
activities. The flowchart of this paper are shown in
Figure 1.
4 ANALYSIS RESULTS AND
DISCUSSIONS
4.1 Data Collection
Data collection is the most important thing in project
planning because without the complete data planning
Project Planning of Offshore Pipelines Replacement: Study Case at Offshore North West Java
115
the project cannot be planned properly. In this study,
the following data were obtained from one of the oil
and gas company. Data that are needed in this study
include work data on project activities, duration of
project activities and relationships between the
project activities (predecessors).
Table 2: Project Activity, Duration, and Predecessor.
Activity
ID No.
Activities Duration
(day)
Predecessor
1 Project Star
t
0 -
2 Project
Management &
Service
78 1FS+5
3 Pipeline Report
(Engineering)
66 1FS+2
4 Pipeline
Drawing
(Engineering)
65 1FS+2; 3SS
5 Material Take
off
(Engineering)
45 1FS+2; 3SS
6 Request for
Quotation
(Engineering)
37 1FS+3; 3SS+1
--------------------
--------------------
--------------------
32 Post-Lay Survey
(Installation)
5 26FS
33 Pre-
Commissioning
Pipeline A
6 0FS; 31FS;
32FS
34 Pre-
Commissioning
Pipeline
C
9 33FS
35 Pre-
Commissioning
Pipeline B
9 34SS
36 Provisional
Acceptance
(PAC)
0 35SS
37 Punch List PAC
Completion
18 33FS
38 Final
A
cceptance
12 36FS; 37FS+20
4.2 Creating a Gantt Chart using
Primavera P6 to Obtain a Network
Diagram
Primavera P6 outputs are in the form of Gantt charts
and network diagrams. The network diagram formed
in Primavera P6 is a diagram of type AON (Activity
on Node) where project activities are represented in
nodes. However, Primavera P6 is not able to show the
number of ES (Initial Start), EF (Initial Finish), LS
(Delayst Start), and LF (Delayst Finish) manually.
Figure 1: Flowchart.
4.3 Make Network Diagrams and
Perform Critical Path Method
Calculations Manually
This critical activity forms a critical path where if one
or more project activities are delayed, it will cause the
entire project to be delayed. Therefore, activities in
the critical path need more supervision in the
timeliness of completion. The activity nodes coloured
in red indicate the critical activities and the direction
of the red arrows indicate the critical paths.
ISOCEEN 2019 - The 7th International Seminar on Ocean and Coastal Engineering, Environmental and Natural Disaster Management
116

4.4 Problem Identification using Six
Sigma Analysis (Define)
At this stage a project charter will be made to revew
information and problems that will occur in the
offshore pipeline replacement project of the company
under study. Project charter can provide information
about general information, project scope, resource
requirements, critical time schedules, roles and
responsibilities of the project team.
Table 3: Project Charter - Project Scope.
Project Scope
Situation / Problem / Opportunit
y
In this project there are indications of delays due
to a lar
g
e deviation in the pro
j
ect plannin
g
data.
Pro
j
ect Goals
Maintaining the company's oil and gas production
as well as to obtain additional production by
installing a new pipeline to replace the existing
dama
g
ed pipe.
Table 4: Project Charter - Project Scope.
In Scope / Out of Scope
In Scope:
● Installation of new pipes with a 12 "OD size
and 1 km pipe length.
● Pre construction survey.
● Removal of the subsea obstacle that can
hinder the installation of new pipes.
● Survey of laying subsea pipelines with ROV.
● Installing risers, bends, and spools.
● Post lay survey.
● Installation supports on pipelines identified
as free spans.
● Flooding, pigging, hydrotest, drying, purging
and pre-commissioning of new pipes.
● Installation of break out spool between riser
and topside piping.
● Disassemble existing OD 8 "riser sizes,
including riser clamps and end caps
installation.
● Carry out work activities using a pressurized
environment for installing riser clamps.
● Perform bevel end repairs at the end of the
pipe.
● Welding procedure specifications using
ASME IX code, API 1104 (PSL 2), AWS
D1.1 and compan
y
specifications.
Out of Scope:
● There are no monetary problems at home or
abroad during the project work.
● Project detail procedure has not changed and
is in accordance with the contract during the
p
ro
j
ect work.
Table 5: Project Charter - Project Scope.
Ob
j
ectives
● Project on schedule.
● Without problems or work accidents.
● The project does not over cost.
● Stages of work are carried out according to
qualit
y
standards.
Pro
j
ect Assumptions
● The document engineering process ran
smoothly.
● The procurement process went smoothly.
● The construction process is running
smoothly.
● The installation and checking process runs
smoothl
y
.
Risk and Dependencies
● Lack of resources.
● The risk of a project being delayed due to
concurrent workers.
Risk and Dependencies
● Increased project costs due to accuracy of
cost estimates and poor scope.
● Risk that the project will fail to produce
results according to project specifications.
● Mistakes in strategies such as choosing
technology that cannot function properly.
● Operational risks include risks from poor
implementation and process problems such
as procurement, production and distribution.
● Risks associated with external hazards,
includin
g
storms, floods and earthquakes.
4.5 Problem Identification using Six
Sigma Analysis (Measure)
In calculating and identifying the problem, timeliness
is defined as an element which directly redelayd to
the expected time calculation. Project planning time
must be according to actual progress time. Therefore,
at this stage an analysis is carried out to determine the
sigma value with a percentage deviation between the
time of planning and the time of progress with the
maximum value of 6. The sigma value is obtained
from the conversion of DPMO (defects per million
opportunities) value. The DMPO value is derived
Project Planning of Offshore Pipelines Replacement: Study Case at Offshore North West Java
117

from the difference of project time (in percentage),
i.e. the deviation that occurs between the time of
project planning and the time of actual progress.
For detailed calculation, the biggest deviation
between monthly planning time and the actual time is
taken. The result found that in October there was a
time lapse of 5.05%. Defective Value per Million
Opportunities (DPMO) is obtained from the formula:
In this calculation, the DPMO value is:
DPMO = 5.05% × 1000000 = 50500
DPMO calculation results show any deviations
from the target that was decided. This DPMO number
will then be used to get the sigma level by converting
the DPMO number to the sigma number.
In the calculation of more specific sigma numbers,
calculations can be performed using Microsoft Excel.
The formula for calculating sigma number is:
By using pre-existing data, the sigma number is as
follows:
Sigma Number = NORMSINV (1 - 5.05%) +1.5 =
3.140025
The sigma calculation results show a more
specific result of 3.14 out of 6 (maximum) which can
be increased again with improvements made. This
result occurred in October where there were 3
procurement, construction and installation.
Table 6: The Basic Event and Intermediate Event of the
FTA Procurement Phase Experienced Interference.
Intermediate
Event Level 1
Intermediate
Event Level 2
Basic Event
Procurement
Stage
Experiencing
Interference
Problem in
ordering
material
Planning is not
mature enough
p
rocurement
Material provider
negligence
Communication
and coordination
are unclea
r
Material arrived
at the project
site delay
Shipping goods
from abroa
d
Material order
dela
y
The fabrication
process has been
delaye
d
Material delivery
is dela
y
Problems with
p
a
y
ment
Table 7: Basic Event and Intermediate Event FTA
Construction Phase Experienced Disruption.
Intermediate
Event Level 1
Intermediate
Event Level 2
Basic Event
Construction
Phase Has
Disturbances
Problematic
equipment
section
Lack of e
q
ui
p
ment
The equipment is
damage
d
Equipment arrived
dela
y
Low ability of
e
q
ui
p
ment
The labor
force has a
problem
Lack of workforce
Difficulties in labor
mobilization
Labor productivity
is lacking
Absent laborers
Inexperienced
workforce
Problems arise
b
etween workers
Design changes that resulted in the
addition of wor
k
Bad weathe
r
Natural Disaste
r
An accident
occurred
during the
construction
process
Unexpected
accident
Lack of supervisor
and control
Communication and
coordinator are
unclea
r
Problems arise
b
etween workers
Lack of
socialization and
work safet
y
trainin
g
An error
occurred
during the
construction
process
Document/ picture
not detail
Inexperienced
workforce
Communication and
coordination are
unclea
r
4.6 Identifying Problems and
Calculating Probability of
Problems using Six Sigma Analysis
(Analyze): Fault Tree Analysis and
Event Tree Analysis
● Determine top FTA events and ETA initiating
events:
The top event and initiating event that is being
investigated is the delay in the offshore pipeline
replacement project.
DPMO = Lar
g
e Deviation x 1000000
Sigma Number = NORMSINV (1 – Large Deviation + 1.5
ISOCEEN 2019 - The 7th International Seminar on Ocean and Coastal Engineering, Environmental and Natural Disaster Management
118

Table 8: The Basic Event and Intermediate Event of the
FTA Installation Stage Are Interrupted.
Intermediate
Event Level 1
Intermediate
Event Level 2
Basic Event
Installation
Phase Has
Interference
Problem in
equipment
section
The equipment is
damage
d
Low standard of
e
q
ui
p
ment
Bad weathe
r
Natural disaste
r
An accident
occurred during
the installation
process
Unexpected
accident
Lack of
supervision and
control
Communication
and coordination
are unclea
r
Problems arise
b
etween workers
Lack of
socialization and
work safety
trainin
g
An error
occurred during
the installation
process
Document/
p
icture not detail
Inexperienced
workforce
Communication
and coordination
are unclea
r
Table 9: Top Event Probability.
No Basic Event Probability
1
Procurement Stage
Experiencing Interference
0,008360286
2
Construction Phase Has
Disturbances
0,022554886
3
Installation Phase Has
Interference
0,021781371
Top Event Probability (Total) 0,052696543
● Determine basic FTA events and ETA pivotal
events:
Basic events and pivotal events are determined by
conducting a literature review of delays in
construction projects and subsea pipeline projects.
The results of the basic event and pivotal event are
obtained after validating to the respondent (client
side).
Opportunities for each basic event were obtained
with a questionnaire from 7 respondents experienced
in underwater piping projects. After that, do the
calculations to get the probability of intermediate
events and top event. The event tree diagram shows
that the initiating event of this research is that the
delay offshore pipelines replacement project has 6
probability events A, B, C, D, E, and F.
(a) Event A
Replacement of the underwater pipeline is completed
on time because it runs smoothly and there is no
problem in one of the pivotal events. The probability
of Event A is 0.05270 x 0.83 x 0.77 x 0.80 x 0.69 x
0.71 = 0.0132
(b) Event B
Replacement of underwater pipelines is complete but
can be delayed for 5-6 weeks due to shortages and
conditions of available equipment. The probability of
Event B is 0.05270 x 0.83 x 0.77 x 0.80 x 0.69 x 0.29
= 0.0053
(c) Event C
Replacement of underwater pipelines is complete but
can be delayed for 3-4 months due to lack of
manpower and inexperience. The probability of Event
C is 0.05270 x 0.83 x 0.77 x 0.80 x 0.31 = 0.0085.
(d) Event D
Replacement of underwater pipelines is complete but
can be delayed for 4-5 months due to delays in
procurement. The probability of Event D is 0.05270
x 0.83 x 0.77 x 0.20 = 0.0067
(e) Event E
Replacement of subsea pipelines is complete but can
be delayed for 5-6 months due to lack of
implementation and supervision of project
management. The probability of Event E is 0.05270 x
0.83 x 0.23 = 0.0100
(f) Event F
Replacement of subsea pipelines cannot be resolved
due to cost issues during the project, considering costs
are the main thing of the project's success. The
probability of Event F is 0.05270 x 0.17 = 0.0090
The next step is to determine the risk categories of
each event into the risk matrix. The probabilities of
each output are matched into the Frequency Index
(FI) table and the consequences of each output are
matched into the Severity Index (SI) table. The FI and
SI tables are referenced from DNV RP F107 (Pipeline
Risk Assessment).
Project Planning of Offshore Pipelines Replacement: Study Case at Offshore North West Java
119
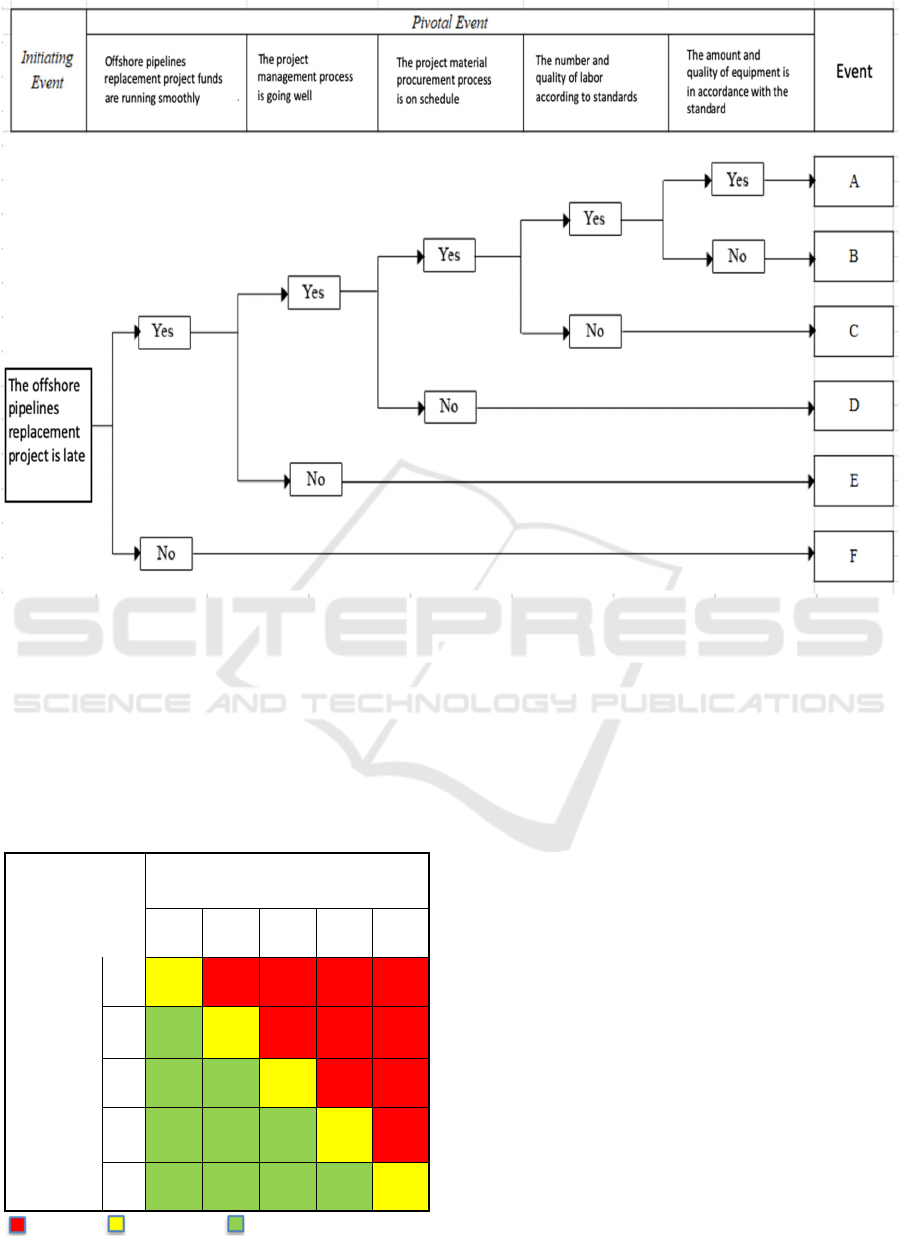
Figure 2: Event Tree
Diagram
.
Table 10 explains that event A is categorized as
moderate risk while events B, C, D, E, and F are
categorized as high risk due to high probability and
high severity. In this result, there is no low risk result
because the lowest probability of event is categorized
as high probability (4) and very high (5).
Table 10: Risk Matrix.
Severity
1 2 3 4 5
Frequency
5
A E F
4 B C, D
3
2
1
High Risk Medium Risk Low Risk
4.7 Determination of Problems using
Six Sigma Analysis (Improve)
It is known that in that month there are material
delivery activities, the likelihood of this happening is
that the material delivery is delayed in view of the
large probability at the basic event. Delay material
delivery has a probability of 0.007389714.
The step that can be taken is to complete all
material financing because monitoring of funding in
ordering materials is important because in the
absence of funds the goods cannot be ordered or
delivered on time. For the next project, it is expected
that the procurement plan can be planned as well as
possible so that there are no more errors in the
delivery of materials and the project is running
optimally.
5 CONCLUSIONS
Based on discussion in the previous chapter, these are
the conclusion of the study:
1. The offshore pipelines replacement project has
19 critical activities created from 38 project
ISOCEEN 2019 - The 7th International Seminar on Ocean and Coastal Engineering, Environmental and Natural Disaster Management
120

activities.
2. Many factors cause project delay. These factors
are divided into 3 intermediate event branches,
namely the procurement, construction and
installation stages.
3. The offshore pipelines replacement project using
Fault Tree Analysis (FTA) obtained the results of
the top event probability on this project of
0.05270.
4. Offshore pipelines replacement project using
Event Tree Analysis (ETA) obtained 6 events with
different probabilities and consequences.
REFERENCES
Baccarini, David., 1996. The Concept of Project Complexity
– a review. International Journal of Project
Management, volume 14, I(4), pp. 201-204.
Brue, G., 2002. Six Sigma for Managers, McGraw-Hill
Publishing. New York, 1
st
Edition.
Ericson, C. A., 2005. Hazard Analysis Techniques for
System Safety. A John Wiley & Sons, Inc., New Jersey.
ISO 31010, 2009.Risk Management – Risk Assessment
Techniques. British Standard Institution.
Heizer, J. & Render, B., 2014. Operation Management
Sustainability and Supply Chain Management, Pearson,
11
th
Edition.
Larasati, Dea P., 2019. Improvement of Bottle Production
Quality with Six Sigma Method and Data Mining
Method at PT. Bumi Mulia Indah Lestari. Jakarta:
Industrial Engineering, Trisakti University.
PMBOK, 2008. A Guide to Project Management Body of
Knowledge. Newton Square: Project Management
Institute.
Samad, F., 2019.Analysis of Schedule and Delay Risk of
Onshore Pipeline X Project in Melaka. Surabaya:
Department of Ocean Engineering Sepuluh Nopember
Institute of Technology.
Silvianita., Redana, F. , Rosyid, DM., Chamelia, DM .
2017a. Applied Mechanics and Materials 862, 315-320.
Silvianita Daniel M Rosyid, Anantya Novega S. 2017b.
Project Delay Analysis of HRSG. In, 79:12036. IOP
Conference Series: Earth and Environmental Science.
Silvianita, Robby Guntara, Daniel M. Rosyid, and Wahyudi
Citrosiswoyo. 2018. Occupational Risk Analysis Using
Bowtie Method on Mooring Change Replacement
Production Barge Ocean X Project. International
Journal of Civil Engineering and Technology 9 (13):
356–65.
Szymanski, P., 2017. Risk Management in Construction
Projects. Procedia Engineering, I(208), pp. 174-182.
Project Planning of Offshore Pipelines Replacement: Study Case at Offshore North West Java
121
