
Implementation of Lean Project Management in Offshore Pipeline
Installation Project
Novanti Ismi Yusri, Silvianita, Daniel M. Rosyid, Suntoyo and Wimala L. Dhanistha
Ocean Engineering Department, Institut Teknologi Sepuluh Nopember, Surabaya, Indonesia
Keywords: Lean Project Management, Waste, Critical Chain, Fuzzy FMEA, Offshore Pipelines Installation.
Abstract: Project implementation is inseparable from the risks that can affect the project will go according to plan or
not. Therefore, good project management is very important to avoid project problems such as delays. Project
delays can be caused by unproductive activities and the elements involved. The un-producibility becomes
something that does not have added value or in Lean Project Management known as Non-Value-Added
Activities (waste). In the implementation of the Offshore Pipeline Installation Project undertaken by one of
the oil and gas companies in Indonesia, there was a delay in the process, therefore a risk analysis of the causes
of the delay is required with the Lean Project Management approach to identify waste by applying the
Fishbone Analysis method and project risk analysis using the Fuzzy Failure Mode and Effect Analysis method
that will prevent or detect the failure mode earlier. And to estimate the project, it is applied by using the
Critical Chain Project Management (CCPM) method which will produce project optimization to meet the
Lean Project Management criteria, namely eliminating invaluable activities in order to make the project more
effective and efficient.
1 INTRODUCTION
The oil and gas industry have an important role in the
mineral resources needed by the state for its people.
With abundant oil and natural gas reserves in
Indonesia, facilities are needed to support these natural
resources. One of the infrastructures that are widely
used for natural resources is using subsea pipelines.
Therefore, this company carried out the offshore
pipeline installation project in order to maintain the
company's basic production and to obtain additional
production. This project is basically to install a new
pipeline and to replace the damaged pipeline.
In its implementation, the Offshore Pipeline
installation project undertaken by this company was
delayed, but in the end, the project could be
completed on time. Seeing the various things that
happened and the number of methods used in project
planning, this paper will identify an offshore pipeline
development project planning with the concept of
Lean Project Management. This paper discusses the
risks of pipeline project delay and optimize it. Many
methods can be used to analyse the delay of a project,
one of the mare using fishbone diagram which
functions as a method for analysing the causes of
project delays that are divided into several causal
indicators, namely machine, material, and method
workers (Khotimah, 2019). By using the fishbone
method to analyse project waste and using the CCPM
method to plan schedules to avoid Student Syndrome
and Parkinson's Law Effects, it allows the writer to
optimize and streamline project planning to be more
effective and efficient.
2 METHODOLOGY
The flow work in this study conducted by stages
based on the following steps. The first step is data and
reference materials collection from textbooks,
journals, previous research etc. During this stage a
comprehension study of Lean Project Management,
Critical Chain Project Management are also
conducted for optimization project.
2.1 Data Collection
The flow and procedure of the research were carried
out in the following stages. This stage includes efforts
in understanding offshore pipeline studies, the use of
the CCPM method and the collection of data needed
to complete this paper. The data required include:
100
Yusri, N., Silvianita, ., Rosyid, D., Suntoyo, . and Dhanistha, W.
Implementation of Lean Project Management in Offshore Pipeline Installation Project.
DOI: 10.5220/0010057501000105
In Proceedings of the 7th International Seminar on Ocean and Coastal Engineering, Environmental and Natural Disaster Management (ISOCEEN 2019), pages 100-105
ISBN: 978-989-758-516-6
Copyright
c
2021 by SCITEPRESS – Science and Technology Publications, Lda. All rights reserved

• Details of project activities based on existing
schedule in accordance with project contract.
• Data analysis of the main problems of the
project.
2.2 Identify Waste using Fishbone
Diagrams
Identification of waste is done by using fishbone
diagrams made from project’s data analysis of the
major problems and then discussed with expert
judgment. Expert judgment is a major source of
information that can provide vital input to project
managers, who must ensure that projects are completed
successfully, on time, and on budget (Szwed, 2016).
2.3 Managing Variation for
Optimization of Project Scheduling
using the CCPM Method
This scheduling begins by creating a network in
accordance with project data that has been obtained.
Then determine where the critical path is located.
Critical Chain Project Management (CCPM) is a
TOC tool used for planning and project management.
It can be used both in one-project and multi-project
structures where resources are being used in several
projects simultaneously (Izmailov, 2016).
2.4 Risk Control
In this risk control precautions are taken to reduce the
impact of the occurrence of risk variables that are in
the red zone, while in the green zone risk control is
not carried out because the impact can still be
tolerated. Efforts to minimize this risk are carried out
by implementing steps directed at the results of the
assessment of data obtained from the risk analysis
process. This is done by developing options and
determining actions to increase opportunities and
reduce threats to project objectives. Risk analysis
have been used in many areas namely risk analysis for
gas platform (Silvianita et al 2016).
3 RESULTS
3.1 Project Overview
Projects are one-time activities, with limited time and
resources to achieve predetermined outcomes, for
example products or production facilities (Soeharto,
1999). This project requires to maintain the
company's production base and obtain additional
production. This project is basically to install new
pipes and to replace pipes that are already damaged.
The project is located in the working area of one of
the oil and gas industries which is located about 80 -
200 km northeast of Jakarta. The replacement pipe
that will be replaced is 8 "NPS Gas Line from
Platform X to Platform Y.
Table 1: Pipe Description.
Year 2018
No
Pipeline
Name
Size
(inch)
Length
(Km)
Repair
Strategy
1. B – A 12” 1 Full
2. E – C 10” 7.2 Full
3. D – E 8” 7.2 Full
3.2 Data Collection
In this stage, data collection was obtained from the
results of Major Problem reports that occurred in the
project. Then the data is validated with interviews with
an expert that related to the causes of waste in this
study which is Offshore Pipeline Installation project.
3.3 Work Breakdown Structure
Work Breakdown Structure shows overall project
activities that used as a basis for determining volume
of work, duration of activity and also used as a
scheduling guide. Below is the table of activities on
Offshore Pipeline Installation project as follows:
Table 2: Work Breakdown Structure of Offshore Pipelines
Installation Project.
Activity Duration (Days)
Basic Engineering 210
Project Management Team (PMT) 129
Detail Engineering 113
Coated Pipe 10” 251
Pipe Bend 250
Crossing Material 274
Riser Clamp dan Riser Fabrication 49
Survey 8
Preparation 79
Pipeline Laying 8
Mobilization 26
Riser Installation 14
Instalasi Crossing 14
Precommissioning 8
Certification 33
Final Acceptance 22
Implementation of Lean Project Management in Offshore Pipeline Installation Project
101

3.4 Project System
A project that is experiencing delays is certainly due
to factors that influence waste (Hapsari, 2014). A
project that is experiencing delays is certainly due to
factors that influence waste. Waste in the project is
actually something that must be considered in the
sustainability of the project. Project system have been
carried out by understanding the project and
discussions with the implementer to identify the
waste that is likely to arise in project implementation.
3.5 Waste Identification using Fishbone
Diagrams
Lean is an often-used adjective in business these days,
but there’s some confusion over its exact definition.
In essence, the goal of Lean is to maximize value
while minimizing waste (Eby, 2017). Identification of
waste or known as Non-Value-Added activity aims to
determine the waste that occurs in the project. The
identification process is done by using fishbone
diagrams and If-Then formulations so that the project
implementer can take appropriate corrective and
preventive actions for future projects where there is
the potential for waste to occur so that excessive
waste can be avoided. Based on fishbone diagrams
below, it can be seen the types of waste that most
often appear in Offshore Pipeline installation projects
from 8 waste that have been defined by Womack and
Jones (1996) are Waiting and Unnecessary Motion.
Waiting, which is a condition where project
activities have been delayed so that the delayed
activity can result in delays in project
implementation.
Unnecessary Motion, which is the movement that
is not necessary, where the movement of
unproductive workers that should not need to be done
in the implementation of the project.
From Figure 1, the Fishbone Diagram above can
be seen as the causes of waste generation in the
project. It contains 9 failure modes and 20 causes that
have been classified based on factors causing waste.
Those are Man, Material, Method, also Tools and
Machine. The causes of waste then processed into If-
Then formulation to further know possible actions
that implementer can take to minimize waste with
preventive or corrective steps.
3.6 Managing Variations
The variations contained in the project is considered
as uncertainty, therefore the project executor needs to
adjust the existing variations by estimating. In this
project, the variation made estimation is time. The
aim is that the project executor can estimate the time
needed during implementation.
Identification of waste in the project system
project analysis found that the most influential waste
in the project is waiting and unnecessary motion. By
knowing the waste, then the scheduling improvement
recommendations will be made with the Critical
Chain Project Management (CCPM) as follows.
3.7 Critical Chain Project
Management
All projects are carried out in a dynamic environment.
This is an inherent characteristic of project activities
which duration cannot be estimated precisely.
Estimate Activity Durations is the process of
estimating the number of work periods needed to
complete individual activities (PMBOK, 2013).
Among other factors, the accuracy of the estimation
depends on the level of uncertainty. Variation
problems must be addressed early in the development
schedule. Safety time must be included in the project
and must ensure its robustness. Time analysis have
been used in many areas such as in graving dock
project (Silvianita et al, 2018).
Table 3: Work Breakdown Structure with CCPM.
Pipeline Installation
Summary Task CCPM Duration (Days)
Basic Engineering 91
Project Management
Team (PMT)
105
Coated Pipe 10” 126
Pipe Bend 125
Crossing Material 137
Riser Clamp dan
Riser Fabrication
25
Survey 4
Preparation 40
Pipeline Laying 7
Mobilization 4
Riser Installation 13
Crossing Installation 7
Precommissioning 4
Certification 16
Final Acceptance 11
ISOCEEN 2019 - The 7th International Seminar on Ocean and Coastal Engineering, Environmental and Natural Disaster Management
102

Figure 1: Fishbone Diagram of Waste.
Waste
Man
Material
Tool & Machine
Method
Less
Competent
of Workers
Lack of dedicated
personnel on QC
personnel
Absence of
Supervisor and weak
su
p
ervision
Delay in the development of the
Offshore Installation Procedure
There is no material control
in the warehouse and
offshore
Material certification
has exceeded the
deadline and forgotten
e
q
ui
p
ment
Availability of
purchase material
re
q
uires a lon
g
time
Lack of
cooperation
between workers
Incompatibility of
Material
There are many
additional jobs per
da
y
Crew competency lacks
during project execution
Lack of dedicated
personnel on
Commissionin
g
Lack of Manpower to
prepare for procedure
execution
Shorthanded
Some QCs in the field
lack experience in
pipeline work and lack
of familiarity of Scope
Projects
Design Concrete
Mattress is too long
Riser Clamp installed
requires a long time
because it is not in
accordance with fabrication
Material supply is not
appropriate
Not using a measuring
instrument
p
ro
p
erl
y
Incompatibility of
Work Procedures
Worker accident
Job changes are not
accordin
g
to
p
rocedure
Work Planning
Not Running
Smoothly
Does not take into account
the installation system
Determination of
instructions lasts a
long time
There is no
coordination in the
installation
Implementation of Lean Project Management in Offshore Pipeline Installation Project
103
However, the addition of time will increase the
overall project duration, so that the lowest possible
amount of safety time must be added to the schedule.
CCPM controls several problems by including
buffers in the project schedule (Leach, 2000). In this
case, the CCPM adds a safety factor to the activity by
solving several factors that impact human actions in
the project environment. By applying the CCPM
method to project scheduling, it is expected that
problems that occur in the project, such as student
syndrome and Parkinson's law effects can be avoided.
3.8 Network Planning
In the initial stage, the Work Breakdown Structure
(WBS) is defined as a predecessor and successor
between activities.
Table 4: Network Activities.
Activity Predecessor Successor
Basic Engineering START A3,B2,B3,C1
Project Management
Team (PMT)
C1 D2
Detail Engineering A1,C1 C3
Coated Pipe 10” START B4
Pipe Bend A1 B4
Crossing Material A1 C4
Riser Clamp dan
Riser Fabrication
B1,B2 C5
Survey A1 A2,A3,C2
Preparation C1 C4
Pipeline Laying A3 D1
Mobilization B3,C2 C6,C7,D1
Riser Installation B4 C6,C7
Instalasi Crossing C4,C5 D1
Precommissioning C4,C5 D1
Certification C5,C6,C7 D2
Final Acceptance A1,D1 END
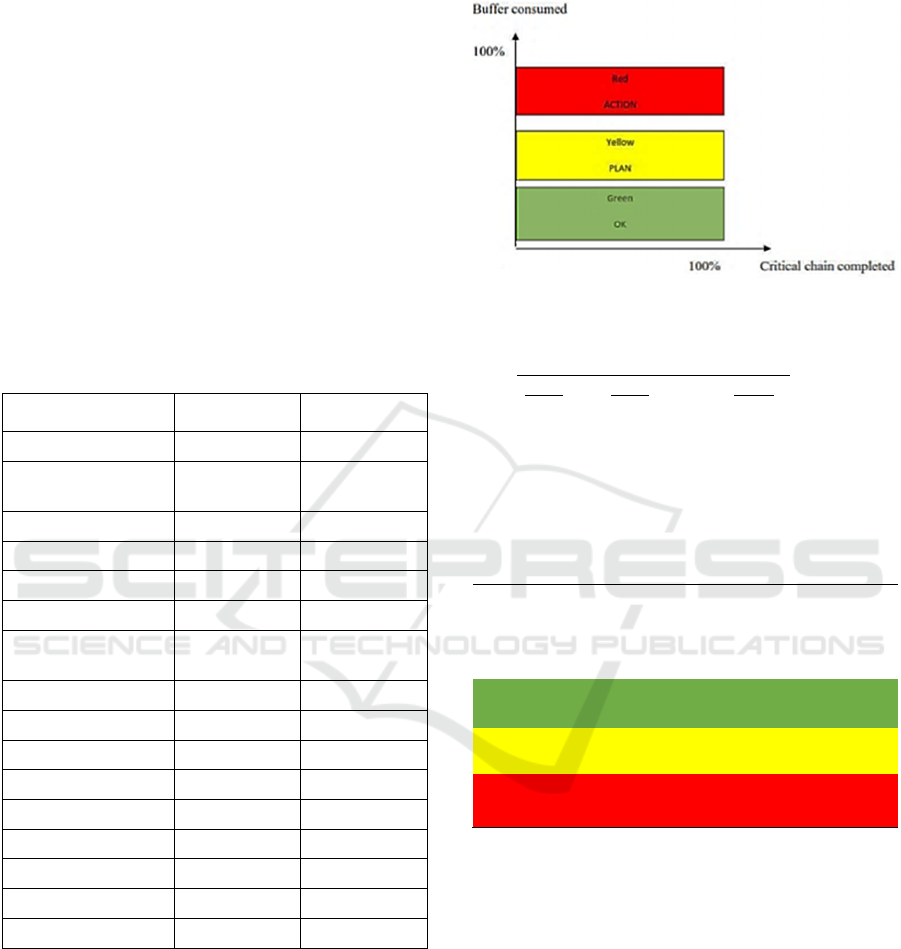
3.9 Buffer Management Analysis
This analysis is used to monitor the schedule that
already exists in Network Planning when the project
is executed. The application of the CCPM method
only requires supervision on the Project Buffer, in
contrast to some other scheduling methods that must
be monitored throughout the entire project activity.
This Buffer Management is useful for maintaining the
reliability of the project schedule but does not change
the critical trajectories that exist.
Figure 2: Buffer Distribution Area (Valikoniene, 2014).
Buffer Size =
2 x
⋯
(Eby, 2017)
Based on calculations and analysis, it has been
found that the amount of project buffer is 82.4 days.
From these results, will be divided equally based on
buffer distribution area.
Table 5: Buffer Use.
Buffer
Region
Range
Project
Buffer
(Days)
Used
Duration
(Days)
Green 0 % - 33 % 82 < 27,06
Yellow 34 % - 67 % 82
27,06 -
54,94
Red 68 % - 100 % 82 > 54,94
4 CONCLUSIONS
Based on the result of the analysis, it can be
concluded that the delay of the offshore pipeline
installation project was caused by 9 failure modes and
20 causes. And non-value-added activities or waste
that arises in offshore pipeline installation projects
based on 8 types of waste are waiting and
inappropriate processing. Activities that do not added
a value or waste that appears in offshore pipeline
installation projects based on 7 types of waste are
waiting and unnecessary motion. The application of
the CCPM method, the acceleration of work time in
ISOCEEN 2019 - The 7th International Seminar on Ocean and Coastal Engineering, Environmental and Natural Disaster Management
104

scheduling is 183 days and when the project buffer
has been used for more than 59 days or has entered
the red zone, the project implementer must take
action.
REFERENCES
Eby, K., 2017. The Definitive Guide to Lean Project
Management. Smartsheet.
Hapsari, R. I., 2014. Penerapan Metode Lean Project
Management dalam Perencanaan Proyek Konstruksi
pada Pembangunan Gedung SDN Bektihad 2 di
Semanding Tuban, Surabaya, Institut Teknologi
Sepuluh Nopember
Izmailov, Azar, et al. 2016. Effective Project Management
with Theory of Constraints. Science Direct. Russia.
Khotimah, H., 2019. Analisis Risiko Keterlambatan Proyek
Perbaikan Kapal Keruk Jenis Cutter SuctionDredger,
Surabaya, Institut Teknologi Sepuluh Nopember
Leach, L. P. 2000. Critical Chain Management. Boston:
Artech House.
PMBOK Project Management Body of Knowledge. 2013.
A Guide to the Project Management Body of
Knowledge 5th Edition. Pennsylvania Project.
Management Institute Standards Committee.
Soeharto, Iman. 1999. Manajemen Proyek dari Konseptual
sampai Operasional. Jakarta: Erlangga.
Szwed, P. S. 2016. Expert Judgment in Project
Management: Narrowing the Theory-Practice Gap.
United State of America: Project Management Institute,
Inc.
Valikoniene, L. 2014. Resource Buffer in Critical Chain
Project Management. Thesis. Faculty of Engineering
and Phisycal Science University of Manchester,
Manchester.
Silvianita Mohamad Lukman Nur Khakim, Daniel M.
Rosyid, Belinda Ulfa Aulia. 2016. “Risk Analysis Of
Return Support Material On Gas Compressor Platform
Project.” In International Conference, Coastal
Planning for Sustainable Marine Development, CITIES
2016. Surabaya, Indonesia.
Silvianita, Nur Aprillia, Yeyes Mulyadi, Wahyudi
Citrosiswoyo, and Suntoyo. 2018. “Cost and Time
Analysis of Graving Dock Project.” MATEC Web of
Conferences 177: 1–7. https://doi.org/10.1051/
matecconf/201817701028.
Implementation of Lean Project Management in Offshore Pipeline Installation Project
105
