
Evaluation of Underwater Pipeline Design Criteria Due to Safety
Requirement based Hydrodynamic and External Load
Widi Agoes Pratikto, Raditya Danu Riyanto, Silvianita, Rendatiyarso Laksono,
Muhammad Ilham Maulana, Wetta Inggrid Sari, Abiyani Choirul Huda and Liany Ayu Catherine
Department of Ocean Engineering, Faculty of Marine Technology, Institut Teknologi Sepuluh Nopember,
Surabaya, Indonesia
Keywords: Pipeline, Free Span, Rock Berm.
Abstract: Several problems can be solved by piping engineers to protect pipelines so it can be resistant to environmental
and man-made hazards. Factors that can damage the pipeline are usually shipwrecks, faults in dropping and
pulling anchors, dredging activities, fishing activities, and the exploration of undersea. Burial pipelines are
the solutions most often used by engineers for the protective pipeline. However, the burial of the pipeline
cannot always be applied due to unfavorable seabed issues or if there are other factors. This paper will explain
the results of research related to the pipeline by calculating the dimensions of rock berms to protect pipelines
from external loads and analysis of the free span pipeline to check the feasibility of being exposed to
environmental loads.
1 INTRODUCTION
The Oil and Gas Industry is an important sector in
national development both in terms of meeting the
needs of energy and industrial raw materials in the
country as well as producing foreign exchange so that
the management needs to be done as optimal as
possible. The underwater pipeline is one of the most
efficient long-distance transportation infrastructure for
oil and gas for the transfer of oil and gas production
both from exploration on land, near the coast and from
the deep sea with effective and efficient methods.
Failure in the pipeline system can be caused by various
problems, such as free span (due to environmental
loads), and anchor loads (external loads) from ships
that are leaning in the Madura Strait area. A free span
occurs due to vibration or commonly known as the
Vortex-Induced Vibration (VIV) phenomenon that
occurs in parts of the pipe that touches the seabed.
Stability analysis of the pipeline from the environ-
mental load (wave and current) is very important
because it can determine feasibility design of the
pipeline (length of the free span) that has been installed
so that in the future preventive steps can be planned for
the best. Pipeline protection from external loads is also
important because if the pipeline is hit by anchor load
it can cause damage such as buckling and pipe leakage
so that it disrupts the oil and gas distribution process
and causes environmental pollution.
2 RESEARCH DATA
In this study, the area to be analyzed is the Madura
Strait, and the pipeline that will be designed for rock
berm protection and free span analysis are the Block
BD pipeline. In the analysis of concrete armor design
(rock berm) design, an external load size calculation
will be performed. External loads have a big role in
damaging the pipeline system on the seabed, in this
case, the movement anchor from the seabed. In
determining the size of the anchor, an analysis of ship
mobility that often crosses the study area will be
carried out, namely the Madura Strait. The following
are the data used in this study:
Table 1: Ship Sailing Data in the Madura Strait.
(source: PT. Pelindo III)
Ship Type In 2012
Container Ship 2040
General Cargo Ship 2144
Bag Cargo Ship 558
Fuel Tank Ship 1264
Liq. Bulk Non Fuel Ship 447
Dry Bulk Ship 616
Barge 5908
Passenger Ship 1889
30
Pratikto, W., Riyanto, R., Silvianita, ., Laksono, R., Maulana, M., Sari, W., Huda, A. and Catherine, L.
Evaluation of Underwater Pipeline Design Criteria Due to Safety Requirement based Hydrodynamic and External Load.
DOI: 10.5220/0010047000300036
In Proceedings of the 7th International Seminar on Ocean and Coastal Engineering, Environmental and Natural Disaster Management (ISOCEEN 2019), pages 30-36
ISBN: 978-989-758-516-6
Copyright
c
2021 by SCITEPRESS – Science and Technology Publications, Lda. All r ights reserved

Table. 2: Ship Capacity Data in the Madura Strait.
(source: PT. Pelindo III)
Ship Type Max. Capacity
Passenger Ship 15.000 GT
Cargo Ship 5.000 DWT
Ferry Ship 10.000 DWT
Roro Ship 5.000 DWT
Tanker Ship 5.000 DWT
Figure 1: The waters map in the Madura Strait
(source : navionics.com and maps.google.com).
In this study for wind data, current velocity, and
wave data are at coordinates with longitude
113.066248 E and Latitude 7.567736 S over 5 years
namely 2014-2019 with ground data using granules
D50 = 0.03 m.
Table 3: Wind Data in the Madura Strait.
Date
Time
(GMT
+7)
Wind
Dir
(deg)
Wind
Speed
(knot)
High
Wave
Sign.
(m)
Curr.
Speed
(cm/s)
01-12-
2014
00.00 169.26 3.4 0.01 0.51
02-12-
2014
01.00 173.02 3.56 0.01 0.62
03-12-
2014
02.00 176.46 3.72 0.01 0.69
… … … …
13-07-
2019
17.00 144.27 2.08 0.01 4.28
14-07-
2019
18.00 139.43 1.99 0.01 4.45
15-07-
2019
19.00 134.2 1.93 0.01 4.61
Table 4: Pipeline Data.
Parameter Value Unit
Inner diameter of pipe 404.14 (16) mm (inch)
Wall thickness of pipe 13 (0.5) mm (inch)
Wall thickness of concrete 60 (2.4) mm (inch)
Nominal diameter 0.45 m
Allowable free span 23.8 (78) m (ft)
Length of pipe 53 km
Effective Mass 282.68 kg/m
Period 20 year
3 RESEARCH DATA
PROCESSING
3.1 Free Span Calculation
Free span calculation is used to determine the
maximum span length so that the stress that occurs in
the free span does not exceed the yield stress of the
pipe material. The flow of waves and currents that
arise around the pipe, arises a vortex that results in
pressure distribution. This vortex produces
oscillations/vibrations in the pipe. If the frequency of
this vortex approaches the natural frequency of the
pipe, resonance occurs, and this causes fatigue in the
pipe (Yong Bai, 1981).
3.2 Calculation of Critical Span Length
In Boyun Guo (2005), critical span length or pipe
length without support where oscillations occur due
to currents is a relationship between the natural
frequency of the pipe span and the reduced velocity.
The critical span length for cross-flow motion is
𝐿
𝐶
𝑈
𝐷
2𝜋
𝐸𝐼
𝑀
(1)
In Boyun Guo (2005), the natural frequency of a
pipe depends on the stiffness of the pipe, the
condition of the end of the pipe span, the span length,
and the effective mass of the pipe. The natural
fermentation equation of the pipe is as follows:
𝑓
𝐶
2𝜋
𝐸𝐼
𝑀
𝐿
(2)
Fn = frequency of pipe natural (Hz)
Evaluation of Underwater Pipeline Design Criteria Due to Safety Requirement based Hydrodynamic and External Load
31

Ls = longspan (m)
Me = massa of effectivity pipe (kg/m)
Ce = 9.87 pin-pin
E = 2.07 E+11 (N/m
2
)
I = 0.00018 (kg/m
2
)
The critical span lengths for in-flow motion are:
𝐿
𝐶
𝑓
2𝜋
𝐸𝐼
𝑀
(3)
Ls = Span long of critical (m)
Ce = Span end constants
Ur = Reduced Velocitty (m/s)
D = Diameter of outer pipe (m)
Me = Mass of effectivity pipe, (kg/m)
After the calculations we have:
Table 5: Critical length of span.
Parameter
Water Depth
42 m 43 m 44 m
54 m
U
r
cross flow
5 4.7 4.8
5
U
r
in flow
1.4 1.4 1.4
1.4
L
s
cross flow
(
m
)
34.57 33.52 33.87
34.57
f
n
0.48 0.51 0.5
0.48
L
s
in line (m)
16.49 17 16.83
16.49
For most projects, the allowable span length is the
critical span length calculated for in-line motion.
However, when economic factors are taken into
consideration, the length of the critical range
calculated for the cross-flow movement can be
chosen.
3.3 Free Span Due to Scouring
Spans in the pipeline can arise due to local scour of
sea-floor sediments or where the pipe routes through
the seabed are irregular. When the lower current
passes through the pipe, separately vortices are
formed from the top and bottom of the pipe. This
causes fluctuations in hydrodynamic forces which
can produce large oscillations or spans in the
direction of cross-flow when the frequency of vortex
shedding approaches the natural span of vibration.
Pipe failures which can be caused by vortex
movement can be prevented if the vortex shedding
frequency is far enough from the natural frequency of
the pipe stretch so that the dynamic oscillation of the
pipe can be minimized. The frequency of vortex
shedding can be written:
𝑓
𝑆𝑉
𝐷
(4)
fs = frekuensi vortex shedding
S = Strouhal Number
Ve = effective current speed (m/s)
D = Diameter of Pipe (m)
Strouhal number is a function of Reynolds'
number of current flow. The drag coefficient is also a
function of Reynolds' number.
The relationship between the drag coefficient with
the Strouhal number is:
For practical problems, usually, the Strouhal
number is taken at 0.2.
After calculating the results obtained as follows:
Table 6: Free Span.
Parameter
Water Depth
42 m 43 m 44 m 54 m
S 0.207 0.201 0.195 0.183
Free S
p
an 0.147 0.131 0.116 0.043
Mousselli (1981) states that the pipeline stretch
has begun to oscillate when the shedding frequency is
1/3 of the natural frequency of the vibration of the
pipe stretch. To design pipe vortex shedding
frequency comparison is smaller than 0.7 times the
natural frequency of the pipe stretch so that
oscillation does not occur. So it can be written that
oscillation does not appear if: fs ≤ 0.7 fn. Based on
calculations and limitations that fs ≤ 0.7 fn, the pipe
design in the BD block is feasible when viewed from
the scouring analysis of the free span, namely:
Table 7: Analysis of freespan.
Water
Depth
Parameter Check
fs fn 0.7 fn OK / NOT O
K
42
m
0.147 0.477 0.334 O
K
43
m
0.131 0.507 0.355 O
K
44
m
0.116 0.497 0.348 O
K
54
m
0.043 0.477 0.334 O
K
4 ANCHOR CALCULATION
4.1 Calculation of the Main Dimensions
of the Ship
Anchor calculations are performed to determine
dimensions, number of anchors needed, anchor
𝑆
0,21
𝐶
,
ISOCEEN 2019 - The 7th International Seminar on Ocean and Coastal Engineering, Environmental and Natural Disaster Management
32

weight, and chain dimensions. In this study, the
anchors of a 15000 GT Passenger Boat with 10000
DWT Ferry Ships will be compared with the
following data:
Table 8: Data of Ship Comparison for Passenger Ship
15000 GT.
(source: equasis.com)
Ship Name
GT
(m
3
)
DWT
(ton)
Lpp
(m)
B
(m)
T
(m)
Vs
(knot)
Nggapul
u
14739 3175 146.5 23.4 6
15.6
Sinabung
14716 3485 146.5 23.7 6
16.3
Bukit siguntang
14643 3686 146.5 26.5 5.7
15.5
Ciremai
14581 3480 144.8 26.8 5.5
16
Dobonsolo
14581 3500 146.5 23.7 6
15.7
Doro londa
14685 3175 146.5 23 5.9
15.1
Kambuna
14501 3434 144.8 23.7 5.9
17.4
Kelu
d
14665 3537 146.5 23.7 5.8
17.3
Lambel
u
14649 3685 136.03 23.7 5.5
15.9
Rinjani
14501 3434 144.8 23.7 5.7
17.1
Tida
r
14501 3200 144 23.7 6.1
15.4
Umsini
14501 3434 141 22 6
12.5
Table 9: Data of Ship Comparison for Ferry Ship 10000
DWT.
(source: equasis.com)
Ship Name
GT
(m
3
)
DWT
(ton)
Lpp
(m)
B
(m)
T
(m)
Vs
(knot)
Europalin
k
9653 46124 218.8 30.5 6.9
14.7
Finnlad
y
9653 45923 218.72 30.52 6.8
22.6
Finnmai
d
9653 45923 218.77 30.5 6.7
21.3
Finnsta
r
9653 45923 218.77 30.5 6.7
21.6
Finnswan
9653 45923 218.8 30.5 6.9
14.9
La superba
9750 49257 211.5 30.4 7.3
22.7
La suprema
9720 49257 211.5 30.4 7.2
22.8
Skane
8787 42705 200.2 29.6 5.9
11.2
Spirit of
b
ritain
9500 47592 212 31.4 6
16.7
Spirit of
france
9884 47592 212 31.4 6
14.8
Stena
adventure
r
9487 43532 211.56 29.88 5.5
19
Ul
y
sses
9665 50938 209.08 31.84 6.3
18.7
From comparison ship data tables 3.5 and 3.6 can
be made the relationship graph between GT and
DWT, GT with Lpp, GT with B, GT with T, and GT
with Vs for 15,000 GT Passenger Ship and also graph
the relationship between DWT and GT, DWT with
Lpp, DWT with B, DWT with T, and DWT with Vs
for 10,000 DWT Ferry Ships to determine the size of
the main dimensions of the ship to be measured
anchored using linear regression equations.
After obtaining a graph from the comparison,
from the linear regression above (each equation), the
values of the main dimensions of the 15,000 GT
Passenger Boat and the 10,000 DWT Ferry Ship are
as follows:
Table 10: The Main dimensions of Passenger Ships 15000
GT.
Parameter
Value
Units
GT
15000
m
3
DWT
3429.5
ton
L
pp
148.58
m
B
25
m
T
6
m
Vs
15.68
knot
Table 11: The Main Dimensions of Ferry Ships 10000
DWT.
Parameter
Value
Units
DWT
10000
ton
GT
50156
m
3
L
pp
221.5
m
B
30.3
m
T
6.5
m
Vs
19.2
knot
4.2 Determination of Ship Coefficient
Based on Froude numbers, CB can be calculated with
the formula Watson-Gilfilla, CM, and CWP can be
searched by equations in the book "Parametric Ship
Design" page 11. Furthermore, the length of LWL,
LCB, ∇, and Δ can be calculated, which are:
Froude Number (Fn):
= 0.412 (5)
CB : Block Coefficient:
−4.22 + 27.8 ∙ √(Fn ) – 39.1 ∙ Fn + 46.4 ∙ Fn (6)
CM: Midship Coefficient: 0.977 + 0.085 ∙ B − 0.6)
(7)
CWP: Waterplane Coefficient: 0.180 + 0.860 ∙ CP
(8)
LCB: Longitudinal Center of Buoyancy:
8.80 - 38.9 ꞏ Fn (9)
CP: Prismatic Coefficient: C_B/C_M (10)
∇: Volume Displacement: L ∙ B ∙ T ∙ CB (11)
Δ: Displacement: ∇ . ρ (12)
Where, ρ = 1.025 ton/m3
Based on the explanation and formula above the
results of the calculation of the coefficient of the ship
based on the dimensions of the ship obtained are as
follows:
Evaluation of Underwater Pipeline Design Criteria Due to Safety Requirement based Hydrodynamic and External Load
33

Table 12: The dimensions of the Passenger Ship 15000 GT
based on the coefficient of the ship.
Parameter Value Unit
Cb 0.75 -
Cm 0.99 -
C
p
0.76 -
Cw
p
0.84 -
Lcb 7.19
b
ehind of the midshi
p
Δ 805.69 m
3
∇
825.83 ton
Table 13: The Dimensions of the Ferry Ship 10000 GT
based on the coefficient of the ship.
Parameter Value Unit
Cb 0.76 -
Cm 0.99 -
Cp 0.77 -
Cw
p
0.84 -
Lcb 7.23
b
ehind of the midshi
p
Δ 1075.29 m
3
∇
1102.17 ton
4.3 Anchor Dimensions and Weight
Based on BKI Vol. II of 2001 section 18-2, the Z
number can be calculated using the following
formula:
Z = D2/3 + 2.h.B + A/10
(13)
Where,
D2/3: Represents the amount of water displaced
(displacement) when the waterline is in
summer in seawater which has ρ seawater
1.025 tons / m3
H: The effective height is measured from the line
of loading water in summer to the highest end
of the deck.
B: Ship Width
A: The area (m2) is the appearance of the hull
profile, superstructure and houses which have
a width greater than B / 4 which is above the
loading line in summer including length L and
above from height h.
LWL: LPP + (3% * LPP)
D2/3: (LWL x B x T x CB)2/3
In calculating h, it is assumed to be the upper
building and the deck is 2.4 m, so the upper building
and house building
h : Fb + ∑h
: (H-T) + (Number of Floors x Floor Height)
A: LWL x T
Calculate Equipment Number (Z) with the
following equation:
Z: D2/3 + (2 x h x B) + A/10 (14)
After calculating the results obtained are as follows:
Table 14: Calculation of Equipment Number (Z) of
Passenger Ship 15000 GT.
Parameter Value Unit
Lwl 153 m
D2/3 664.76 -
H 14.06 -
A 911.23 -
Z 1456.1 -
Table 15: Calculation of Equipment Number (Z) of Ferry
Ship 10000 DWT.
Parameter Value Unit
Lwl 228.14 m
D2/3 1048.2 -
H 15.43 -
A 1475.2 -
Z 2129.8 -
Based on the calculation, the Z value of the 15,000
GT Passenger Ship is 1456,104 while the Z value of
the 10,000 DWT Ferry Ship is 2129.88. From the
results of calculations prove that the 10,000 DWT
Ferry has a Z value greater than the Z value of the
15,000 GT Passenger ship. Because the greater the Z
value, the greater the anchor obtained from the BKI
table, so in this study we used the Z value of the
10,000 DWT Ferry with a Z value of 2129.88.
Based on the table BKI Volume II 2006
section 18, then with a value of Z = 2129.79 obtained
anchor data as follows.
• Number of anchor bower :2 anchr
• Anchor Bower Weight : 6450 kg
• Anchor Chain
Length : 605 m
Diameter D1 : 81 mm
D2 : 70 mm
D3 : 62 mm
• Mooring Rope
Amount : 5 pieces
Length : 200 m
Broken Load : 425 kN
• Pull Rope
Length : 240 m
Broken Load : 1260 kN
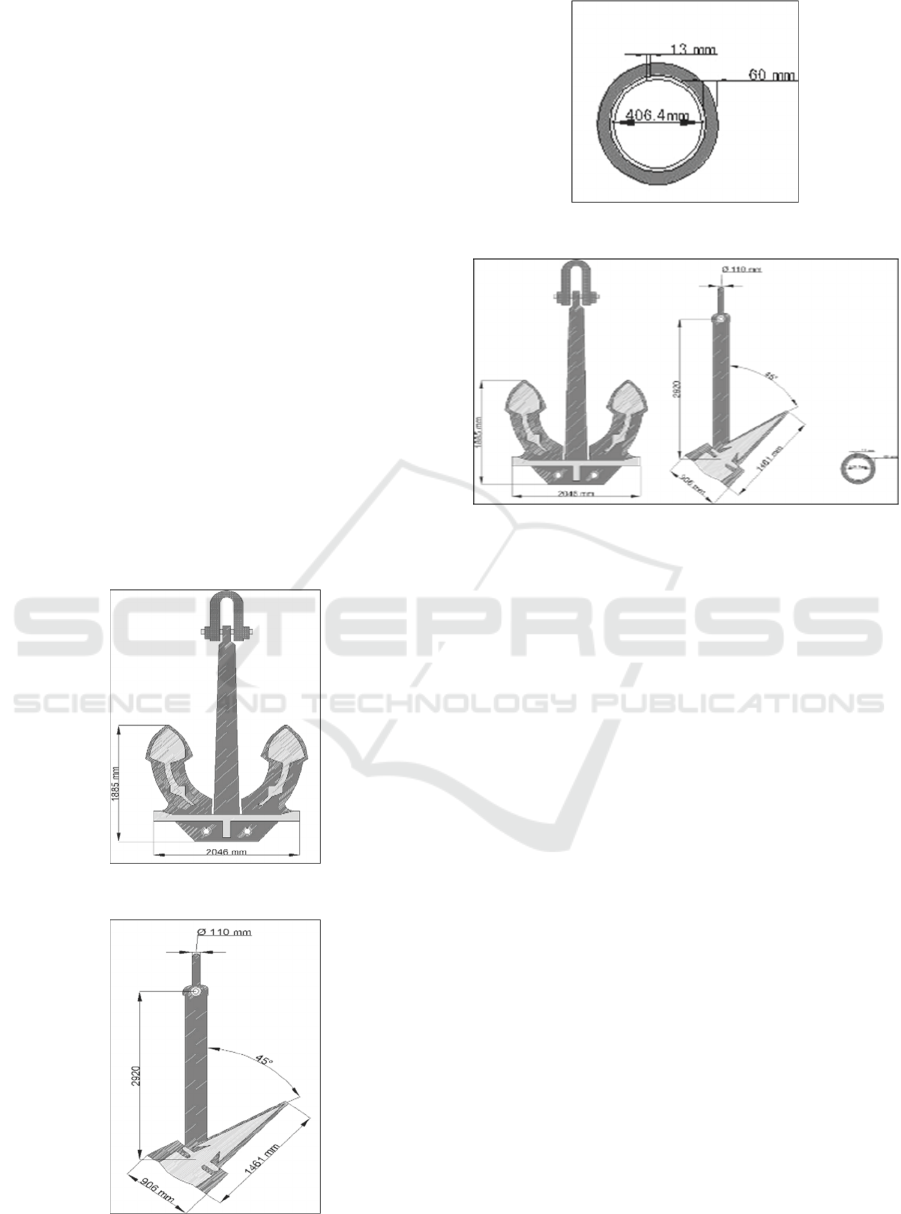
Anchor weight = 6450 kg, then from the
catalog obtained anchor dimensions that
will be used on this ship are:
A = 2920 mm
B = 2046 mm
C = 906 mm
D = 1885 mm
E = 1461 mm
ǾF = 110 mm
ISOCEEN 2019 - The 7th International Seminar on Ocean and Coastal Engineering, Environmental and Natural Disaster Management
34
4.4 Anchor Chain Determination
After getting the data from the anchor, the anchor
chain is selected from the catalog, namely by:
a. Total Length Selected: 605 m
b. Diameter of chain anchor selected: 81 mm
Komposisi dan kontruksi dari rantai jangka
meliputi:
1. Common link
1). 1,00 d = 81 mm
2). 6,00 d = 486 mm
3). 3,60 d = 291.6 mm
2. Enlarge Link
1) 1,1 d = 89.1 mm
2) 6,6 d = 534,6 mm
3) 4,0 d = 324 mm
3. End Link
1) 1,2 d = 97,2 mm
2) 6,75 d = 546,75 mm
3) 4,0 d = 324 mm
Based on the calculation of the dimensions that
have been obtained the following is an illustration of
the anchor size obtained from the calculation results
based on table Z BKI.
Figure 2: The dimension of anchor in the front look.
Figure 3: The dimension of anchor in the beside.
Figure 4: The dimension of pipe and layer in the concrete.
Figure 5: The comparison of Anchor and Pipe.
5 CALCULATION OF ROCK
BERM
The use of berm rock is a common practice to protect
pipes against collisions from fishing gear such as
trawlers and trawlers. Rock berms must be able to
withstand horizontal impact loads, which mainly
depend on the following:
• The shape and mass of a trawler
• Trawling speed
• Direction of attraction
• Seabed conditions
5.1 Dimensions of Rock Berm
The rule of thumb for the design of suitable protection
against anchor anchors has been derived from tests
carried out for 20 years and is mainly used in
connection with the following rock berm parameters:
• Protective stone size (D50)
• The thickness of the protective layer
• Filter layer thickness (if applicable)
• Minimum width of the rocky peak
• Minimum width of the berm rock base
Evaluation of Underwater Pipeline Design Criteria Due to Safety Requirement based Hydrodynamic and External Load
35

Below is a visualization of the structure of berm
rock based on the calculations:
Figure 6: Rock berm illustration.
Based on calculations, the dimensions of the stone
which can be sufficient against the drag anchor are as
follows:
Table 16: Rock Berm Dimension.
Rock berm
dimension
Value
D
50, armour
4 * 81 mm = 0.32 m
H
min, armour
1.46 m * sin(45) = 1.03 m
3 * 0.32 m = 0.97 m
H
min, filter
1.5 * 0.32 m = 0.49m
0.3 m
B
min, top
2 * 2.92m = 5.84m
B
min, bottom
5.84 m + 2*2.5*(1.33+0.48
m) = 14.9 m
6 CONCLUSION AND
SUGGESTION
6.1 Conclusion
Based on the analysis, the free span parameters in the
pipeline show that they are still feasible and do not
require handling to overcome the free span. the
pipeline design to free span with a limit of fs ≤ 0.7 fn:
(Refer to Table 7).
Furthermore, from the analysis of the anchor
weight, the dimension of berm rock which is used as
protection for pipeline on the bottom of the sea from
anchor threats. Dimensions of rock berms are:
B
top
: 5.84 m
B
bottom
: 14.9 m
H
armour
: 1.03 m
(Refer to Table 16).
6.2 Suggestion
The suggestion of this research is:
When doing free span calculations it would be better
if done with 3D modeling, the author has not done 3D
modeling to provide a clearer visual appearance to the
reader.
REFERENCES
Arif, Umar., et. all. Analisa Freespan Akibat Scouring Pipa
Bawah Laut. Jurnal Teknik Kelautan ITS. Surabaya.
Bai, Yong, Bai, Qiang, 2010. Subsea Structural
Engineering Handbook. Gulf professional Publishing.
Great Britain
Bai, Yong, Bai, Qiang, 2005. Subsea Pipelines and Risers.
Elsevier. USA
Ciria, C683., 2007. The Rock Manual. London
DNV RP F105., 2002. Recommended Practices for
Freespanning Pipelines. Det Norske Veritas, Norway.
Guo, Buyon, et. all., 2005. Offshore Pipelines. Gulf
Professional Publishing. USA
Hertia, Arisanti, 2003. Studi Estimasi Scouring dan
Freespans Pada Pipa Bawah Laut PT. Exxonmobil di
Perairan Tuban, Jawa Timur. Surabaya
J.P., Kenny & Partner Ltd, 1993. Structural Analysis of
Pipeline Spans. HSE Books. USA
Naess, A., Almar, 1985. Fatigue Handbook Offshore Steel
Structure. Trondheim.
Nugraha, Muhammad Catur. et. All, 2012. Analisa
Pengaruh Scouring Pada Pipa Bawah Laut (Studi
Kasus Pipa Gas Transmisi SSWJ Jalur Pipa Gas
Labuhan Maringgai – Muara Bekasi). Jurnal Teknik
ITS. Surabaya
Putra, Sebrian Mirdeklis BP. et. all. Simulasi Numeris
Perubahan Morfologi Dasar Laut Pada Desain
Pelabuhan Di Kabupaten Gresik, Indonesia. Jurusan
Pengairan Fakultas Teknik Universitas Brawijaya.
Malang.
Putri, Rieska Mawarni. et. all. Desain Offshore Pipeline
Blok BD Selat Madura. Teknik Kelautan FTSL ITB.
Bandung
Soegiono, 2006. Pipa Laut, Airlangga University Press.
Surabaya.
Triatmodjo, B., 1999. Teknik Pantai. Beta Offset.
Yogyakarta
ISOCEEN 2019 - The 7th International Seminar on Ocean and Coastal Engineering, Environmental and Natural Disaster Management
36
