
The Power of Patience: Management Stress for College Students
Amalia Meutia, Ika Sari Dewi, Dina Nazriani and Suri Mutia Siregar
Department of General & Experimental, Faculty of Psychology, Universitas Sumatera Utara, Medan, Indonesia
Keywords: Coping Stress, Patience.
Abstract: Stress is an integral part of our life and can occur anywhere, including among college students. In general,
stress is pressure exceeds one's perceived ability to cope. How to deal with stress is usually called coping
stress, which is the specific efforts, both behavioral and psychological, that people employ to master, tolerate,
reduce, or minimize stressful events. Two general coping strategies have been distinguished: problem focused
coping dan emotion focused coping. Whereas emotion focused coping includes self-control (part of patience’s
aspect). From this perspective, this research was aimed to investigate relationship between the level of stress
among college students and their patience. Therefore, this study discusses on the relationship between stress
and coping mechanism (patience). This study uses a quantitative correlational by using the patience scale
developed by Subandi and the stress scale on the PSS (Perceived Stress Scale). For the purpose of the study
the researcher selected 347 college students from various University and Faculty. The results of the study
showed there is a strong positive relationship between stress and patience, where stress can contribute 38.5%
of variations in student patience. In other words, the respondents in this study used coping stress in the form
of patience related to the stress they experienced. The implication of the results of this study is the basis for
making a stress management pocket book.
1 INTRODUCTION
College is a transitional period when students of all
ages undergo new experiences, meet new people and
face opportunities which may compound the stress in
their lives (Lindsay et al, 2011). Many college
students may find the academic experience very
stressful. First year student at a university are a group
particularly prone to stress (D’Zurilla & Sheedy,
1991) due to the transitional nature of college life
(Towbes & Cohen, 1996). They must adapt to being
away from home for the first time and to a new social
environment. The upper level students dealing with
pressures related to finding a job or potential life
partner.
In certain periods, students will experience
pressure related to academic responsibility, economic
problems, and lack of skills in managing time (Pariat,
2014). Based on research conducted by Widuri et al
(in Kholidah & Alsa, 2012) it was found that one of
the most common sources of stress experienced by
students was high academic demands. The lecture
assignments given contain complex instructions, tight
deadlines and high difficulties making students feel
pressured in their lectures.
Greenberg (2004) stated that students who enter
college will experience several problems (according
to the description above) so that it becomes a source
of stress for them.
Stress occurs when one sees an event or
circumstance is threatening, demanding, or beyond
his or her capacity to handle (Cohen et. al., 1983).
Stress is the response of individuals to taxing
circumstances and event called stressors, that threaten
them and tax their coping abilities. A number of
factors are involved in stress: physical and biological,
personality, cognitive, environmental and
sociocultural (Santrock, 2002).
Another approach to understanding stress
examines it as a broader perceived experience.
Perceived stress is one’s global evaluation of life as
being unpredictable, uncontrollable or overloaded.
Perceived stress is theoretically influenced by how
well an individual adapted to or coped with all of the
situational stress he or she has recently encountered,
as well as the number of stressors the individual has
faced (Cohen et. al., 1983).
Lazarus and Launier(1978) defined coping as the
process of managing stressors that have been
appraised as taxing or exceeding a person’s resources
254
Meutia, A., Dewi, I., Nazriani, D. and Siregar, S.
The Power of Patience: Management Stress for College Students.
DOI: 10.5220/0010017602540259
In Proceedings of the 3rd International Conference on Social and Political Development (ICOSOP 3 2019) - Social Engineering Governance for the People, Technology and Infrastructure in
Revolution Industry 4.0, pages 254-259
ISBN: 978-989-758-472-5
Copyright
c
2020 by SCITEPRESS – Science and Technology Publications, Lda. All rights reserved

and as the efforts to manage environmental and
internal demand.
Different kinds of coping resources such as
humour, acceptance, denial, disengagement, drugs,
religion, seeking emotional and instrumental social
support. Some previous research show that students
use several coping strategies in order to cope with
stress. There are several ways of classifying coping
strategies but most coping responses are considered
to Lazarus and Folkman’s problem focused or
emotion-focused coping strategies (Carver & Scheier,
1994; Lazarus &Folkman, 1984).
Emotional focused coping consists of 5 forms of
coping strategies, namely self-control, distancing,
accepting responsibility, escape-avoidance, and
positive reappraisal.One form of coping above is self
control, which is an attempt to regulate feelings when
facing a pressing situation. This definition is in line
with the concept of patience raised by Subandi
(2011), namely self control, accepting efforts to
overcome problems, enduring suffering, feeling the
bitterness of life without complaining, persistence,
working hard, persistent and tenacious to achieve a
goal. El-Hafiz, et al (2015) also argued that patience
can be interpreted as an initial response that is active
in holding back emotions, thoughts, words, actions
that obey the rules for the purpose of goodness
supported by optimism, never give up, the spirit of
seeking knowledge, have the spirit to open alternative
solutions, consistency and not easy to complain.
2 MATERIALS AND METHODS
Research conducted at Universitas Sumatera Utara.
This study is a a cross-sectional study that used a non-
experimental survey design to desribe college
students’s stress and patience profile. 347 college
student’s s from various university and faculty were
invited offline and online survey to participated in the
study.
2.1 Measurement
The Perceived Stress Scale (PSS) is is a well-
established self-report measure based on the
psychological of stress. Cohen et al. (1983) found the
PSS to provide better predictions of psychological
symptoms, physical symptoms and utilisation of
health services than other instruments which measure
specific life events (Hamarat et al., 2001). PSS-10
measure of the degree to which situation in one’s life
are appraised as stressful. Items were designed to
assess how unpredictable, uncontrollable, or
overloaded participant find their lives to be. The
responses to the 10 items were then summed to
create a psychological stress score, with
higher scores indicates greater psychological
stress. Internal reliabilities (Cronbach’s Alpha) for
the PSS-10 were .78 in the Harris Poll
sample, and .91 in both the 2006 and 2009
eNation samples. Participants answer each
question using a five –point Likert rating scale, rate
their current level of stress ranging from 0 = never, 1
= almost never, 2 = sometimes, 3 = fairly often, 4 =
very often. The PSS-10 total scores are obtained by
reversing the scores on the four positive items, then
summing across all 10 items, so that a higher total
score indicates higher stress (Hamarat et al., 2001).
The Patience Scale used in this study was
extracted based on the patience theory proposed by
Subandi (2011). The patience scale is used to
determine an individual's ability to control himself
from emotions, tolerate delays in desires, endure
difficult situations, remain persistent in achieving
goals and solve problems, be able to accept bitter
truth with sincerity and gratitude, and be able to be
calm in dealing with all situations. The patience scale
consists of 50 items using 5 forms of response ranging
from very inappropriate to very appropriate. The
measurement results using this scale are proven valid
based on the contents and internal structure of
patience measurement. Validity analysis based on
content is done by calculating the coefficient of
Aiken's V validity and validating the validity based
on internal structure with Rasch modeling. In
addition, the measurement results with this scale
indicate a very good reliability of 0.90.
2.2 Data Analysis
The data collected analyse by descriptive statistics
(SPSS).
3 RESULTS
3.1 Psychometric Characteristics
Measurement
The results of the analysis of the psychometric
characteristics of the two scales are listed in Table 1.
The analysis of psychometric characteristics
implemented in the form of reliability estimation in
which that estimation describe the psychometric
characteristics using a coefficient. The more closest
the coefficient to 1 it is mean that the more reliable
the measurement results. According to psychometry,
The Power of Patience: Management Stress for College Students
255

reliability means that the results of the psychological
scale measurement can be trusted or the score
generated from the measurement can be used for
further analysis. The PSS gets 0.809 for the reliability
coefficient, while the Patience Scale gets 0.924 for
reliability coefficient. The coefficient values of these
two scales are in the reliable category. Based on these
results, we believe that the measurement results can
be trusted to explain the research variables.
Table 1: Reliability coefficient of PSS scale and patience
scale.
No. Scale Coefficient Remarks
1 PSS 0.809 Good
reliability
2 Patience 0.924 Good
reliability
3.2 Participants
This research was conducted on a sample of students
spread across several regions in Indonesia. Most
respondents came from the city of Medan. Students
who were respondents of this study came from
various universities. Most respondents came from the
Universitas Sumatera Utara, which amounted to 229
respondents (65.99%). If viewed from the field of
science or faculty, the most respondents came from
the Faculty of Psychology 125 respondents (36.02%).
The number of respondents involved in the study
was 347 people. From the total number of
respondents, there are 228 people (66%) aged 20-40
years. Psychologically the age category of 20-40
years is classified as early adulthood. In terms of
gender, the majority of respondents were female,
totaling 267 people (77%). Meanwhile, if viewed
from the ethnic group, the majority of respondents
came from the Batak ethnic group, namely 124 people
(36%).
Table 2: Origin of the university.
No. University Frequency %
1 Universitas Sumatera
Utara (USU)
229 66
2 Universitas Negeri
Medan (UNIMED)
12 3
3 Universitas
Muhammadiyah
Sumatera Utara
(UMSU)
5 1
4 Politeknik Negeri
Medan
3 1
5 Others 98 28
Total 347 100
Table 3: Origins of faculty.
No. Faculty Frequency %
1 Psychology 125 36%
2 Public Health 31 9%
3 Nursing 4 1%
4 Social and Political Science 38 11%
5 Pharmacy 6 2%
6 Law 10 3%
7 Dentistry 1 0%
8 Engineering 12 3%
9 Economic and Bussiness 14 4%
10 Cultural Science 6 2%
11 Mathematic and Natural
Science
5 1%
12 Medical 45 13%
13 Agriculture 3 1%
14 Others 47 14%
Total 347 100%
Table 4: Age category.
No. Age Frequency %
1 18-19 80 23%
2 20-40 228 66%
3 N/A 39 11%
Total 347 100%
Table 5: Sex category.
No. Sex Frequency %
1 Male 80 23%
2 Female 267 77%
Total 347 100%
Table 6: Ethnic.
No. Ethnic Frequency %
1 Batak 124 36%
2 Jawa 89 26%
3 Melayu 30 9%
4 Aceh 17 5%
5 Minang 8 2%
6 Other ethnic 79 23%
Total 347 100%
3.3 Parametric Statistical Assumptions
Test
To test the hypothesis in the form of a simple
regression test, it is necessary to carry out the
parametric statistical assumption test. In the research
data it is known that the data distribution approaches
the normal distribution. This condition is shown by
the histogram representation of each variable, where
the most data is in the middle, while the data on the
right and left side are fewer (Figure 1).
ICOSOP 3 2019 - International Conference on Social Political Development (ICOSOP) 3
256
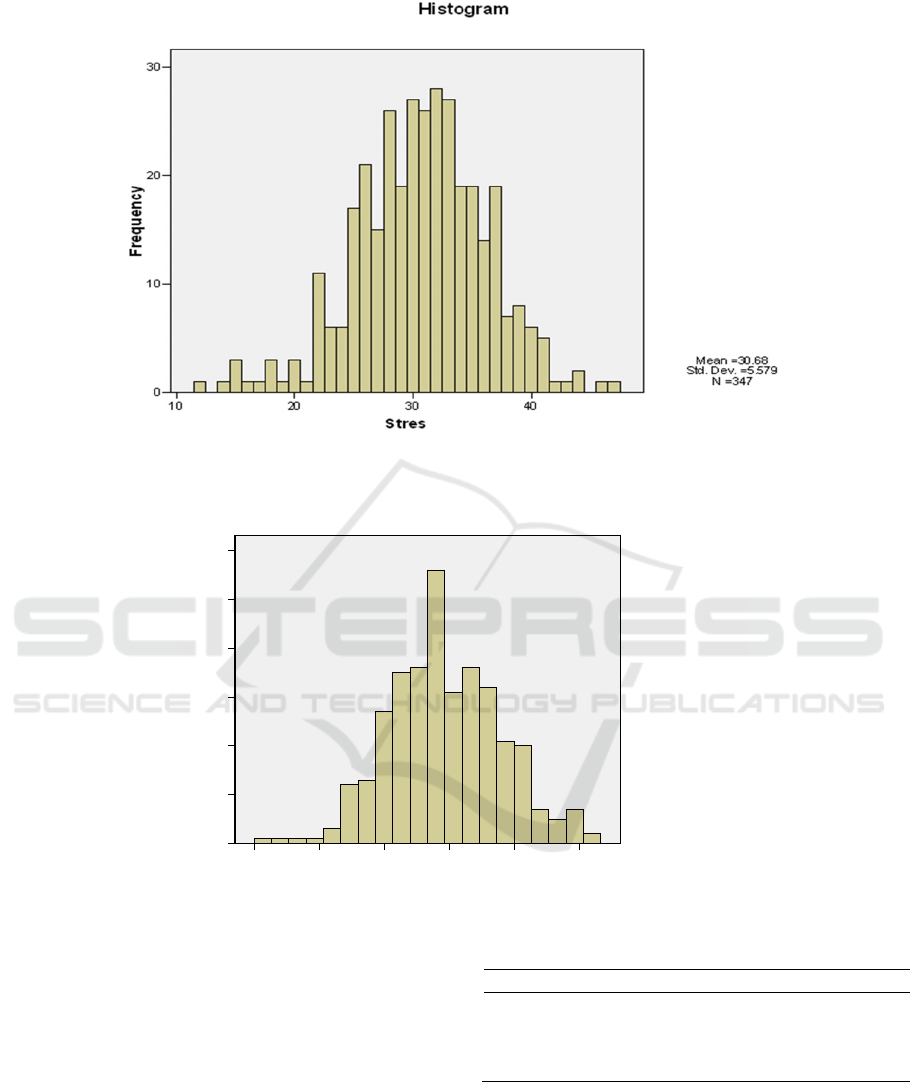
Figure 1: Distribution of research data (PSS score distribution).
Figure 2: Patient scale score distribution.
The assumption test conducted next is the
linearity assumption test. The analysis showed that
the data between variables had a linear relationship,
indicated by a significance value of linearity smaller
than 0.05 and a significance value of linearity
deviation greater than 0.05 (Table 7). Based on the
test assumptions of research data it is known that this
research data can be analyzed using parametric
statistical analysis that is simple regression analysis.
Table 7: Linearity test between variable relations.
F
Sig.
Stress *Patience Linierity 217.381 0.00
Deviation
from
Linierity
1.031 0.420
Regression statistical analysis was chosen
because this study aims to find out whether students
have a way to protect themselves from stress. In this
study the focus is on the patience variable which is
assumed to be the way for students to deal with stress.
In the field of psychology, how to deal with stress is
Kesabaran
225200175150125100
Frequency
60
50
40
30
20
10
0
Histogram
Mean =173.43
Std. Dev. =21.352
N =347
The Power of Patience: Management Stress for College Students
257

called coping stress. Coping stress has two forms,
namely problem focused coping and emotional
focused coping. This research focuses on emotional
coping stress, which one form is self-control. If
viewed from the patience variable, aspects of self-
control are part of patience. Using this research data
we hypothesize that stress experienced by students is
a predictor of the emergence of patience. Statistically
we expect that the R value obtained is in the strong
category and the model is significant.
Table 8: Regression model analysis.
Model Summary
R R
Square
F Sig.
0.620 0.385 215.
576
0.00
From the results of the analysis (Table 9) it is
known that the value of R is 0.620. This value means
that there is a strong positive relationship between
stress and patience. Furthermore it is known that the
value of R squared is 0.385 which states that stress
can contribute 38.5% of the variation in students'
patience. In other words, the respondents in this study
used coping stress in the form of patience related to
the stress they experienced. In this research, it is
known that there are about 61.5% of other variables
that cause coping stress in the form of patience among
students. The analysis also shows that the regression
model in this study is significant. This statement is
supported by a significance value that is smaller than
0.001. In conditions if students are not stressed, this
model predicts that the patience of students is equal
to 4,805. If stress increases by 1 unit, patience
increases by 0.149 (Table 9).
4 DISCUSSION
The aim of the study was to investigate the coping
strategies adopted by students in college and how
these patience affect student stress. The results of this
study have highlighted that student stress is a serious
problem in colleges across Medan at present. These
results support those of Mahmoud et al. (2012) and Ji
(2011) who also found student stress levels to be
reaching dangerously high levels. High levels of
stress has been linked to symptomatic experiences
such as headaches, hyperventilation, insomnia,
fatigue, and nervousness and may also put students at
risk of developing serious health conditions such as
depression, anxiety and, in the long run, cardio-
vascular conditions.
Table 9: Predictor coefficient analysis.
Variable Unstandardized
Coefficient
Standardized
Coefficient
t S
ig.
Partial
Correlation
Constant 4.805 2.702 0
.07
Patience 0.149 0.620 14.68
2
0
.00
0.620
5 CONCLUSIONS &
RECOMMENDATIONS
This study provides a brief snapshot of the patience
and perceived stress levels of college students in
Medan, as well as the coping mechanisms they are
utilising in order to deal with their stress. The results
of the current study suggest that there were strong
positive relationship between stress and patience.
It is recommended to increase the amount of
participant to represent the more accurate stress
profile of the college students. Further research is
needed in order to address the limitations of this
study. By doing so and introducing unaccounted for
variables such as personality types and social
demographic future research can contribute further to
our understanding student stress and life satisfaction
and how these can be affected by the use of coping
strategies.
ACKNOWLEDGEMENTS
This paper is basic research scheme funded by
Universitas Sumatera Utara “Penelitian Keunggulan
Akademik (TALENTA) USU 2019“.
ICOSOP 3 2019 - International Conference on Social Political Development (ICOSOP) 3
258

REFERENCES
Carver, C. S., & Scheier, M. F. 1994. Situational coping and
coping dispositions in a stressful transaction. Journal of
Personality and Social Psychology, 66, 184 –195.
Cohen, S., Kamarck, T., Mermelstein, R. 1983. A global
measure of perceived stress. Journal of Health and
Social Behavior : 385-396.
Cohen,S., Evans, G.W., Stokols, D. et. al. 1986. Behaviour,
health and environmental stress, Plenum. New York.
D’Zurilla, T.J.,Sheedy, C.F. 1991. Relation between social
problem solving ability and subsequent level of
psychological stress in college students. Journal of
Personality and Social Psychology, 61(5), 841-846.
El Hafiz, S., Rozi, F, Lila, P., Mundzir. I., 2013.Sabar
(patience) as new psychologicalconstruct. Presented in
10
th
Biennal Conference of Asian Associationof Social
Psychology, Yogyakarta.
Greenberg, J.I., 2004. Comprehensive stress management,
MC Graw Hill, Higher Education.New York, 8
th
edition.
Hamarat, E., Thompson, D., Zabrucky , K. M., Steel, D.,&
Matheny, K. B. 2001. Perceived stress and coping
resource availability as predictors of life satisfaction.
Experimental Aging Research: An International
Journal Devoted to the Scientific Study of the Aging
Process, 27(2), 181-196.
Ji, H., 2011. Research on college stundents' stress and
coping strategies. Asian SocialScience, 7(10).
Kholidah E.N., Alsa, A., 2012. Berpikir positif untuk
menurunkan stres psikologis. Jurnal Psikologi, 39(1),
67-75.
Lindsay, R., Reed, S., Lyons, R., Hendricks, D., Mead, A.,
Butler, K.L., 2011. Sources of stress Among Gender
and Classification for African American college
students.College Student Journal, 45(4), 749-757.
Lazarus, R.S., Folkman, S., 1984. Stress,appraisal, and
coping. New York: Springer.
Lazarus, R.S., Launier, R., 1978. Stress related transactions
between person and environment. In L. A. Pervin, & M.
Lewis (Eds.): Perspectives in International Psychology
(pp. 287-327), Plenum. New York.
Mahmoud, J., Staten, R., Hall, L.A., & Lennie, T.A., 2012.
The relationship among young adult college students'
depression, anxiety, stress, demographics, life
satisfaction, and coping styles. Issues In Mental Health
Nursing, 33(3), 149-156.
Pariat, L., Rynjah, A., & Kharjana, M.G., 2014. Stress
levels of college students: Interrelationship between
stressors and coping strategies. Journal of
Humanities and Social Science, 19(8), 40-46.
Santrock, J.W., 2002. A topical approach to life-span
development, McGraw-Hill. Boston.
Subandi, 2011, Sabar: Sebuah konsep psikologi. Jurnal
Psikologi, 38(2), 215-227. Accessed from
https://jurnal.ugm.ac.id/jpsi/article/view/7654/5934.
Towbes, L.C., & Cohen, L.H., 1996. Chronic stress in the
lives of college students: Scale development and
prospective prediction of distress. Journal of Youth and
Adolescence, 25.
The Power of Patience: Management Stress for College Students
259
