
A Comparative Study between Wild and Cultivated Varieties of
Adlay Grains for Some Engineering Properties
Raden Cecep Erwan Andriansyah, Dadang D. Hidayat, Seri Intan Kuala, Rohmah Luthfiyanti,
Diki Nanang Surahman and Ashri Indriati
Research Centre for Appropriate Technology, Indonesian Institute of Sciences Jl. KS. Tubun No. 5 Subang,
West Java, Indonesia
Keywords: Adlay Grains, Physical Properties, Mechanical Properties, Angle of Repose, Colour.
Abstract: This study was carried out to complement the database of wild and cultivated Adlay grain varieties and to
identify the similarities and differences between them. Results of the analyses determined that regarding the
polar diameter (D
p
), thickness (T), and coefficient of contact surface (C
cs
), there were not any significant
differences between wild and cultivated varieties (p>0.05); Otherwise there were significant differences on
the properties of equatorial diameter (D
e
), geometric mean diameter (D
gm
), arithmetic mean diameter (D
am
),
frontal surface area (A
fs
), transverse area A
t
), sphericity (ø), shape index I
s
), mass (M), volume (V), particle
density (ρ
p
), bulk density (ρ
b
), and porosity (ε ) (p<0.05). In term of shape, the wild variety tended to be
widened, while the cultivated variety tended to be lengthwise. Based on hardness and stickiness, the wild type
was harder and stickier than the cultivated ones. The emptying angle of repose, filling angle of repose and the
static friction of cultivated variety was relatively higher than that of the wild type. The mean total colour
difference between the wild and cultivated variety was 6.952 ± 0.011.
1 INTRODUCTION
Adlay (Coix lacryma-jobi L. ) is a broad-leaved,
branched grass, a grain-bearing tropical plant of the
family Poaceae. It is indigenous to China but also
cultivated widely in many other Asian countries such
as Philippine, Burma, Sri Lanka and Thailand
(Bender, 1999). According to the previously
published paper (LIPI, 1986), in Indonesia, there are
four varieties of Adlay, namely Agrotis, Ma-yuen,
Palustris and Aquatic which is then categorised into
wild and cultivated types. The grain size of the wild
type usually is about 1 cm in diameter with the form
of roundish, whereas that of the cultivated variety
usually exceeds 2 cm in diameter with the shape of
spheroidal (Arora, 1977). The wild type ( Coix
lacryma-jobi var. lacryma-jobi) has a hard shell,
stony, unbreakable by hand, shining and has various
colours and is often used as ornamental beads for
making rosaries necklaces, and other objects,
Whereas the cultivated types, have a soft shell,
breakable, coarse, not shining, bold and is used as
folk medicine and foodstuffs (Arora, 1977; J.A Duke,
1985).
As medicine Adlay grains are often used as an
antipyretic anodyne, anti-inflammatory, antiseptic,
antispasmodic, hypotensive, hypoglycemic, sedative
and vermifuge, antirheumatic, diuretic, pectoral,
refrigerant and tonic (J.A.Duke, 1985; Chopra, 1986).
The tea from the boiled seeds is used as part of a
treatment to cure warts (Brooklyn Botanical Garden,
1986) and is also used in the treatment of lung
abscess, lobar pneumonia, appendicitis, rheumatoid
arthritis, diarrhoea, oedema and painful urination
(H.Yeung, 1985).
As a stuffed food Adlay grains offer many
opportunities for utilisation in diversified product
such as for soups, porridge, drinks and pastries
(Waraluck, 2007), it was reported that per 100 g,
Adlay grains contain about 380 calories, 11.2 g H2O,
15.4 protein, 6.2 g fat, 65.3 g total carbohydrate, 0.8
g fibre, 1.9 gram ash, 25 mg Ca, 435 mg P, 5.0 mg
Fe, 0.28 mg thiamine, 0.19 mg riboflavin, 4.3 mg
niacin and 0 mg ascorbic acid (Kumar et.all, 2014).
Machine and equipment designing, handling,
harvesting, processing and storing of grains, requires
physical and mechanical properties. The properties of
various grains have been determined by other
researchers, such as finger millet (Ramashia et.all,
104
Andriansyah, R., Hidayat, D., Kuala, S., Luthfiyanti, R., Surahman, D. and Indriati, A.
A Comparative Study between Wild and Cultivated Varieties of Adlay Grains for Some Engineering Properties.
DOI: 10.5220/0010001000002964
In Proceedings of the 16th ASEAN Food Conference (16th AFC 2019) - Outlook and Opportunities of Food Technology and Culinary for Tourism Industry, pages 104-113
ISBN: 978-989-758-467-1
Copyright
c
2022 by SCITEPRESS – Science and Technology Publications, Lda. All rights reserved
2018), Kumquat fruits (Jaliliantabar et. all, 2013)],
Coffee fruits (Dario et. all, 2012), Russian olive
fruits (Dario et.all, 2012), tiger nut (Abano, 2011),
Almonds (Loghavi et. all, 2011), finger millet
(Swami, 2010), paddy grains (Zareiforoush, 2009),
Jatropha curcas (Shkelqim, 2008), Date fruit
(Keramat, 2008), and Sesame Seeds (Akintunde,
2004), cocoa beans (Plange and Baryeh, 2003), cumin
seeds (Singh, 1996), and karinga seeds Suthar and
Das, 1996). Concerning the Adlay grain, there is still
lacking information about the physical, mechanical
and colour properties; therefore the study aimed to
characterise the physical, mechanical and colour
properties to complement the database of two Adlay
grain varieties.
2 MATERIALS AND METHODS
The study was taken place in Research Center for
Appropriate Technology, Indonesian Institute of
Sciences, Subang- West Java. The wild type of Adlay
grains samples was taken from Cigadung village
(Latitude 6
0
33’27” S, Longitude 107
0
45’45” E, and
elevation 87 MAMSL), Subang subdistrict, Subang
district, West Java province; and the cultivated type
of Adlay grains samples were taken from Sukajadi
village (Latitude 6
0
59’26” S, Longitude
108
0
06’32”E) , Wado subdistrict, Sumedang district,
West Java province. The measurement of engineering
properties included physical, mechanical and the
colour was conducted at a moisture content of 10.74
% (wb) for wild type and 10.93 % for the cultivated
variety of Adlay grains. The instrument used to
measure the physical properties comprised of digital
vernier calliper, digital balance, analytical balance,
and baker glass. The apparatus used to measure the
mechanical properties was the TA- XT plus Texture
Analyser Stable Micro System and apparatus for
measuring friction, emptying and filling angle of
repose. The colour was observed using colourimeter
NH 310. The collected data were statistically
analysed to assess the minimum, maximum, means,
standard deviation and means were compared using
paired sample t-test.
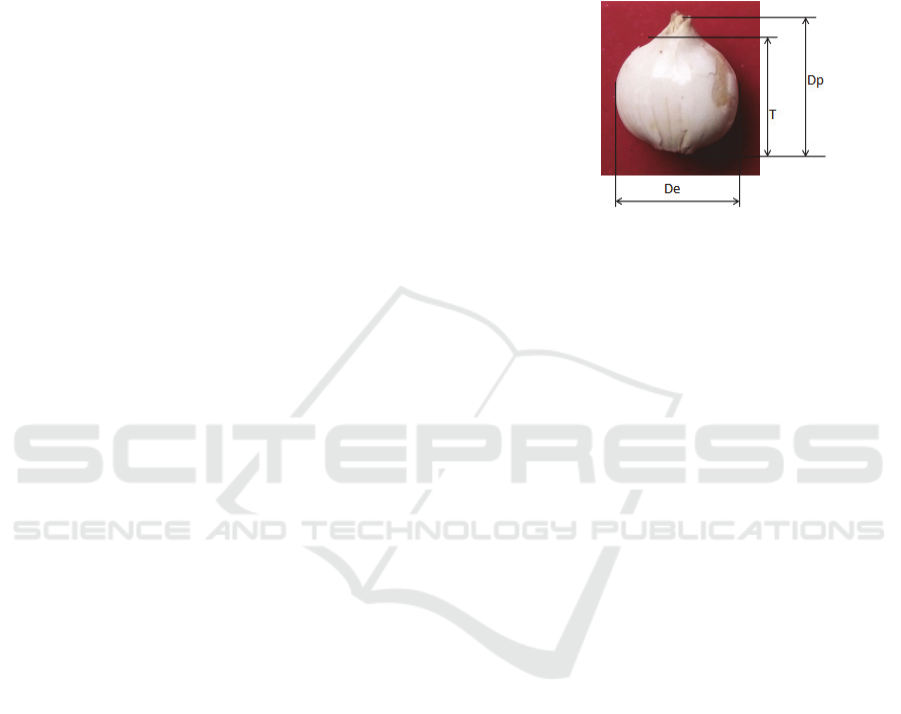
2.1 Measurement of Physical
Properties
The measurement of physical properties covered
polar diameter (D
p
), equatorial diameter (D
e
),
thickness (T), geometric mean diameter (D
gm
),
arithmetic mean diameter (D
am
), frontal surface area
(A
fc
), transverse area (A
t
), coefficient of contact
surface (C
cs
), shape index (I
s
), sphericity (ø), mass
(M), volume (V), particle density (ρ
p
), bulk density
(ρ
b
), and porosity (ε). Population number of each type
of the sample was 30, except for bulk density the
measurement was performed for ten samples. Figure
1 showed the measurement position of polar and
equatorial diameter and thickness of Adlay grains.
Figure 1: Position of Polar diameter, equatorial diameter
and thickness of Adlay grains.
Knowledge of physical characteristics which
composed of sphericity, shape index, polar diameter,
equatorial diameter, surface area, porosity and colour
are essential parameters in designing of the specific
machine and analysing the behaviour of the product
in the handling of materials. The frontal and
transverse area is used to determine the coefficient of
contact surface which is an important parameter to
evaluate the contact surface between the Adlay grain
and the other surfaces such as milling machine
surfaces (El Gendy, et .all, 2011) The grain of Adlay
is considered as an oval if the value of the shape index
is more than 1.50 and as a spherical if that less than
1.50 (El Gendy, et .all, 2011; Bahnasawy et. all, 2004
; Kaveri, 2015)
Density is required in a separation process such as
hulling, quality evaluation, and also in the
determination of thermal diffusivity in heat transfer
problems (Zareiforoush, 2009). The geometric mean
diameter, arithmetic mean diameter, frontal surface
area, transverse area, cross-sectional area, shape
index, sphericity, porosity, volume, particle density
and bulk density were derived by using the following
equations given by Mohsenin (Ramashia et.all, 2018)
and had been used by other researchers (El Gendy, et.
all, 2011; Bahnasawy et. all, 2004 ; Kaveri, 2015;
Mohsenin et.all, 1986; Ismail et. all, 2014; Marioti et.
all, 2006).
A Comparative Study between Wild and Cultivated Varieties of Adlay Grains for Some Engineering Properties
105
2.2 Measurement of Mechanical
Properties
The properties of mechanical measured consisted of
hardness, stickiness, emptying angle of repose, filling
angle of repose and friction. The number of each
samples type was 5 for hardness and stickiness, 10 for
filling angle of repose, emptying angle of repose and
static friction, and 3 for colour analyses. The hardness
and stickiness were measured using TA- XT plus
Texture Analyser Stable Micro System. The hardness
is an essential parameter in designing milling
machine (Jesukristina et. all, 2015).
The angle of repose is an essential parameter in
predicting flow characteristics, for inventorying grain
and designing bins and grain handling systems
(Zareiforoush, 2009; Bhadra,,2016; Tarighi, 2011;
Hamzah, 2018). There are to types of the angle of
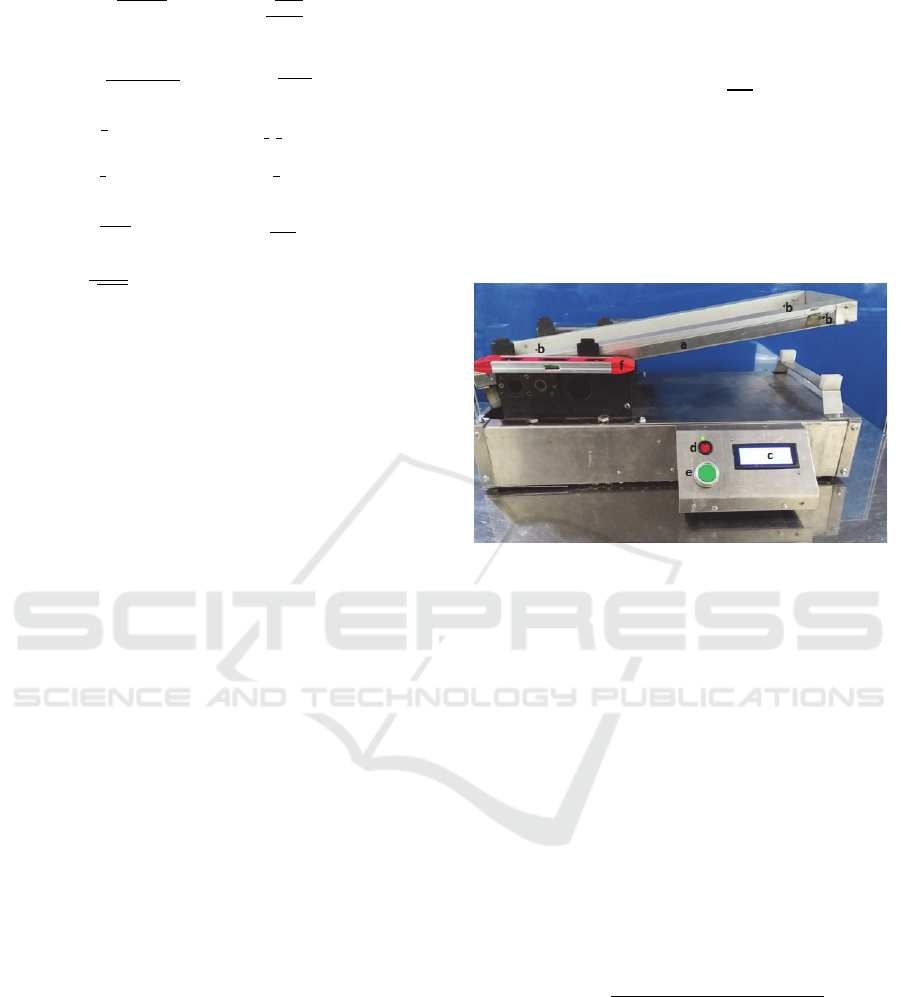
repose, i.e. emptying and filling. The emptying angle
of repose was measured using an electrically inclined
plane supported by the sensor; Figure 2 showed the
apparatus for measuring the emptying angle of
repose. The emptying angle of repose and static
friction coefficients were determined to four surfaces,
i.e., stainless steel, aluminium, acrylic and plywood.
The static friction (μ) was calculated by using the
following equation (Zareiforoush, 2009; Plange,
et.all, 2003; Singh, 1996)
μ = tan θ
e
The filling angle of repose was determined by
using a PVC of 100 mm diameter and 100 mm height.
The PVC cylinder was placed on four types of
surfaces, i.e. stainless steel, aluminium, acrylic and
plywood; the filled PVC was raised until it formed the
cone and the mean diameter (D) and height of pile (H)
were recorded to calculate the filling angle of repose.
The following formula was employed to determine
the filling angle of repose (Zareiforoush, 2009,
Tarighi, 2011; Hamzah, 2018).
𝜃
tan
2𝐻
𝐷
Where:
θe: Emptying angle of repose
θf: Emptying angle of repose
H: Height of cone
D: Diameter of the cone
μs: Static Friction
Figure 2: The angle of repose measuring instrument.
(a: Adjustable Plane, b: Sensor 4 units; c: Display;
d: ON/OFF Button; e: Start button, f: Water level).
2.3 Colour
The colour of wild and cultivated Adlay grains
samples was determined using a colourimeter NH
310. The analysis methods used were CIE
(Commission Internationale de L'Eclairage) L* a* b*
and CIE L* c* h* coordinates (Ruiz et.all, 2012) The
value of L*, a* b* and L* c* h*obtained was used to
determine the total colour difference between each
group of samples; the measurements were performed
on three-grain samples which randomly taken from
each type of Adlay grains samples. The entire colour
difference was calculated using the following
equation (Ruiz et.all, 2012; Pathare et.all, 2013)
ΔE*
A-B
=
ΔL
∗
Δa
∗
Δb
∗
The colour of the sample principally can be
described using three specific qualities of visual
sensation, i.e. tonality, luminosity, and chromatism.
Tonality (h*) is the characteristics of the colour, i.e.
red, yellow, green, and blue. The clarity is the
attribute of the visual sensation according to the
appearance of the sample whether less or more
luminous. The chromatism (c*) is the level of colour
D
gm
D
e
D
p
T
3
D
am
D
e
D
p
T
3
A
fs
π
4
D
e
D
p
A
t
π
4
T D
e
C
cs
𝐴
𝑓𝑠
𝐴
𝑡
𝐴
𝑓𝑠
x 100
I
s
D
e
D
p
T
2
Ø
D
e
D
p
T
3
D
e
ε
𝝆
𝑝
𝝆
𝑏
𝜌
𝑝
100 %
V =
1
4
[
𝜋
6
D
p
(D
e
+t)
2
]
ρ
p
M
v
ρ
b
M
v50 0
V
500
16th AFC 2019 - ASEAN Food Conference
106
related to a lower or higher intensity of the colour.
Coordinate L* represents the clarity, in which L=0 is
black, and L*= 100 is colourless. Coordinate a*
represents the shade of red and green, in which a*> 0
indicates red colour and a*< 0 indicates green colour.
Coordinate b* represents the tone of blue and yellow,
in which b*> 0 shows the intensity of yellow and b*<
0 means the hue of blue. The total colour difference
(ΔE*) is the difference between the two colours of the
samples
3 RESULTS AND DISCCUSSION
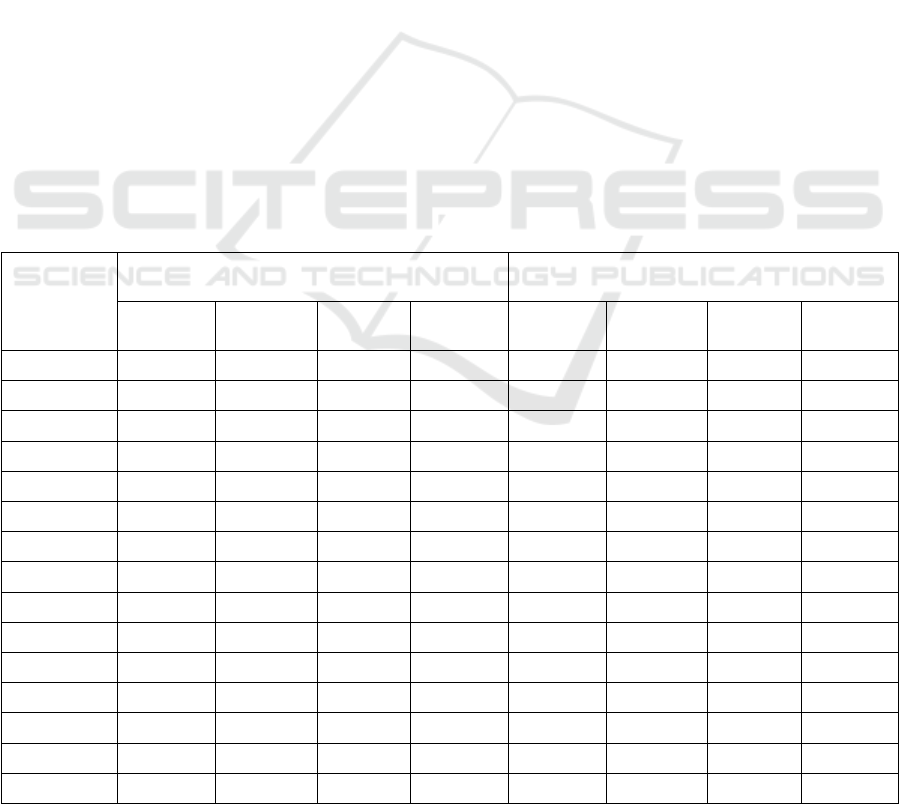
Table 1 showed the minimum, maximum, average
and standard deviation of wild and cultivated varieties
of Adlay grains. The polar diameter of wild and
cultivated varieties ranged from 9.40 ± 0.35 mm and
9.42 ± 1.67 mm respectively and the equatorial
diameter of those ranged from 8.32 ± 0.30 and 7.02 ±
0.38 mm respectively; it meant that the shape of wild
Adlay variety tended to be widened, whereas that of
cultivated ones tended to be lengthwise. The density
of wild type was more significant than that of
cultivated ones; these results were found to be in close
agreement with the past researchers (Jesukristina et.
all, 2015; Gruben and Partohardjono, 1996; Agripina
et.all. 2018). The porosity associated inversely with
the sphericity; the higher the sphericity, the smaller
the porosity.
In term of polar diameter (D
p
), thickness (T), and
coefficient of contact surface (C
cs
), table 2 showed
that results of paired sample t-test analysis
determined that there were not any significant
differences between wild and cultivated varieties
(p>0.05); Otherwise there were significant
differences on the properties of equatorial diameter
(D
e
), geometric mean diameter (D
gm
), arithmetic
mean diameter (D
am
), frontal surface area (A
fs
),
transverse area At), sphericity (ø), shape index I
s
),
mass (M), volume (V), particle density (ρ
p
), bulk
density (ρ
b
), and porosity (ε ) (p<0.05).
Table 2 showed the hardness and stickiness of
wild and cultivated varieties of Adlay grain. Results
of measurement indicated that the hardness of wild
type was relatively stronger than that of cultivated
ones, as well as for stickiness. The average hardness
of wild variety was about eight times compared to that
of cultivated ones; it meant that the wild type was
stony, in the other hand the cultivated variety was
breakable. This result was found under that of the
earlier researchers (Jesukristina, 2015); Grubben and
Partohardjono, 1996).
Table 1: Physical properties of wild and cultivated varieties of Adlay grain.
Physical
Properties
WILD CULTIVATED
Minimum Maximum Mean
Std.
Deviation
Minimum Maximum Mean
Std.
Deviation
D
p
8.71 10.14 9.40 0.35 7.51 17.30 9.42 1.67
D
e
7.59 8.85 8.32 0.30 6.12 7.88 7.02 0.38
T
6.05 8.71 10.14 0.41 6.02 8.38 7.18 0.53
D
gm
7.76 7.59 8.85 0.25 6.81 8.97 7.77 0.48
D
am
7.82 8.83 8.32 0.25 6.87 10.08 7.87 0.61
A
fs
54.93 68.48 61.41 3.37 39.39 94.11 51.95 9.73
A
t
38.85 55.37 47.34 3.75 30.30 48.68 39.60 4.19
C
cs
12.06 35.84 22.87 5.09 12.25 65.20 22.35 9.40
ø
0.82 0.95 0.88 0.03 1.01 1.29 1.11 0.06
I
s
0.81 0.97 0.89 0.04 0.40 0.90 0.76 0.09
M
0.24 0.38 0.33 0.04 0.08 0.12 0.10 0.01
V
0.26 0.37 0.32 0.03 0.17 0.38 0.25 0.05
ρ
p
0.86 1.23 1.03 0.10 0.30 0.58 0.42 0.08
ρ
b
0.53 0.61 0.58 0.02 0.20 0.31 0.29 0.03
ε
33.70 49.79 42.21 5.99 19.60 46.74 33.82 9.06
A Comparative Study between Wild and Cultivated Varieties of Adlay Grains for Some Engineering Properties
107
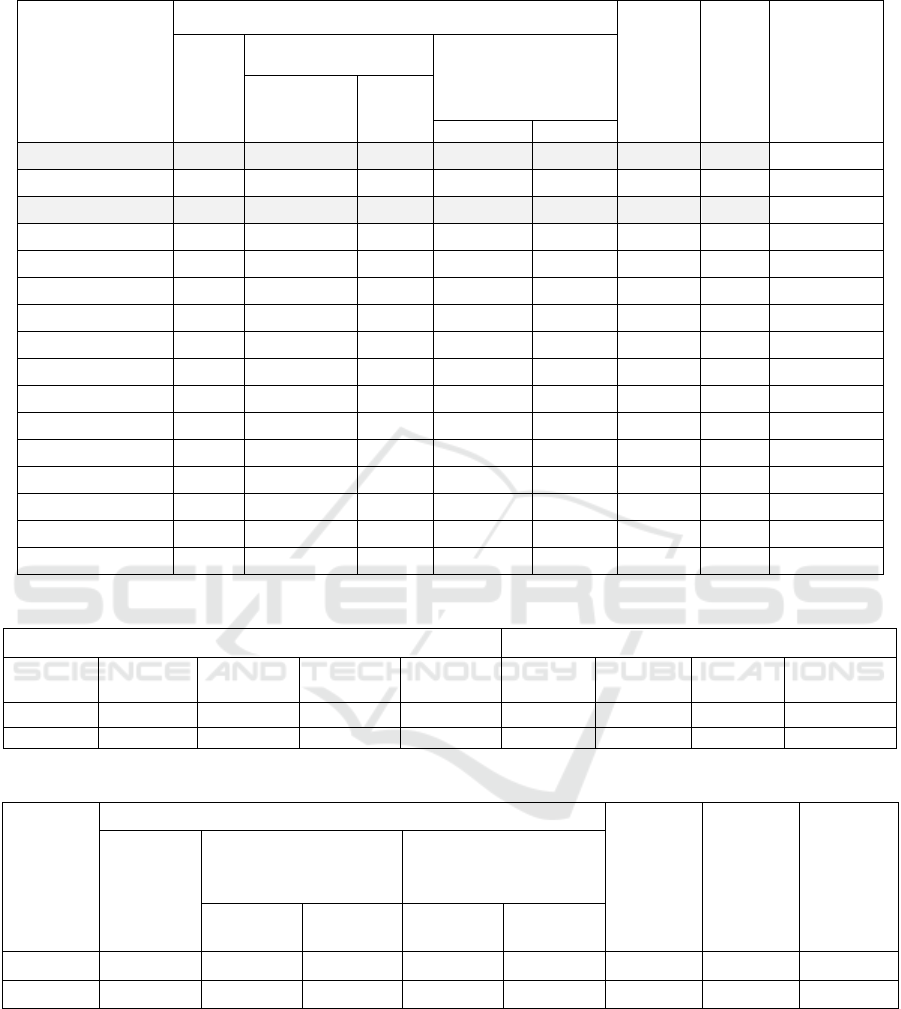
Table 2: Physical properties comparison between wild and cultivated of Adlay grains.
Pairs
Paired Differences
t df
Sig
(2-tailed)
Mean
Standard
95% Confidence
Interval of the
Difference
Deviation
Error
Mean
Lowe
r
U
pp
e
r
D
pw
- D
pc
-0.02 1.66 0.30 -0.64 0.60
-0.08 29.00 0.94
D
ew
- D
ec
1.31 0.41 0.07 1.15 1.46
17.44 29.00 0.00
t
w
- t
c
0.06 0.72 0.13 -0.21 0.33
0.46 29.00 0.65
D
gmw
- D
gmc
0.50 0.49 0.09 0.31 0.68
5.59 29.00 0.00
D
amw
- D
amc
0.45 0.60 0.11 0.22 0.67
4.11 29.00 0.00
A
sw
- A
sc
24.41 24.04 4.39 15.43 33.39
5.56 29.00 0.00
A
fsw
- A
fsc
9.47 9.26 1.69 6.01 12.92
5.60 29.00 0.00
A
tw
-A
tc
7.75 5.55 1.01 5.67 9.82 7.64 29.00 0.00
C
scw
-C
scc
0.52 11.38 2.08 -3.73 4.77 0.25 29.00 0.80
ø
w
- ø
c
-0.23 0.07 0.01 -0.25 -0.20
-17.85 29.00 0.00
I
sw
- I
sc
0.13 0.10 0.02 0.09 0.17
6.76 29.00 0.00
M
w
- M
c
0.23 0.04 0.01 0.21 0.24
33.84 29.00 0.00
V
w
- V
c
0.07 0.05 0.01 0.05 0.09
7.75 29.00 0.00
ρ
pw
- ρ
pc
0.62 0.13 0.02 0.57 0.67
25.87 29.00 0.00
ρ
bw -
ρ
bc
0.29 0.04 0.01 0.27 0.32
23.37 9.00 0.00
ε
w
- ε
c
0.08 0.11 0.04 0.00 0.16
2.32 9.00 0.05
Table 3: Hardness and stickiness of wild and cultivated varieties of Adlay grain.
WILD CULTIVATED
TA-
Profile
Minimum Maximum Mean
Std.
Deviation
Minimum Maximum Mean
Std.
Deviation
Hardness 28466.73 40546.65 35584.70 4966.19 3544.07 5049.88 4426.05 614.97
Stickiness -5.40 -3.64 -4.5300 0.63 -1.29 -0.94 -1.15 0.13
Table 4: Hardness and stickiness comparison between wild and cultivated varieties of Adlay grain.
Pairs
Paired Differences
t df
Sig
(2-tailed)
Mean
Standard
95% Confidence
Interval of the
Difference
Deviation
Error
Mean
Lower Upper
H
w
-H
cul
31158.65 4594.85 2054.88 25453.38 36863.91 15.16 4.00 0.00
S
w
-S
cul
-3.38 0.75 0.34 -4.31 -2.44 -10.03 4.00 0.00
Results of paired sample t-test analysis which
could be seen in table 4, determined that there were
significant differences of hardness and stickiness
between wild and cultivated varieties (p<0.05).
Table 5 showed the emptying angle of repose on
a different type of surfaces. The highest angle of
repose occurred on the surface of plywood;
otherwise, the smallest of that happened on the
aluminium surface.
Results of paired sample t-test analysis, which
could be seen in table 6, showed that there were not
any significant differences of emptying angle of
repose on aluminium and acrylic surfaces of wild and
cultivated
varieties (p>0.05); otherwise, there was
16th AFC 2019 - ASEAN Food Conference
108
Table 5: The emptying angle of repose of wild and cultivated varieties of Adlay grains on a different type of surfaces.
WILD CULTIVATED
Minimum Maximum Mean
Std.
Deviation
Minimum Maximum Mean
Std.
Deviation
θ
eSS
28,10 34,02 31,56 1,94 29,60 35,52 33,06 1,94
θ
eAL
28,10 38,28 31,42 2,84 28,89 37,18 34,12 2,77
θ
eACRY
29,28 36,86 32,62 1,99 29,13 39,31 33,96 2,84
θ
ePLYWD
32,13 39,23 35,80 2,26 35,52 50,91 41,17 4,01
Table 6: The emptying angle of repose comparisons between wild and cultivated of Adlay grains on the surface of aluminium,
acrylic and plywood.
Paired Differences
Pairs Mean
Standard
95% Confidence
Interval of the
Difference
t df
Sig
(2-tailed)
Deviation
Error
Mean
Lower Upper
θ
eALW
- θ
eALCUL
-2.70 4.35 1.37 -5.82 0.41 -1.97 9.00 0.08
θ
eACRYW
- θ
Eacryw CUL
-1.33 3.56 1.13 -3.88 1.22 -1.18 9.00 0.27
θ
ePLYWDW
- θ
ePLYWD
CUL
-5.37 4.00 1.26 -8.23 -2.51 -4.25 9.00 0.00
Table 7: The emptying angle of repose comparisons between wild and cultivated of Adlay grains on the surface of stainless
steel.
Chi-Square df Asymp. Sig.
θ
eSS
W
- θ
eSS
CUL
0.800 8 0.999
Table 8: Filling angle of repose of wild and cultivated varieties of Adlay grains on a different type of surfaces.
WILD CULTIVATED
Minimum Maximum Mean
Std.
Deviation
Minimum Maximum Mean
Std.
Deviation
θ
fSS
68.29 73.38 70.88 1.52 73.06 77.83 75.75 1.37
θ
fAL
65.51 72.80 70.53 2.35 74.22 78.83 76.40 1.56
θ
fACRY
70.76 74.76 73.06 1.35 75.30 79.41 76.90 1.43
θ
fPLYWD
68.50 73.55 71.79 1.63 75.77 79.00 77.71 0.89
a considerable difference of that on the surface of
plywood (p<0.05).
Results of Chi-square analysis of emptying angle
of repose on the stainless steel surface for wild and
cultivated varieties as could be seen in table 7, did not
show any significant difference (p>0.05).
Table 8 showed that the highest a filling angle of
repose occurred on the surface of plywood;
otherwise, the smallest of that happened on the
surface stainless steel.
The result of paired sample t-test as shown in Table
9 indicated that there were significant differences
A Comparative Study between Wild and Cultivated Varieties of Adlay Grains for Some Engineering Properties
109
Table 9: Filling angle of repose comparisons between wild and cultivated of Adlay grains.
Pairs
Paired Differences
t df
Sig
(2-tailed)
Mean
Standard
95% Confidence
Interval of the
Difference
Deviation
Error
Mean
Lower Upper
θ
fSS W
- θ
fSS CUL
-5.87 2.89 0.91 -7.94 -3.80 -6.43 9.00 0.00
θ
fal W
– θ
fal CUL
-4.87 2.23 0.71 -6.46 -3.27 -6.90 9.00 0.00
θ
facry W –
θ
facry CUL
-5.92 1.16 0.37 -6.75 -5.09 -16.14 9.00 0.00
θ
fplywd W
– θ
fplywd CUL
-3.84 1.80 0.57 -5.13 -2.55 -6.72 9.00 0.00
Table 10: The friction of wild and cultivated varieties of Adlay grains on a different type of surfaces.
WILD CULTIVATED
Minimum Maximum Mean
Std.
Deviation
Minimum Maximum Mean
Std.
Deviation
μ
SS
0.53 0.68 0.62 0.05 0.57 0.71 0.66 0.05
μ
AL
0.53 0.79 0.61 0.07 0.55 0.76 0.69 0.07
μ
ACRY
0.56 0.75 0.64 0.05 0.56 0.82 0.66 0.08
μ
PLYW
0.63 0.82 0.72 0.06 0.71 0.91 0.83 0.05
Table 11: Friction comparisons between wild and cultivated of Adlay grains.
Pairs
Paired Differences
t df
Sig
(2-tailed)
Mean
Standard
95% Confidence
Interval of the
Difference
Deviation
Error
Mean
Lower Upper
μ
SSW
-
μ
SS CUL
-0.04 0.03 0.01 -0.06 -0.02 -4.00 9.00 0.00
μ
ALW
-
μ
AL CUL
-0.07 0.11 0.04 -0.15 0.01 -2.02 9.00 0.07
μ
ACRYW
-
μ
ACRY CUL
-0.02 0.10 0.03 -0.09 0.05 -0.72 9.00 0.49
μ
PLYWW
-
μ
PLYW CUL
-0.11 0.07 0.02 -0.16 -0.06 -4.83 9.00 0.00
between one surface and the others (p<0.05).
Comparisons between emptying and filling angle
of repose on different surfaces, it was found that the
filling angle of repose had a higher value than the
emptying angle of repose.
Table 10 showed the static friction of wild and
cultivated varieties of Adlay grains. As it was
presented in the table, the highest static friction
occurred in the surface of plywood, for both wild and
cultivated varieties; Otherwise, the lowest of that
happened in aluminium surface for wild type, and on
the acrylic surface for cultivated ones.
Result of paired sample t-test as shown in table 11
pointed out that there were significant differences
between wild and cultivated varieties in static friction
on the surfaces of stainless steel and plywood
(p<0.05), on the other hand, there were not any
significant differences of that on the surfaces of
aluminium and acrylic (p>0.05).
16th AFC 2019 - ASEAN Food Conference
110
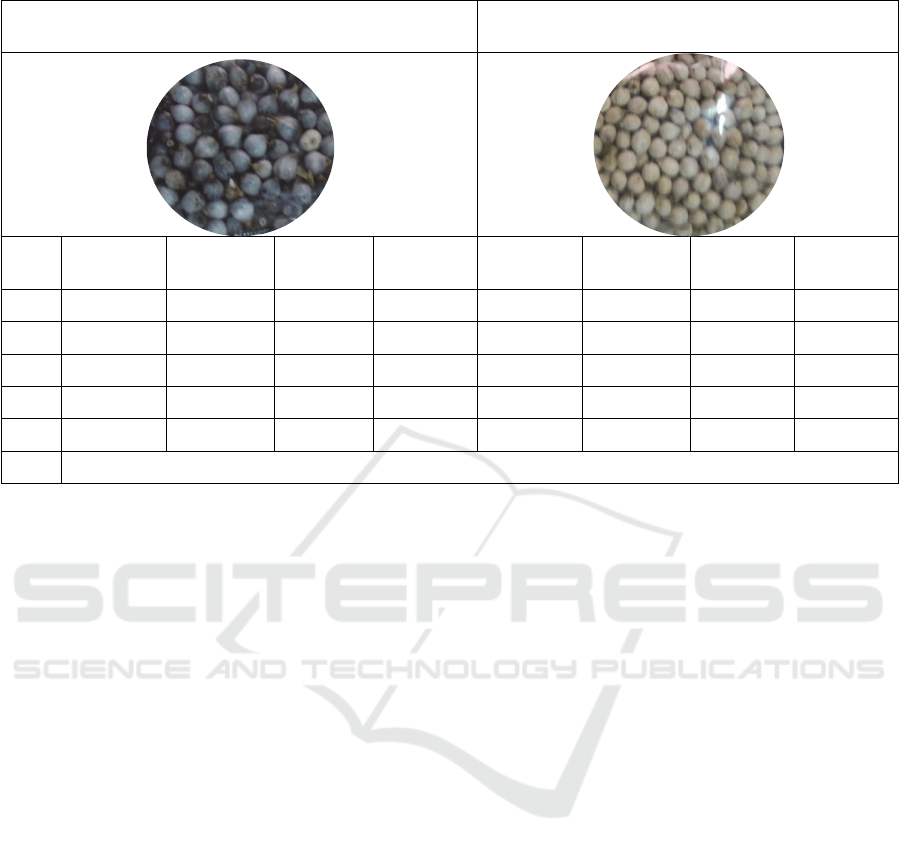
Table 12: Colour of Wild and Cultivated Varieties of Adlay Grains.
WILD CULTIVATED
Minimum Maximum Mean
Std.
Deviation
Minimum Maximum Mean
Std.
Deviation
L* 39.769 39.777 39.773 0.004 41.950 41.953 41.951 0.002
a* 0.015 0.041 0.030 0.013 3.024 3.055 3.037 0.016
b* 0.866 0.894 0.881 0.014 6.749 6.769 6.758 0.010
c* 0.867 0.895 0.882 0.014 7.399 7.414 7.409 0.009
h* 0.000 0.001 0.000 0.000 0.001 0.002 0.001 0.001
ΔE* 6.952 ± 0.011
Visually a wild Adlay was shiny and had a various
colour, i.e. grey, yellow-brownish, purplish and
blackish, while the cultivated one was not shiny and
had a uniform colour of white-brownish. These
findings were relatively under that of the previous
study (Grubben and Partohardjono, 1996). The
geometrical CIE L*a*b*c*h* coordinates of wild
and cultivated Adlay grains were (39.773±0.004;
0.030±0.013; 0.881±0.014; 0.882±0.014;
0.000±0.000) and (41.951±0.002; 3.037±0.016;
6.758±0.010; 7.409±0.009; 0.001±0.001)
respectively. Results of the calculation determined
that the total colour difference between wild and
cultivated variety (ΔE*w-cul) was 6.952±0.011.
4 CONCLUSION
Results of the study found that the polar diameter,
equatorial diameter and thickness of wild Adlay grain
varieties were 9.40 ± 0.35 mm, 8.32 ± 0.30 mm and
7.24 ± 0.41 mm respectively, and those for cultivated
variety were 9.42 ± 1.67 mm, 7.02 ± 0.38 mm, and
7.18 ± 0.53 mm respectively.
There was not any significant difference in the
polar diameter, thickness and coefficient of contact
surface between wild and cultivated varieties of
Adlay grains; otherwise there were significant
differences in equatorial diameter, geometric mean
diameter, arithmetic mean diameter, frontal surface
area, transverse area, sphericity, shape index, mass,
volume, particle density, bulk density and porosity.
The shape of wild Adlay tended to be widened,
whereas that of cultivated ones tended tobe
lengthwise. The particle density, bulk density and
porosity of wild Adlay were bigger than that of
cultivated ones. The particle density, bulk density
and porosity of wild Adlay were 1.03 ± 0.10 gr/cm3,
0.58 ± 0.022 gr/cm3, and 42.21 ± 5.99 %
respectively, and those of cultivated ones were 0.42 ±
0.08 gr/cm3, 0.29 ± 0.03 gr/cm3, and 33.82 ± 9.06 %
respectively.
Concerning the texture profile, the wild Adlay
grain was harder and stickier than the cultivated ones.
The hardness and stickiness for wild Adlay grain
were 35 584.70 ± 4 966.19 g-force and -4.53 ± 0.63
g-forces respectively and those for cultivated ones
were 4 426.05 ± 614 ± 614.97 g-force and -1.15 ±
0.13 g-force respectively. The emptying angle of
repose, filling angle of repose and static friction of
wild Adlay grain was smaller than that of cultivated
ones.
The geometrical CIE L*a*b*c*h* coordinates of
wild and cultivated Adlay grains were
(39.773±0.004; 0.030±0.013; 0.881±0.014;
0.882±0.014; 0.000±0.000) and (41.951±0.002;
3.037±0.016; 6.758±0.010; 7.409±0.009;
0.001±0.001) respectively, and the total colour
different of them was 6.952±0.011.
A Comparative Study between Wild and Cultivated Varieties of Adlay Grains for Some Engineering Properties
111

ACKNOWLEDGMENTS
The authors would like to acknowledge the Research
Centre for Appropriate Technology which provided
facilities in carrying out this study. We would also
like to thank everyone who provided us with
assistance throughout our works. We want to thank
Dadang Gandara, Iman Rusim, Sutrisno, Sukwati,
Neneng K. and S. Khudaifanny for their help in
carrying out this study.
REFERENCES
Agripina R., Aradilla. Phenology, Growth and Yield
Performance of Adlay (Coix lacryma-jobi L.) Grown in
Adverse Climatic Conditions. International Journal of
Research & Review. 2018; 5 (3).
Arora, R. K. Job's-tears (Coix lacryma.jobi) a Minor Food
and Fodder Crop of Northeastern India. ECONOMIC
BOTANY. 1977;31: 358—366.
Bahnasawy A H. Z A El-Haddad. M Y El-Ansary and H M
Sorour. Physical and mechanical properties of some
Egyptian onion cultivars. J. of Food Eng. 2004;62: 255-
261.
Bart-Plange A. and Edward A. Baryeh. The physical
properties of Category B cocoa beans. Journal of Food
Engineering. 2003;60: 219–227.
Bender, D.A., and Bender A.E. Benders’ Dictionary of
Nutrition and Food Technology. Woodhead Publishing,
Abington 1999.
Bhadra, Rumela & Bhadra, R & E. Casada, M &
Thompson, Sidney & Boac, Josephine & Maghirang,
Ronaldo & Montross, Michael & Mcneill, Samuel &
Turner, Aaron. Technical Note: Field-Observed Angles
Of Repose For Stored Grain In The U.S. Applied
Engineering in Agriculture. 2016;33(1): 131-137 2017
American Society of Agricultural and Biological
Engineers ISSN 0883-8542 DOI 10.13031/aea.11894.
Brooklyn Botanic Garden, “Oriental herbs and vegetables”,
1986;39 (2), New York.
Chopra, R. N., S. L. Nayar, and I. C. Chopra, “Glossary of
Indian medicinal plants” (including the supplement),
Council of Scientific and Industrial Research, New
Delhi. 1986.
E.E. Abano and K.K. Amoah, Effect of Moisture Content
on the Physical Properties of Tiger Nut (Cyperus
esculentus). Asian Journal of Agricultural Research.
2011;5:56-66.
DOI: 10.3923/ajar.2011.56.66.URL: https://scialert.net
/abstract/?doi=ajar.2011.56.66
El- Gendy H. A., A. I. Elrayes and SH. F. Abdel-Hammed.
Engineering Properties Of Some Arabian Coffee
Varieties. Egypt. J. Agric. Res., 2011;89 (2), 2011 615.
Engineering Research. 64: 93-98
FAO. Coix lacryma-jobi L. Grassland Species Profiles.
FAO/CIAT Collaboration on Tropical Forages.
http://www.fao.org/ag/AGP/AGPC/doc/Gbase/DATA/
PF000205.HTM.
Grubben, G.J.H. & Soetjipto Partohardjono (Editors). Plant
Resources of South-East Asia No 10. Cereals.
Backhuys Publishers, Leiden. 1996. 199 pp.
H. Yeung, “Handbook of Chinese herbs and formulas”,
Institute of Chinese Medicine, Los Angeles. 1985.
H. Zareiforoush, M.H. Komarizadeh and M.R. Alizadeh.
Effect of Moisture Content on Some Physical
Properties of Paddy Grains. Research Journal of
Applied Sciences, Engineering and Technology.
2009;1(3): 132-139, ISSN: 2040-7467.
Hamzah M. Beakawi Al-Hashemi, Omar S. Baghabra Al-
Amoudi. A review on the angle of repose of granular
materials. Powder Technology. 2018;30: 397–417.
Ismail, L., Anuar, M.S., Shamsudin, R. Physical properties
of liberica coffee (Coffea liberica) berries and beans.
Pertanika J Sci Technol. 2014;22: 65–79.
Iván Darío. I.A.T. José Jaime. C.H. Carlos. E.O.T. Physical
And Mechanical Properties Correlation Of Coffee Fruit
(Coffea Arabica) During Its Ripening. Dyna.
2012.;79(172):148-55.
J. A. Duke and E. S. Ayensu, “Medicinal plants of China”,
Reference Publications, Michigan, 1985.
Jaliliantabar. F. Ali N. L. R. GholamiPhysical properties of
kumquat fruit. International Agrophysics. 2013. DOI:
10.2478/v10247-012-0074-y.
Karaj. Shkelqim*. Huaitalla. Roxana Mendoza. Müller.
Joach. Physical, mechanical and chemical properties of
Jatropha curcas. Open tag Stuttgart-Hohenheim.
Conference on International Agricultural Research for
Development. 2008.
Kaveri. G and Thirupathi. V. Studies On Geometrical And
Physical Properties Of Co 4 Onion Bulb (Allium Cepa
Lvar. Aggregatum Don.). International Journal of
Recent Scientific Research. . 2015;6(3): 2897.
Keramat JM. Rafiee S. Jafari A. Ghasemi Bousejin MR.
Mirasheh R. Mohtasebi SS. Some physical properties
of date fruit (cv.Dairi). Int Agrophys. 2008;22:221–224.
Kumar, R., N. Kumawat and U.N. Shukla. Job's tears: An
unexploited multipurpose shrub in North Eastern hilly
region of India. Popular Kheti, 2014;2: 118
LIPI. Low Land Grass Types. Research Centre for Biology.
Indonesian Institute of Sciences, Bogor. 1986.
Loghavi M. Souri S. Khorsandi F. Physical and mechanical
properties of Almond (Prunus dulcis l. cv. 7
Shahrood).Annual International Meeting. Shiraz.
Iran.ASABE. 2011.
Ma Jesukristina C. M. Design and Development of Milling
Machine for the Production of Adlai (Coix lacryma jobi
L) Grains. Asia Pacific Journal of Multidisciplinary
Research. 2015;3(4): 93-99. P-ISSN 2350-7756 E-
ISSN 2350-8442.
Mariotti, M., C. Alamprese, M.A. Pagani, M. Lucisano.
Effect of puffing on ultrastructure and physical
characteristics of cereal grains and flours. Journal of
Cereal Science. 2006;43: 47–56.
Mohsenin, N.N. Physical properties of plant and animal
materials. Gordon and Breach Updated Edition. 1986.
16th AFC 2019 - ASEAN Food Conference
112

Pankaj B. Pathare, Umezuruike Linus Opara, Fahad Al-
Julanda Al-Said. Colour Measurement and Analysis in
Fresh and Processed Foods: A Review. Food
Bioprocess Technol. 2013;6:36–60. DOI
10.1007/s11947-012-0867-9.
Ramashia, S.E., E.T. Gwata, S. Meddows-Taylor, T.A.
Anyasi, A.I.O. Jideani. Some physical and functional
properties of finger millet (Eleusine coracana) obtained
in sub-Saharan Africa. Food Research International.
2018;104: 110–118.
Ruiz. F. Agell. N. Angulo. C. Sanchez. M. A qualitative
learning system for human sensory abilities in
adjustment tasks. 2012.
S.S. SWAMI AND S.B. SWAMI. Physical properties of
finger millet (Eleusine coracana). International
Journal of Agricultural Engineering. 2010; 3(1): 156-
160.
Singh. K. K. and Goswami. T. K. Physical properties of
cumin seed. Journal of Agricultural. 1996.
Singh. K. K. and Goswami. T. K. Physical properties of
cumin seed. Journal of Agricultural. 1996.
Suthar. S. H. and Das. S. K. Some physical properties of
karinga seeds. Journal of Agricultural Engineering
Research. 1996;65:15-22.
Tarighi, J., Asghar Mahmoudi, and Naser Alavi. Some
mechanical and physical properties of corn seed (Var.
DCC 370). African Journal of Agricultural Research.
2011; 6(16): 3691-3699. DOI: 10.5897/AJAR10.521.
ISSN 1991-637X.
Tunde-Akintunde. T.Y. and Akintunde. B.O. 2004. Some
Physical Properties of Sesame Seed. Biosystems
Engineering. 88. 127-129.
Waraluck, K., W. Wangcharoen, S. Pimpilai and W. Daeng.
Preference direction study of Job’s-tears ice cream.
Maejo International Journal of Science and
Technology. 2007:01(2):137-144. ISSN 1905-7873.
Zare. D. Salmanizade. F., H. Safiyari. Some Physical and
mechanical properties of Russian olive fruit. World
Academy of Science. Engineering and Technology.
International Journal and Bological, Biomolecular,
Agricultural, Food and Biotechnological Engineering.
2012;6(9):668-671.
A Comparative Study between Wild and Cultivated Varieties of Adlay Grains for Some Engineering Properties
113
