
Support Vector Machine for Classifying the Quality of the Egg
based on the Color
Maimunah
1
, Rahmadya Trias Handayanto
1
and Taufiqur Rokhman
2
1
Department of Computer Engineering, Universitas Islam 45, Jl. Cut Meutia 83, Bekasi, Indonesia
2
Department of Mechanical Engineering, Universitas Islam 45, Jl. Cut Meutia 83, Bekasi, Indonesia
Keywords: Eggshell, color intensity, support vector machine
Abstract: Egg quality is an indicator to determine the freshness of an egg. One of a method to determine the egg quality
is through an analysis of eggshell condition. Color intensity of the eggshell comprises of three classes, i.e.
dark-brown, brown, and light-brown colors. This classification is based on the pigment concentration and the
structure of eggshell. Dark brown egg stronger and thicker than the light brown one. The quality of an egg
decreases faster for bright eggshell’s color. This research classified the quality of broiler eggs based on the
eggshell color using the support vector machine. This research used color red-green-blue (RGB) image of
ninety eggs sample. Feature extraction was used to calculate the RGB of each egg. Normalization was used
to get normalize RGB parameters (rgb) before classification through the use of support vector machine.
Classification result showed the accuracy of 80 percent.
1 INTRODUCTION
Boiler egg is a favorite food that popular as the source
of animal protein. Most of the people need this kind
of food to fulfill the need for animal protein. An egg
is cheap and easy to produce, yet it supplies the need
for protein. A fresh egg is an egg without freezing
treatment, preservation, as well as no embryo
development, mixed yolk with albumen, intact, and
clean (Badan Standarisasi Nasional, 2008). An egg
consisted of three main component: eggshell,
transparent fluid (albumen), and yellow fluid (yolk).
The egg can be contaminated with the
microbiology easily, physical broken, vapor and other
molecule intrusions; therefore, decreasing the quality
of an egg (Jazil, 2013). If this situation continues, the
egg’s weight will be decreased and the egg white
tends to more watery. The intrusions are also affected
by temperature, relative humidity, and eggshell
quality. Therefore, the eggshell quality should be
examined to ensure the freshness of an egg. Before
checking the quality of an egg, grading process is
needed to avoid any doubts as well as its quality
uncertainty and to get the homogenous egg.
The egg’s quality is checked through
analyzing the interior and exterior of an egg. External
analysis checks the eggs condition, whereas the
internal analysis checks the contents of the egg.
The Eggshell is the outer part of an egg
which has some benefits, i.e. avoiding the physical
and biological damage, gas circulation through
porous at eggshell. The eggshell is the strongest part,
smooth, lime coated, and bonds to the outer
membrane. The eggshell quality depends on the form,
smoothness, thickness, completeness, and cleanness
(Badan Standarisasi Nasional, 2008) . Thin eggshell
has thinner and more porous than the thick one, so
decreases the quality faster. As an information, the
thickness of eggshell is depended on the chicken
strain, parent’s age, stress, and disease. For an old
hen, the eggshell will thinner because it can produce
sufficient calcium for the eggshell (Sakroni et
al,2015).
Eggshell texture and its thickness are
decreased following the brightness of the eggshell
color. There is a significant correlation between
eggshell color and its thickness as well as the weight.
But no clear correlation between its weight, albumen
weight, egg yolk weight and color, Haugh unit, and
the Calcium in the albumen and egg yolk. Therefore,
some quality of an egg can be considered through
seeing the eggshell color (Yang et al. 2009)
3092
Maimunah, ., Trias Handayanto, R. and Rokhman, T.
Support Vector Machine for Classifying the Quality of the Egg based on the Color.
DOI: 10.5220/0009947630923098
In Proceedings of the 1st International Conference on Recent Innovations (ICRI 2018), pages 3092-3098
ISBN: 978-989-758-458-9
Copyright
c
2020 by SCITEPRESS – Science and Technology Publications, Lda. All rights reserved
Eggshell color was captured based on the
color intensity and classified as dark brown, brown,
and light brown. Storage time and different eggshell
color affect its weight decreasing, Haugh unit value,
and the deep of air cavity. The dark brown eggshell
should be chosen since its quality decrease less than
the light brown based on storage time (Jazil, 2013).
Some disciplines, e.g. optic, mechanical,
electrical, acoustic, digital image processing, and
machine vision, are used to classify and find the
broken eggs. Image processing algorithms are used to
detect egg cleanness and blood spot by analysing the
maximum of its histogram as a criterion. This
algorithm use HIS color space to detect the cleanness
and the blood spot. The cleanness of eggshell is
detected through area detection method. The accuracy
of this research found the blood spot of 90.66% from
broken eggs and 91.33% from original eggs with
average accuracy of the algorithm was 91%
(Dehrouyeh et al. 2010).
Digital image processing has been widely
used in some applications, especially in computer
vision. Many image processing methods have been
implemented on robotic, object classification,
biometric system, medical visualization, image repair
and restoration, industrial inspection, and human-
computer interface (Ibrahim et al. 2012).
Many research on egg quality based on the
exterior of an egg. Crack detection of an egg can be
done with Susan edge detection and fuzzy
thresholding. These researches concluded that the
proposed algorithm outperformed Otsu and Power
Law algorithms. By adding the Gaussian to the input
image with variable between 0.002 and 0.001, the
accuracy were 97% and 82%. This algorithm has
minimum error (numbers of error pixels) less than
grey level image compared to the other algorithms
(Mansoory 2012)
The algorithm in HIS color space used
extract useful features of captured images of eggs by
machine vision to detect eggs defects. The algorithm
can also detect the severity of dirt on eggshell
(Dehrouyeh, 2010)
Classification through the use of support
vector machine (SVM) has been widely used in egg’s
parasite. Feature extraction using image processing
methods. Using a multi-class support vector machine
(MCSVM) the study gives the accuracy by 97.70%
(Avci and Varol, 2009). In addition, SVM was also
used to classify kinds and salted egg’s quality. This
method is reported when classifying the salted egg, it
achieved 81.25 % accuracy (Monro, 2013)
This study implemented the image
processing of boiler eggs and classifying them based
on eggshell’s color. The classification result can be
used to help in choosing the high-quality eggs.
2 METHODS
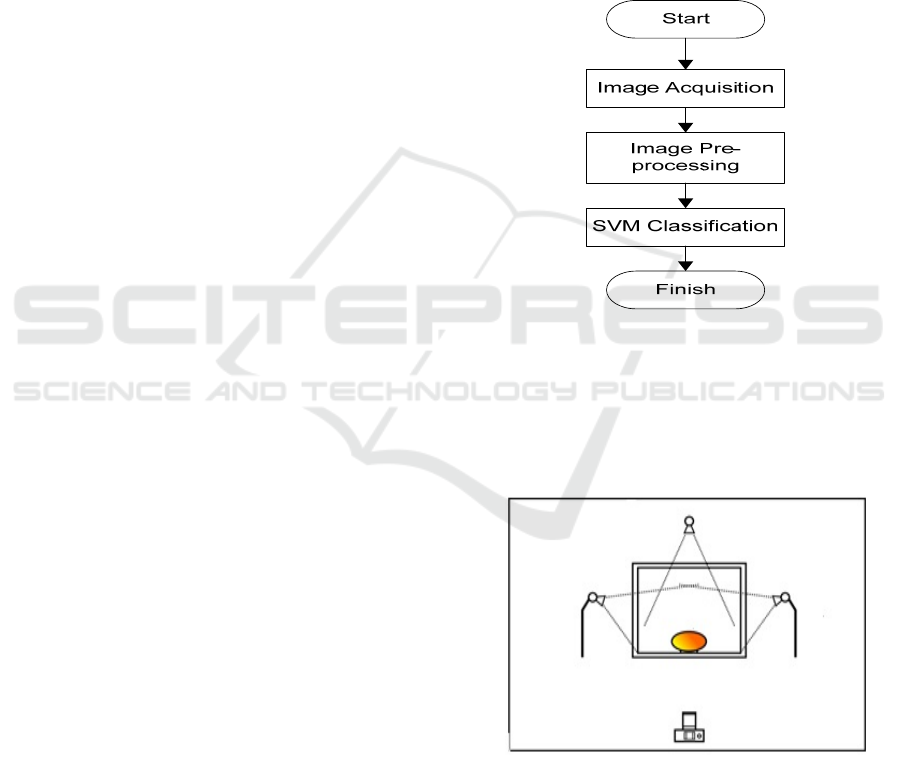
Figure 1 shows the research framework. Broiler eggs
were used with three classes, i.e. dark brown eggshell,
brown eggshell, and light-brown eggshell. A number
of images used for dark-brown, brown, and light-
brown were 30 eggs for each class.
Figure 1: Research framework.
Image acquisition step of the egg used DSLR
camera with 18 megapixel resolution. An egg was
placed in a box mini-studio with three 18 watt LED
light beams. Figure 2 shows the image acquisition
process.
Figure 2: Image acquisition.
The study used 90 eggs; each eggshell’s class of dark
brown eggshell, brown eggshell, and light-brown
eggs were 30 eggs. The images were saved as color
images/Red-Green-Blue (RGB) images.
In pre-processing step, the image cropping
and feature extraction were employed. Cropping was
camera
Support Vector Machine for Classifying the Quality of the Egg based on the Color
3093
done to get small part of sample. The color feature
was used in the study. Feature extraction was needed
to gather some important information from an image.
Color images have many RGB index value. Percent
different of RGB index causes the different color
representation, e.g. green, blue, etc. Higher color
index of an image shows a more bright color and less
color index shows the dark color. In this study the
three index values were separated and used as a
classification parameter. RGB index value of egg’s
image would be normalized to get zero to one range.
The normalization of RGB index value was
represented by r, g, and b variables as classification
parameters.
Classification is a process to decide the class
of an object. It uses the model with the ability to
classify an object based on its attribute. One of the
classification method is Support Vector Machine
(SVM).
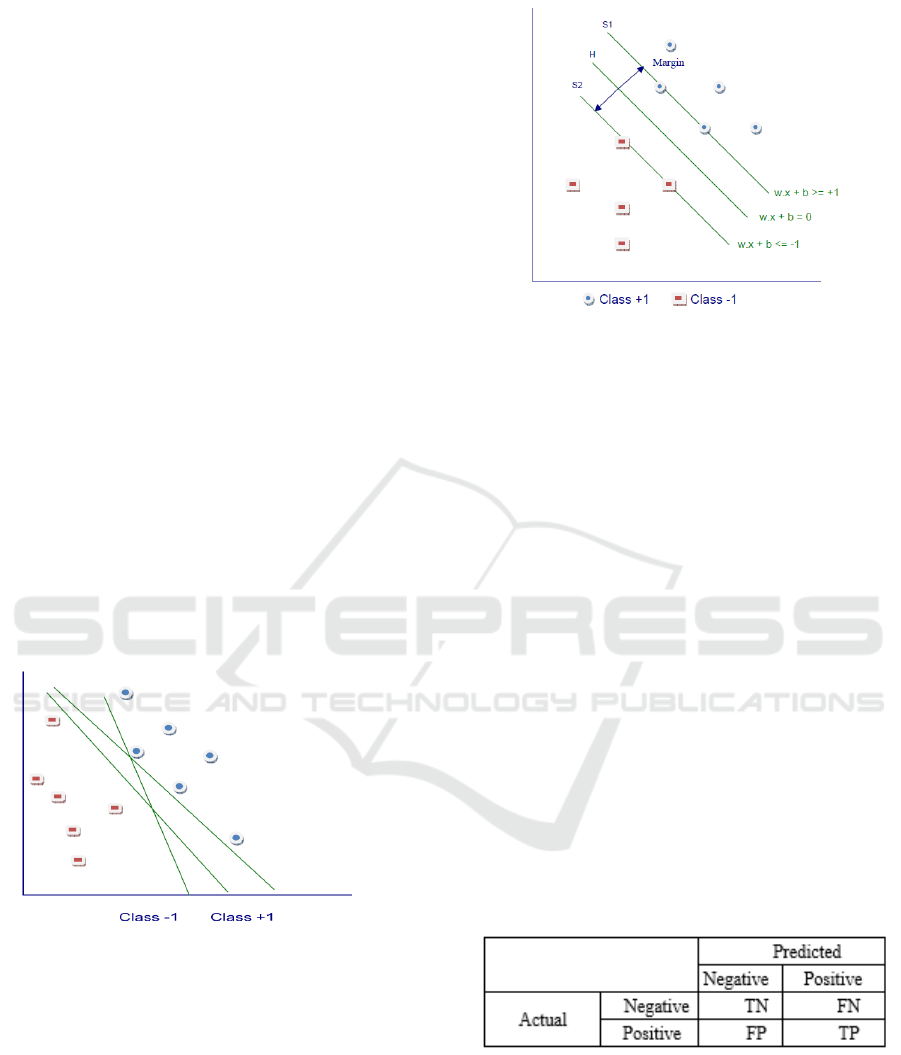
SVM can be simply explained by the
searching of the best hyperplane (H) to separate two
input classes of the input space. Figure 3 and 4 shows
some patterns having two classes: +1 and -1. The
class “+1” is shown in blue/circle, whereas the “-1”
class is shown in red/rectangle. The classification
problem is the problem to find hyperplane that
separate two groups. Some hyperplanes can be found
as discrimination boundaries.
Figure 3: The lines are discrimination boundaries.
Figure 4 : Separator line between two classes.
After all the color of egg images have been
extracted, the training and testing should be done. The
SVM training was used to train the model in order to
have an ability to match an image, whereas the testing
step should be done to ensure that the model meets
the minimum accuracy. SVM is a supervised
classification method because it uses the target/label
in training step. SVM is a nonlinear mapping to
convert data training to a new higher dimension. This
new dimension searches the hyperplane that separate
data linearly. With this method every nonlinear map
can be separate linearly in its corresponding higher
dimension with the hyperplane. SVM finds the
hyperplane through the use of support vector in the
margin.
In this research, SVM was used to classify the
eggs based on the color of eggshell. The multiclass
SVM was used with tree method. This method
compares the eggshell with the brown and light
brown eggshell. The result was then compared with
the dark-brown eggshell. Classification results were
represented in a confusion matrixes that informs the
actual and prediction of classification (Table 1).
Table 1: Confusion matrix.
Where TN (True Negative) = correct prediction; FN
(False Negative) = Incorrect prediction; FP (False
Positive) = incorrect prediction; TP (True Positive) =
correct prediction
The Confusion matrix is used to validate the
model accuracy. Accuracy was calculated using
equation (1).
ICRI 2018 - International Conference Recent Innovation
3094
accuracy
(1)
3 RESULT AND DISCUSSION
This research use three classes of eggshell color:
dark-brown, brown, and light-brown (Figure 5,6, and
7).
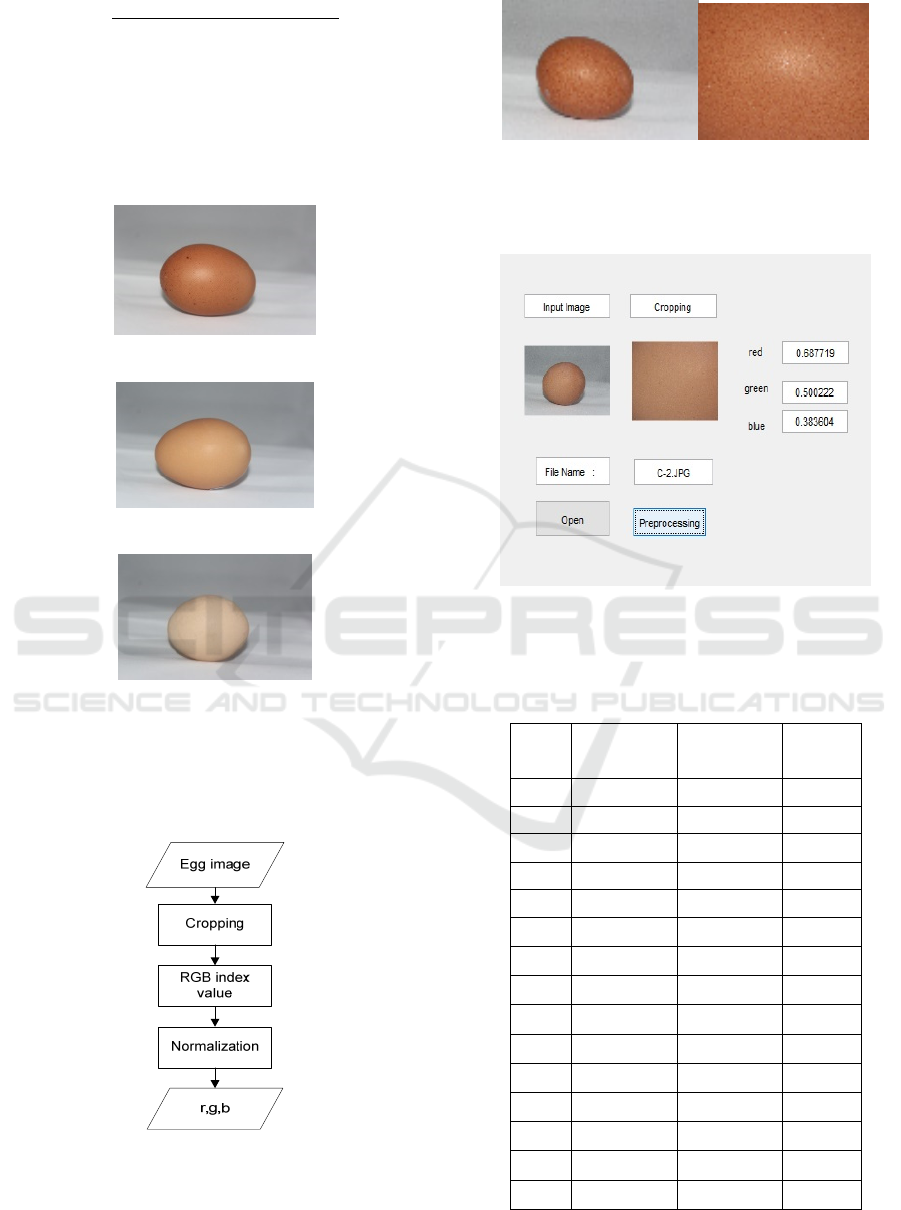
Figure 5: Dark brown egg color.
Figure 6: Brown egg color.
Figure 7: Light brown egg color.
To capture RGB feature, the images were cropped
that only showed only the egg. Stages in feature
extraction shown in Figure 8.
Figure 8: Feature extraction.
Figure 9 shows an example of image cropping.
Figure 9: Image cropping.
After cropping, RGB index value are calculated from
egg images using Matlab as in Figure 9
Figure 10: Preprocessing interface.
Table 2 shows the sample of RGB index value.
Table 2: RGB index value.
Image Color index
R
Color index
G
Color
index B
1
172.5 103.323 69.6447
2
170.058 100.607 70.1535
3
183.387 122.463 86.0195
4
176.04 123.086 96.9643
5
173.329 113.645 83.6685
6
181.252 136.334 104.862
7
182.933 131.47 95.2249
8
179.842 135.13 102.496
9
179.255 129.697 92.686
10
176.685 135.973 105.899
11
183.739 146.791 125.038
12
184.055 141.964 107.968
13
188.654 147.752 112.281
14
194.17 147.393 114.906
15
187.564 138.92 103.508
Support Vector Machine for Classifying the Quality of the Egg based on the Color
3095
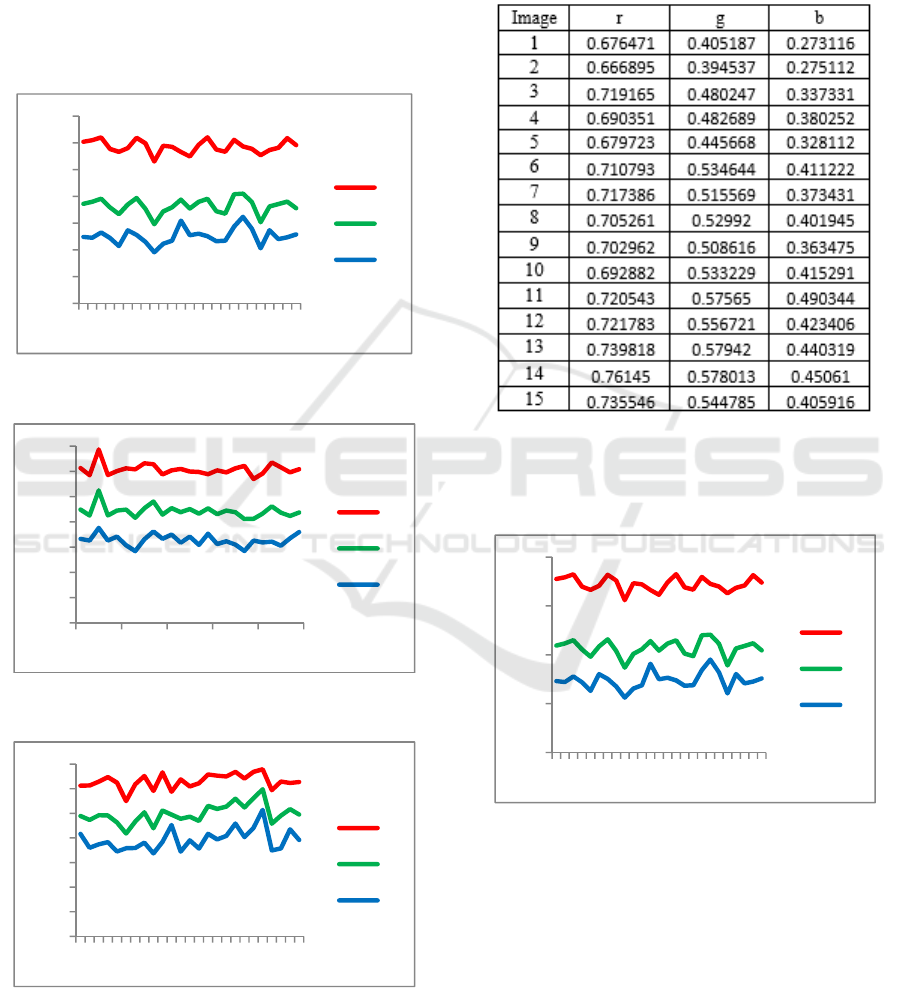
All RGB index value can be represented in a chart.
Figure 11 shows the distribution of RGB index value
for dark-brown eggshell, whereas Figure 12 and 13
show brown and light-brown eggshell respectively.
Based on distribution of RGB index value chart, it
shows clearly the different of dark-brown, brown, and
light brown RGB. Light brown egg has minimum
RGB range compared to brown and dark brown
eggshell color. It means that this class has minimum
different with the others.
Figure 11: The distribution of the dark-brown
eggshell RGB index.
Figure 12: The distribution of brown eggshell RGB
index.
Figure 13: The distribution of light-brown eggshell
RGB index.
RGB index value from previous process were
normalized to get the value between 0 and 1 that were
represented by r, g, and b variables. Normalization
result from RGB index in Table 2 can be seen in Table
3.
Table 3: Feature extraction.
The characteristic of egg images used for
classification with r, g, and b parameters are shown in
Figure 14, 15, and 16.
Figure 14: The distribution of dark-brown eggshell
RGB index after normalization.
0
30
60
90
120
150
180
210
1 4 7 101316192225
Darkbrowneggshell
R
G
B
0
30
60
90
120
150
180
210
1 5 9 13172125
Browneggshell
R
G
B
0
30
60
90
120
150
180
210
1 5 9 13172125
Lightbrowneggshell
R
G
B
0
0.2
0.4
0.6
0.8
1 5 9 13 17 21 25
Darkbrowneggshell
r
g
b
ICRI 2018 - International Conference Recent Innovation
3096
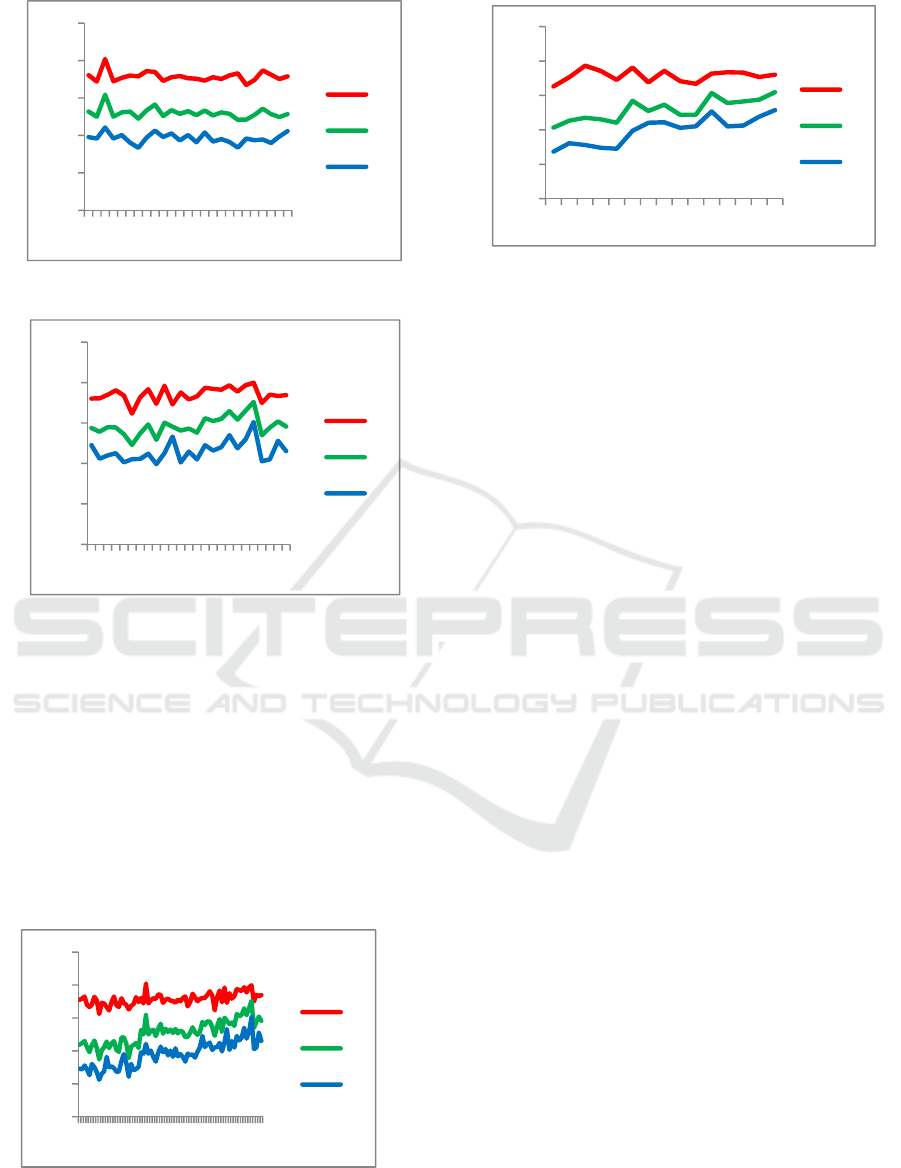
Figure 15: The distribution of brown eggshell RGB
index after normalization.
Figure 16: The distribution of light-brown eggshell
RGB index after normalization.
Based on distribution chart of R, G, and B as well as
the normalization result, the light-brown eggs had the
smallest RGB index distribution compared to brown
and dark-brown eggshells.
The next step was SVM classification that
consisted of training and testing phase. Training
phase used 25 eggs for each class. The total number
of eggs for classification was 75 eggs. Five eggs were
chosen as testing data for each class (15 eggs for all
classes). The distribution of all train data and testing
data can be shown in Figure 17 and 18.
Figure 17 : The distribution of train data.
Figure 18 : The distribution of testing data.
In classification phase, multiclass SVM was used.
By tree method, the brown and light brown are
compared. The winner would be compared with dark
brown egg that give the result whether an egg is
classified in dark brown, brown or light brown class.
To solve the classification problem, the separator line
should be prepared: i) between brown and light
brown, ii) between light brown and dark brown, and
iii) between brown and dark brown; these equations
are: svmStruct1,svmStruct2 and svmStruct3.
The procedures for training the SVM can be
summarized as follow.
First, the SVM classifier was generated through
the “svmtrain” function in Matlab. At the first stage,
the separation (svmStruct1 variable) was between
brown and light brown eggshell.
svmStruct1=svmtrain(train_data,target1,
'Showplot',true)
Second, the separation classifier, svmStruct1, then
compared with the dark-brown eggshell class. The
“svmStruct2” separation classifier with the same
function to svmStruct1:
svmStruct2=svmtrain(train_data,target2,
'Showplot',true)
Third, classification was comparing the brown
eggshell with the dark-brown eggshell (svmStruct3
variable):
svmStruct3=svmtrain(train_data,target3,
'Showplot',true)
The SVM equation that has been made is as follows:
svmStruct1 =
SupportVectors: [13x3 double]
Alpha: [13x1 double]
Bias: -1.2220
KernelFunction: @linear_kernel
KernelFunctionArgs: {}
GroupNames: [75x1 double]
0
0.2
0.4
0.6
0.8
1
1 5 9 13172125
Browneggshell
r
g
b
0
0.2
0.4
0.6
0.8
1
1 5 9 13172125
Lightbrowneggshell
r
g
b
0
0.2
0.4
0.6
0.8
1
1 11213141516171
r
g
b
0
0.2
0.4
0.6
0.8
1
13579111315
r
g
b
Support Vector Machine for Classifying the Quality of the Egg based on the Color
3097

SupportVectorIndices: [13x1 double]
ScaleData: [1x1 struct]
FigureHandles: []
vmStruct2 =
SupportVectors: [13x3 double]
Alpha: [13x1 double]
Bias: -1.2220
KernelFunction: @linear_kernel
KernelFunctionArgs: {}
GroupNames: [75x1 double]
SupportVectorIndices: [13x1 double]
ScaleData: [1x1 struct]
FigureHandles: []
svmStruct3 =
SupportVectors: [25x3 double]
Alpha: [25x1 double]
Bias: 1.0676
KernelFunction: @linear_kernel
KernelFunctionArgs: {}
GroupNames: [75x1 double]
SupportVectorIndices: [25x1 double]
ScaleData: [1x1 struct]
FigureHandles: []
Table 3 shows the confusion matrix of the testing
result.
Table 3: Confusion matrix.
Prediction
First
class
Second
class
Third
class
Actual
First class 5 0 0
Second class 0 2 3
Third class 0 0 5
From Table 3, it is observed that accuracy obtained is
80%. From the confusion matrix, the dark brown and
light brown eggs can be identified correctly. For the
brown eggs, as much as 60% are identified as light
brown eggs. This can be caused by almost the same
intensity of brown color. The difference between
brown and light brown is not much different
4 CONCLUSIONS
In this paper, the egg images are captured to identify
the class of chicken based on the color of their
eggshell. The color feature extraction using the
average value of RGB. SVM classifier is used to
identify the classification with the accuracy is 80%.
The lighter brown eggshell the faster deterioration
quality. Consumers are encouraged to choose dark
brown consumption eggs that have the lowest level of
degradation quality during storage. Future research
on the classification performance of several
classifiers will be conducted to find the best
classifiers.
ACKNOWLEDGEMENTS
The authors would like to thank the Directorate of
Research and Community Service of the Ministry of
Research, Technology and Higher Education who
have funded this research for the Beginner Lecturer
Research scheme for the 2018 fiscal year.
REFERENCES
Avci, D. & Varol, A., 2009. An expert diagnosis system for
classification of human parasite eggs based on multi-
class SVM. Expert Systems With Applications, 36(1),
pp.43–48. Available at:
http://dx.doi.org/10.1016/j.eswa.2007.09.012.
Badan Standarisasi Nasional, 2008. SNI 3926:2008 Telur
Ayam Konsumsi. Standar Nasional Indonesia, pp.1–8.
Dehrouyeh, M.H. et al., 2010. Grading and Quality
Inspection of Defected Eggs Using Machine Vision. ,
17(2005), pp.23–30.
Ibrahim, R. et al., 2012. Egg’s Grade Classification and Dirt
Inspection Using Image Processing Techniques. , II,
pp.4–7.
Jazil, N., 2013. Penurunan Kualitas Telur Ayam Ras
Dengan Intensitas Warna Coklat Kerabang Berbeda
Selama Penyimpanan. Jurnal Aplikasi Teknologi
Pangan, Vol 2 No.(Jurnal Aplikasi Teknologi Pangan),
pp.43–47.
Mansoory, M.S., 2012. Automatic Crack Detecton in
Eggshell Based on Susan Edge Detector Using Fuzzy
Theresholding. , 18(11), pp.1602–1608.
Monro, Shintya Yosvine et al., 2013, Klasifikasi Jenis dan
Kualitas Telur Asin Berdasarkan Warna Kuning Telur
Menggunakan Transformasi LBP (Local Binary
Pattern) dan Metode SVM (Support Vector Machine).
Thesis. Telkom University. Bandung
Sakroni, et al, 2015. Perbandingan Tebal
Kerabang,Penurunan Berat Telur, dan Nilai Haugh Unit
Telur Ayam Ras Umur Simpan Sepuluh Hari dari Strain
Ayam Yang Berbeda. Jurnal Ilmiah Peternakan
Terpadu, 3(November), pp.217–220.
Yang, H.M., Wang, Z.Y. & Lu, J., 2009. Study on the
relationship between eggshell colors and egg quality as
well as shell ultrastructure in Yangzhou chicken. ,
8(12), pp.2898–2902.
ICRI 2018 - International Conference Recent Innovation
3098
