
Analysis of Acceptance of Online
K
RS using Technology Acceptance
Model (TAM) Method: Case Study of STMIK Cipta Darma
Surakarta Student
Siti Rihastuti
1
, Afnan Ros
y
idi
1
and M. Nur Juniadi
1
1
Informatics Management, STMIK Cipta Darma Surakarta, Veteran street, Notosuman, Sukoharjo,, Indonesia
Keywords: Tam, online krs, usefulness, ease of use.
Abstract: This research was conducted to know how far the acceptance of student to utilization of facility of Study Plan
Card (KRS) based online by using approach model of Technology Acceptance Model (TAM) method. It is
important to know how the user's response to the information system and in the future can be developed an
information system that is more acceptable to the users. TAM is one of the theoretical approaches that can
describe the level of acceptance of technology. In this method there are 3 (three) variables tested and analyzed,
consisting of two independent variables (Perceived Usefullness and Ease of Use) and one dependent variable
(User acceptance of IT / Acceptance of IT). Respondents come from Information Management students of
STMIK Cipta Darma Surakarta. Through TAM model can be described that the user perception will determine
the reaction and attitude to the acceptance of information technology.
1 INTRODUCTION
The development of information technology so
rapidly in the current era of globalization. Almost all
areas and human activities are supported by the
existence of information technology. Information
technology is a technology used to process data,
including processing, obtaining, compiling, storing,
manipulating data in various ways to produce quality
information, ie relevant information, accurate and
timely. STMIK Cipta Darma Surakarta is one of the
computer universities in the city of Surakarta.
Management of good academic activities also support
the smooth running of learning process. One of the
services for students is the existence of online based
Study Card (KRS) system. After printing KHS (Card
Study Result) semester before and consultation
course to be taken to lecturer of academic supervisor,
then student fill KRS online at web
www.amikomsolo.ac.id without having to come to
campus.
Students can fill out KRS to choose courses to be
taken in the next semester. From existing KRS
information systems, connect between students and
campus parties. So if at the time of charging KRS
occurs obstacles, errors / errors, insecurity in
achieving its objectives, will lead to the possibility of
failure of management information systems KRS and
disruption of lecture continuity in the next semester.
Based on this, it can be seen that KRS is very
important for the continuity of teaching and learning
process on campus. So it is necessary to do analysis
and evaluation to find out what are the obstacles for
students when the use of information systems KRS.
From the implementation of KRS online use by
students, it has not been analyzed yet and it is not
known how far the benefit felt by students and
academic department. This analysis is important to
know the user's response to the information system
used and attempts to improve (evaluation) of the
student especially as the user, and the academic part
as the provider of information system, so it is
expected the academic part as the provider of
information system can develop the system to be
better and can more accepted by users in the future.
Evaluation done after seeing the number of students
who access (log in) into the information system KRS
using the username and password of other students.
In terms of security, it is still unclear how much
student confidence in KRS online benefit using the
account he uses. In this study, the questionnaires were
distributed to students of Informatics Management
course using KRS online at STMIK Cipta Darma
Surakarta.
Rihastuti, S., Rosyidi, A. and Junaidi, M.
Analysis of Acceptance of Online KRS using Technology Acceptance Model (TAM) Method: Case Study of STMIK Cipta Darma Surakarta Student.
DOI: 10.5220/0009946530513059
In Proceedings of the 1st International Conference on Recent Innovations (ICRI 2018), pages 3051-3059
ISBN: 978-989-758-458-9
Copyright
c
2020 by SCITEPRESS – Science and Technology Publications, Lda. All rights reserved
3051
To know the extent to which users are willing to
accept and use KRS online it is necessary to evaluate.
There are many models developed by researchers to
measure the acceptance of technology by users. One
theory about the use of information technology
systems that are considered highly influential and
commonly used to describe individual acceptance of
the use of information technology systems is the
technology acceptance model (TAM). This theory
was first introduced by Davis (1986). This theory was
developed from Theory of Reasoned Action or TRA
by Ajzen and Fishbein (1980).
Technology Acceptance Model (TAM) is a model
of acceptance of information technology systems that
will be used by users. The technology acceptance
model (TAM) or TAM was developed by Davis et.al.
(1989) based on the TRA model. The TRA model can
be captured because the decisions made by
individuals to accept an information system
technology are conscious actions that can be
explained and predicted by their behavior interests.
TAM adds two main constructs to the TRA model.
The two main constructs are perceived usefulness and
perceived ease of use. TAM argues that individual
acceptance of information technology systems is
determined by the two constructs. perceived
usefulness and perceived ease of use both have an
effect on behavioral intention. Technology users will
have an interest in using technology (interest in
behavior) if they feel the technology system is useful
and easy to use. Perceived usefulness also affects
perceived ease of use but not vice versa. System users
will use the system if the system is useful whether the
system is easy to use or not easy to use. A difficult
system to use will still be used if the user feels that
the system is still useful. The model of TAM against
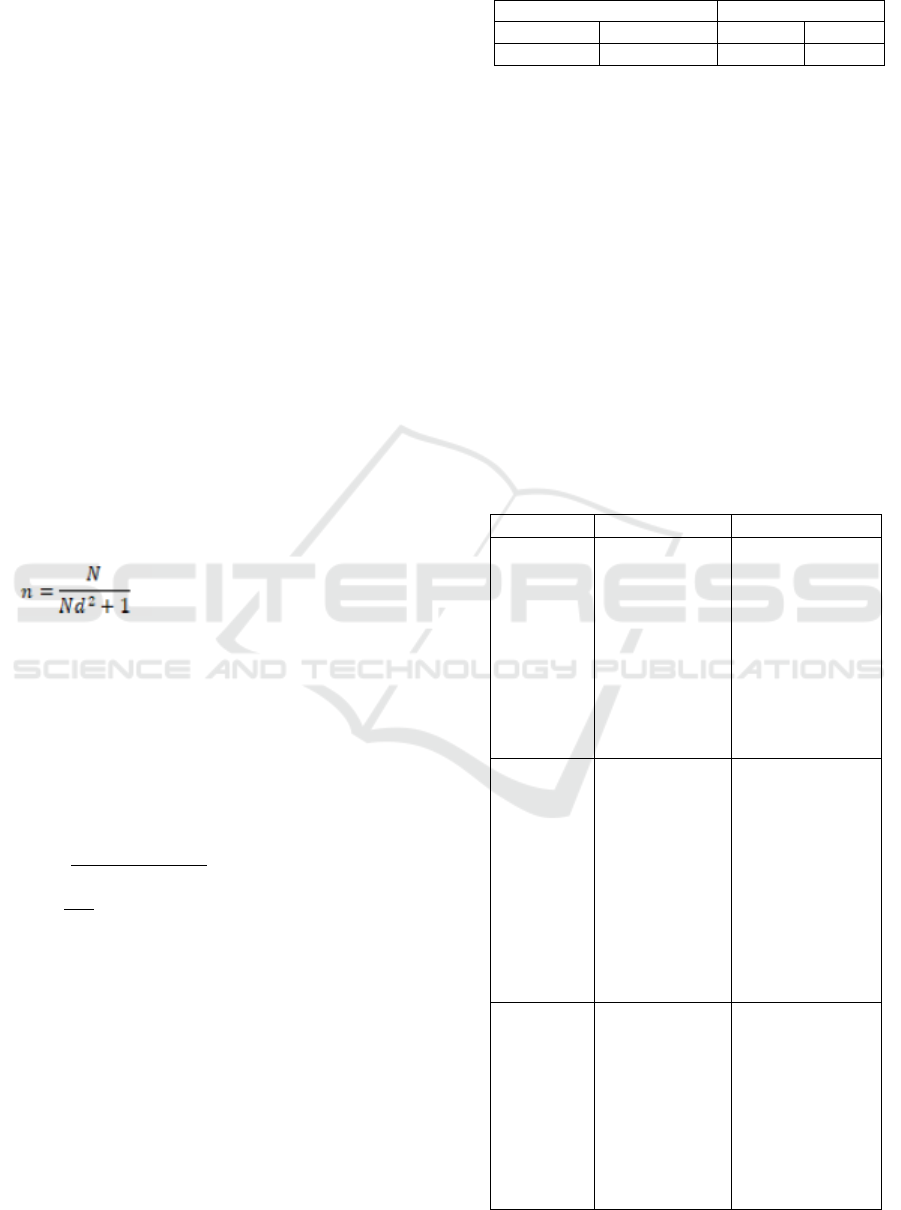
online KRS acceptance can be seen in figure 1.
Perceived Usefulness
Defined as perceived usefulness is a level where
the user believes that the online KRS information
system will be able to improve the performance or
performance of users of the system.
Figure 1. Online KRS Acceptance Analysis
Perceived Ease of Use
The definition of perceived ease of use is a level
at which users believe that the use of the online KRS
information system can reduce a person's business in
doing something. Ease is meaningless without
difficulty or unnecessary effort. This perceived ease
of use refers to the user's belief that the technology
system used does not require a great deal of effort
when used. In this case at the time of filling KRS
online, students do not need to come to campus,
students can make data entry in KRS information
system from anywhere based on the information
provided
2 METHOD
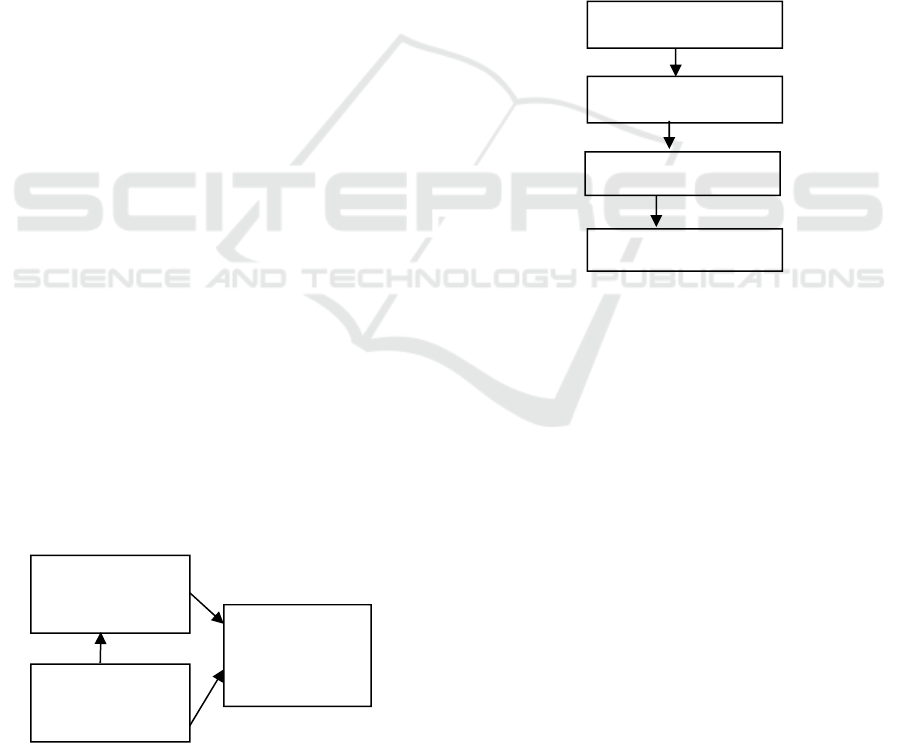
Figure 2. Research method
2.1 Study of Literature
The first step of this research method is to conduct a
literature study on online KRS and TAM methods to
be used.
According to research Fatmasari et al. with title
Applying Technology Acceptance Model (TAM)
Method to Acceptance of Online KRS (Case Study:
Computer Science Student of Bina Darma University
of Palembang) described that perceived usefulness
variable and perceived ease of use are very influential
against user behavior in receiving the technology it
uses. The higher the usability and the ease of using
information system technology, the higher the
acceptance for the user.
Putu Adi research in his writings entitled
Implementation of TAM Method (Technology
Acceptance Model) in Information System
Implementation Bazaar Banjar explained that the
belief that bazaar banjar information system is useful
Perceived
usefulness
Perceived
ease of use
Acceptance of
online KRS
(Intention to
Use)
Study of literature
Data collection
Conclusion
Analysis
ICRI 2018 - International Conference Recent Innovation
3052

will affect the attitude of acceptance or rejection of
bazaar banjar information system.
According to research Agusdi Syafrizal et al.
Under the title Applying Technology Acceptance
Model (TAM) Model for Understanding Interactive
Multimedia Based Media, TAM model can explain
that user perception will determine its attitude in
acceptance of use of Information Technology (IT).
This model more clearly illustrates that the recipient
of IT usage is affected by usefulness.
According to Kartika Gianina G. in the title
Applying Technology Acceptance Model On
Edmodo Application At Ciputra University Surabaya
Using Path Analysis, the perception of usage of direct
use has an effect on intention to use, so it can be
concluded that Edmodo users are still oriented to find
software that is easy to use view other features and
uses and user intentions directly affect real usage.
According to Siti Monalisa et al. In his research
Analysis of Acceptance of Information System of
Routine Statistics Data Processing (SISR) Using
Technology Acceptance Model Method (Case Study:
BKKBN Riau Province) got the result that
Quantitatively, correlation of variable of benefit to
receipt of Information System Data Processing
Routine Statistic (SISR) 58.6%, the ease of
acceptance of Information System Data Processing
Routine Statistics (SISR) is 52.3% and the correlation
between the ease and benefits simultaneously to the
acceptance of Information System Data Processing
Routine Statistics (SISR) of 64.6%. This value
indicates that ease and benefit variable have good
relation to user acceptance of Information System of
Routine Statistics Data Processing (SISR).
According to Fran Sayekti et al. In his research
entitled Implementation of Technology Acceptance
Model (TAM) In the Testing of Acceptance Model of
Regional Financial Information System, obtained the
result that the success of acceptance of SIPKD
depends on user perception. If the user thinks that
SIPKD is easy to use and useful then they will more
easily accept SIPKD in their work. For decision
makers regarding the use of information systems in
government agencies, with the results of this study it
is advisable to conduct trials and training on users
before the system is officially applied as a necessity.
With a trial and a structured training, the user will
more easily operate the information system
According to Marini et al. In her writings entitled
Technology Acceptance Model Analysis BPJS
Application On line Acceptance of the BPJS Online,
application model improve service to service users,
namely parties the community evaluates the
management of the party by asking for feedback from
the community receipt of online BPJS applications.
This evaluation is done to find out about the
acceptance of society BPJS Online application
technology. This research is only focused on the BPJS
Online Application Technology Acceptance Model
namely the usage phase based on Usability, Ease, and
intention to use Application Technology The
community's online BPJS feels. Model Analysis
researchers use is Path Analysis namely development
directly form Double Regression so that the level of
importance a significant variable causal relationship.
Method which is used to test the correlation
relationship pattern variable that is Structure
Equation Modeling (SEM) with using AMOS 16.0
Software.
According to Rini Oktofiyani et al in her
writings entitled Acceptance Of E-Learning System
Using Technology Acceptance Model (Tam) Case
Study Of Students / I Class X In Jakarta 92 State High
School, described that The current technology
developments led to the need for information
quickly, precisely and accurately. One of the
technological developments in the field of education
is the elearning. SMA Negeri 92 Jakarta is one of the
implemented system learning who made online and
are expected to help students improve their learning.
Instruments research on analysis of acceptance e-
learning systems using technology Acceptance
Model (TAM) is the questionnaire form and the
object of research is the grade X SMA Negeri 92
Jakarta 138 respondent of the student taken. Analysis
of the data done by the descriptive analysys
techniques using the categories and percentages
through the scale likert. The result showed that the
relationship between variable X (Perceived Ease Of
Use and Perceived Usefulness) and variable Y
(behavioral Intention to Use) in acceptance system e-
learning SMA Negeri 92 Jakarta is 0,727. The value
of the correlation of this very strong positive. The
relationship has a positive is the direct relationship
between variable X and Variable Y. Based on the
correlation coefficient analysis correlation, both
manually and using SPSS, can be concluded that the
relationship that occurs between
variable X (Perception of Ease of Use and Benefit
Perception) with variables Y (Perception of interest in
using behavior technology) in the acceptance of the
ELearning system Jakarta Public High School 92 is
0.722. The correlation value of this magnitude is
strong positive. Relationships are strong positive it
means that there is a directional relationship variable
X and variable Y. When Ease usage and benefits are
getting better then the user's interest in using
Analysis of Acceptance of Online KRS using Technology Acceptance Model (TAM) Method: Case Study of STMIK Cipta Darma Surakarta
Student
3053

technology is increasing. Contribution of the
influence of variable X (Ease Usage and Benefits)
variable Y (Interest in using behavior technology) in
the acceptance of the ELearning system Jakarta
Public High School 92 is 52.2%, while 47.8% is
determined by other variables. Results of significance
testing (Correlation Product Moment Person)
obtained the value of tcount = 12,177, with a
significance level of 5% value of t table = 1,978.
Because thitung is bigger from ttable, Ho is rejected,
so Ha be accepted. Thus there is significant influence
between Ease Usage and Use with Interest
technology use behavior towards acceptance of the
State High School E-Learning system 92 Jakarta.
According to Susy Rosyida in her writing entitled
Technology Acceptance Model (TAM) on Internet
Usage in Shopping Online. This research is to know
the utilization of internet technology in online
shopping. This research method is explanatory
research with quantitative approach. Data in this
research that is primary data and secondary data,
primary data that is used that is by spreading
questioner to respondent of internet user in doing
onlne or e-commerce shopping whereas secondary
data used is from report, journal and literature
relevant. By using the Technology Acceptance Model
(TAM) variables used are usability, ease, attitude,
intense and the use of online transactions or online
shopping or use of e-commerce. The results show that
ease has a significant influence on usability, ease,
attitude, intensity and usage with the utilization of
internet technology as a technology for conducting
online transactions or shopping online or using e-
commerce. Variable usability, convenience, attitudes
have the most dominant influence on intense and
usage in using e-commerce. Conclusions from the
results of research using This explanatory research
shows that respondents using the internet in the
business sector as an intermediary medium in
conducting online shopping transactions e-
commerce. By using variables usability, ease,
attitude, intense and internal use using e-commerce is
very influential significant so that it can make it easier
for good users as a buyer or as a seller get information
about what is needed or make transactions and give
satisfaction to the service.
According to Fatmasari et al in her writings
entitled Evaluation Of Acceptance Of E-Ktp System
Using Tam (Technology Acceptance Model) (Case
Study: Palembang Ilir Timur I Sub-district Office).
The E-KTP project is motivated by a system that
makes conventional ID cards in Indonesia possible. A
person can have more than one ID card. This is due to
the absence of an integrated database collect data on
residents from all parts of Indonesia. To overcome
these duplications at once creating a single identity
card. So the E-KTP is based on the Population
Registration Number (NIK), E-KTP based on
national NIK, contains security codes and electronic
records as verification tools and validation of one's
identity data. This study aims to determine the factors
that influence acceptance of the Electronic Identity
Card (E-KTP) system with the Technology
Acceptance model Model (TAM), which was carried
out at the East Ilir Sub-District I (IT I) office. In this
study, the author using three variables that influence
the acceptance of the E-KTP system. This variable is
Perceived Usefulness (PU) and Perceived Ease of Use
(PEOU) as independent variables while receipt of
EKTP systems as related variables. Sampling in this
study was carried out in probability (random
selection) using the Area Sampling or Sample area
method, the researcher set a sample for the
community as many as 20 respondents from each
village to get it total respondents for the community
were 220 respondents representing each village.
Results This study shows that simultaneously or
partially there is a significant relationship and
positive between independent variables and related
variables. While the results of the Regression analysis
obtained facts that the contribution of these two
variables is 64.5% of the receipt of the E-KTP system.
Based on the description of theory and the results
of previous research, it can be formulated hypothesis:
1. If the student as the user of KRS online information
system has the perception that the system is easy
to use and easy access of KRS filling, the student
will increasingly use the online KRS system
actual (according to KRS filling schedule) to
complete the process of KRS management, so the
hypothesis is submitted is:
H1: Perceived Ease of Use has a positive effect on the
acceptance of KRS online information system.
2. If the student as the user of KRS online information
system has a perception that the system is easy to
use and easy access of KRS filling, then the
student will increasingly use the actual online
KRS information system (according to KRS
filling schedule) to complete the process of KRS
management, so the hypothesis filed are:
H2: Perceived Usefulness has a positive effect on the
acceptance of KRS online information system.
3. If students as users of KRS online information
system have a perception that the online KRS
information system is easy to use and useful in
completing the process of KRS management, the
students will increasingly use the online KRS
ICRI 2018 - International Conference Recent Innovation
3054
information system. So the third hypothesis
proposed in this study are:
H3: Perceived Ease of Use and Perceived Usefulness
together have a positive effect on the acceptance of
KRS online information system
2.2 Data Collection
The second stage is to collect data. Data used in this
research are primary data and secondary data.
Primary data is data collected directly by researchers
or who need data in the field. Primary data is obtained
from individuals or individuals. Primary data in this
research is the result of quosinal answer is distributed
to the student of Information Management STMIK
Cipta Darma Surakarta. Respondents involved are
active students using KRS online information system.
Questionnaires were not distributed to all students,
only samples were taken. The sample is part of the
overall population used to describe a population.
While secondary data is data collected by researchers
or who need through existing sources. This data is
used to support the primary data already obtained.
Secondary data in this research is literature, books
and other library materials. One method that can be
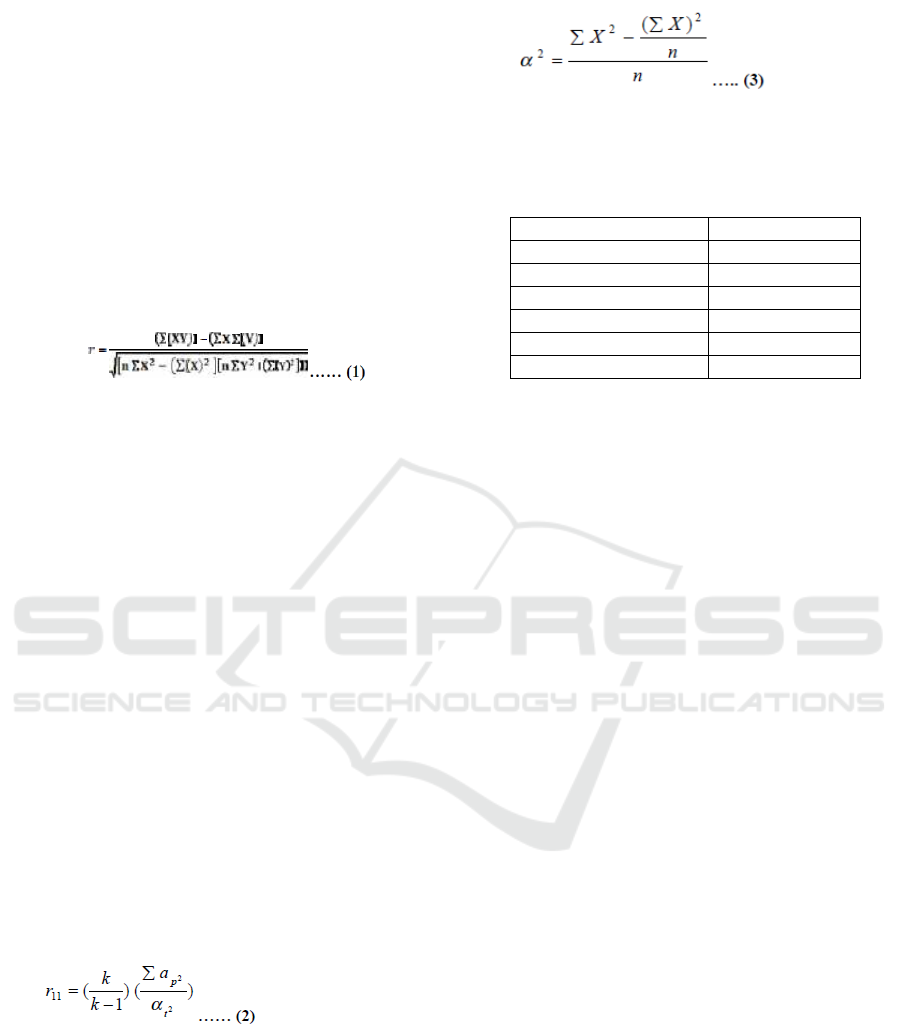
used to determine sample size is the Slovin formula:
Where :
n = number of samples
N = population size
d = limit of accuracy (inaccuracy due to sampling
error). If the limit of accuracy is 10%, then this
sample has a 90% accuracy to describe the
population.
Based on the calculation of Slovin formula, we get
the sample size used as:
n = ( 100 )
(100 x (0,1)
2
) +1)
n = 100
2
n = 50
From the calculation, the minimum required
sample is 50 people. The questionnaire obtained from
the results of disseminating to the students of
Information Management is 55 questionnaires, so the
number of questionnaires is sufficient to describe the
user population of KRS online information system.
Respondents involved are students who have an 18-
22 year age range. The detail characteristics of
respondent questionnaires seen in Table 1.
Table 1. Characteristics of Respondents Questionnaire
Gender Percentage
Male Female Male Female
33 22 0,6 0,4
2.3 Analysis
In this study, researchers chose the TAM model
as a theoretical basis that has a strong ability to
explain the use of technology by users (Davis,
FD1989). This study used 3 (three) variables that
have been modified from the previous TAM research
model: Perceived Usefulness as the first variable (A),
convenience (Perceived Ease of Use) as the second
variable (B), and acceptance of online KRS users as
related variables (X) which according to the TAM
theory significantly usability variables and
convenience variables affect the acceptance of users
in the use of online KRS. More clearly can be seen in
Table 2 regarding the variables used to measure the
acceptance of online KRS users.
Table 2. Variables used in the study
Variable Definition Indicator
Perceived
Usefulness
Explain
that users
believe that the
KRS
information
system will be
able to improve
work
performance or
performance
a. Charging
KRS is faster
b. Charging is
easier to do
c. Improve
effectiveness
d. Useful
Perceived
Ease of
Use
A level
where users
believe that the
use of KRS
information
systems can
reduce a
person's
business in
doing
something
a. Easy to learn
b. Easy to use
c. Available
information
is clear
d. Free from
trouble
Intention to
use
Online
acceptance
level of KRS by
user
a. Interest in
using the
system in
real time
b. Frequency of
system usage
c. User
satisfaction
d. Motivate
other users
Analysis of Acceptance of Online KRS using Technology Acceptance Model (TAM) Method: Case Study of STMIK Cipta Darma Surakarta
Student
3055
2.4 Data Analysis Technique
Test Prerequisite (instrument) is done by using data
validity test and data reliability test. This prerequisite
test is performed using SPSS for windows program.
a. Validity test
Validity test is done to find out whether all
research (instrument) question that is proposed to
measure research variable is valid. Validity test is
done by looking at the significant value of each
instrument. To calculate the value of correlation
between data on each question with total score using
product moment correlation technique formula, the
formula as follows:
Information :
r: correlation value
n: number of respondents
X: score of each item
Y: total score
XY: score of each item x total score
ΣY
2
: sum of squares total score
ΣX
2
: sum of squares of item scores
(ΣY)
2
: the square of the total total score
(ΣX)
2
: Squares the number of item scores
b. Test Reliability
The constructs need to be tested for their
reliability. Reliability testing is used to measure the
consistency of respondents' answers. Test performed
with Cronbach Alpha (CA). If the measuring
instrument is valid, then the measuring instrument is
tested. Reability is a value that shows the consistency
of a measuring device in measuring the same
phenomenon. Reliability measurement technique
used is Cronbach technique. Looking for instrument
reliability whose score is not 0-1, but it is between
several values. The scores used by the authors are 1
to 5.
The formula used is:
Information :
r11: Instrument reliability
k: Many questions
αt2: Total standard deviation
Σαb2: The number of standard deviations of the
item
For the number of variance of grains determined
by determining the variance value of each item by
using the following formula:
information :
n: Number of respondents
X: Score value selected from the item in question
Table 3. Interpretation of Cronbach Alpha Numbers
Cronbach’s Alpha Interpretation
α≥0,9 Very Good
0,8≤α<0,9 Good
0,7≤α<0,8 Acceptable
0,6≤α<0,7 Questionable
0,5≤α<0,6 Not good
α<0,5 Unacceptable
c. Multiple Linear Regression Testing
Hypothesis testing is done by statistical test using
multiple linear regression method because
independent variable used more than one variable.
Multiple regression analysis is used to see the
influence between more than one variable, which in
this research is the usefulness and ease of acceptance
of online KRS system in STMIK Cipta Darma
Surakarta.
The multiple regression equation is:
Y = a + b
1
x
1
+ b
2
x
2
+ e……(4)
Information :
Y: Acceptance of online KRS system
a: Constants
b
1
b
2
: regression coefficient
x
1
: Benefit variable
x
2
: Variable convenience
e: Error
2.5 Results
2.5.1 Characteristics of Respondents
1) Gender
Based on the research on 55 questionnaires, the
majority of respondents were Male (33%), while the
rest were 22 respondents (40%) female. The age
range of respondents who filled out the questionnaires
was from 18 years old to 22 years old.
2) Length of Computer Use
Of 55 questionnaires, 25 respondents used
computers less than 6 years (45%), 18 respondents
used computers more than 6 years (32%), 7
respondents used computers for less than 10 years
(12%), and 5 respondents use computers for more
than 10 years (9%).
3) Frequency of Internet Usage per day
ICRI 2018 - International Conference Recent Innovation
3056

Respondents who used the internet per day consisted
of 5 respondents or 9% for less than 3 hours, 17
respondents or 30% for 3 hours to 6 hours, 23
respondents or 41% for 6 hours to 10 hours, and 10
respondents or 18% for more than 10 hours per day.
4) Do You Know about the existence of KRS
Online
Of 55 questionnaires that have been filled, all
respondents claimed to have known the existence of
online krs on AMIK Cipta Darma. This means that
100% of respondents involved have known and
understood the existence of the information system.
2.6 Test Validity and Data Reliability
Based on the data obtained from the questionnaire
given to the respondents who entered into the sample
and then tested the questionnaire to measure the level
of goodness of the questionnaire is to conduct the
validity and reliability analysis of the questionnaire.
Validity indicates the extent to which the question
relates to what is being asked or what it wants to
measure in the research. The validity level of the
questionnaire is measured by the validity coefficient
which in this case uses the Pearson correlation
coefficient, while the reliability of the data to see how
reliable the data is based on the Cronbach's alpha
coefficient If the output display in the tested column
(r value) is marked with a star, or the question is
declared valid (Ghozali, 2010).
2.6.1 Variable Usefulness (Perceived of
usefulness)
For validation test of usability variable (PU) (A), the
result can be seen in Table 4.
Table 4. Test results of validity of usability variables
A-PEU
Person
correlation
PU1 .734**
PU2 .651**
PU3 .783**
PU4 .762**
B-PU 1
N 54
In table 4 it can be seen that all statement items
are marked (flag) which means that all items can be
declared valid.
In reliability testing all items used in measuring
the benefit variable yield reliability coefficient
(cronbach's alpha) of 0.842. Value of reliability
coefficient is greater than the benchmark value of 0.6,
so it can be said that the indicators used to measure
the variable benefits are expressed to have high
reliability.
Table 5. Reliability test results of usability variables
Cronbach’s
Alpha
Cronbach’s Alpha
based on standardized
items
N of
items
,842 ,864 5
2.6.2 Variable Perceived Ease of Use
For Perceived ease of use (A), the results can be seen
in Table 6.
Table 6. Test results of validation of perceived ease of use
variables
B-PEU
Person
correlation
PEU1 .632**
PEU2 .699**
PEU3 .701**
PEU4 .742**
X2-PEU 1
N 54
In table 6 it can be seen that all statement items
are marked (flag) which means that all items can be
declared valid.
In reliability testing all items used in measuring
the benefit variable yield reliability coefficient
(cronbach's alpha) of 0.762. Value of reliability
coefficient is greater than the benchmark value of 0.6,
so it can be said that the indicators used to measure
the variable benefits are expressed to have high
reliability.
Table 7. Reliability test results of perceived ease of use
variables
Cronbach’s
Alpha
Cronbach’s Alpha
based on
standardized items
N of items
,762 ,802 5
2.6.3 Variable Attitude of User Behavior
Table 8. Test results of the validity of behavioral behavior
variable of the user
X-C
Person
correlation
C1 .722**
C2 .541**
C3 .472**
C4 .632**
X-C 1
N 54
Analysis of Acceptance of Online KRS using Technology Acceptance Model (TAM) Method: Case Study of STMIK Cipta Darma Surakarta
Student
3057
In table 8 it can be seen that all statement items
are marked (flag) which means that all items can be
declared valid.
In reliability testing all items used in measuring
the benefit variable yield reliability coefficient
(cronbach's alpha) of 0.652. Value of reliability
coefficient is greater than the benchmark value of 0.6,
so it can be said that the indicators used to measure
the variable benefits are expressed to have high
reliability.
Table 9. Reliability test results of user behavior attitudes
Cronbach’s
Alpha
Cronbach’s Alpha
based on
standardized items
N of items
,652 ,748 5
2.7 Multiple Linear Regression Test
2.7.1 Correlations
It is the result of data processing with multiple linear
regression analysis using SPSS application. This
output is used to show the relationship partially
between independent variables with the dependent
variable. The results of Correlations in this study are
presented in table 10, it is known that the correlation
coefficient (r) between variable A-Use (PE) and C-
Admission (BI) variable is 0.542. While the
correlation coefficient between variables B- Ease
(PEU) with C-Reception (BI) is equal to 0.636. The
result showed that in the sample of 55 respondents,
the independent variables (A and B) partially have a
direct (positive) relationship with the dependent
variable (Y), where the closeness of the relationship
is strong.
Table 10. Result corellation
BI PE PEU
Pearson
correlation
BI 1.000 .542 .636
PE .542 1.000 .641
PEU .636 .641 1.000
Sign
(1-tailed)
BI . .000 .000
PE .000 . .000
PEU .000 .000 .
N BI 55 55 55
PE 55 55 55
PEU 55 55 55
2.7.2 Model Summary
Summary model shows the relationship together
between independent variables with dependent
variable. The relationship shows that the correlation
coefficient is R = 0.618. This means that together A
and B have a strong relationship with C. While the
determination is (R2) = 0.399, it means that together
A and B are able to explain the variation of C change
by 39%.
3 CONCLUSIONS
Based on the analysis that has been done before, can
be drawn some hypothesis and conclusions related to
the analysis of acceptance of online krs using TAM
as described earlier, that is
• Perceived Ease of Use has a positive effect on
the acceptance of KRS online information
system. This hypothesis is seen based on the
increasing increment of ease of KRS online
information system owned, increasing the
system acceptance by the users of the system.
• Perceived Usefulness has a positive effect on
the acceptance of KRS online information
system. This hypothesis is seen based on the
increasing use of online KRS information
system owned, increasing the system
acceptance by users of the system.
Perceived Ease of Use and Perceived Usefulness
together have a positive effect on the acceptance of
KRS online information system. This hypothesis is
the most acceptable statement, because based on the
analysis that has been done, the addition of usefulness
and usefulness possessed by the online KRS
information system will further increase the user's
confidence in receiving and using the information
system.
REFERENCES
Fatmasari; Dewi, Ratna; Kunang, Yessi Novaria. 2013.
Evaluasi Penerimaan Sistem E-KTP DENGAN
Menggunakan TAM (Technology Acceptance Model )
(Studi Kasus : Kantor Camat Ilir Timur I Palembang).
Seminar Nasional Informatika 2013 (semnasIF 2013)
ISSN: 1979-2328 UPN ”Veteran” Yogyakarta, 18 Mei.
Fatmasari; Muhamad Ariandi. 2008. Penerapan Metode
Technology Acceptance Model (TAM) Terhadap
Penerimaan KRS Online (Studi Kasus : Mahasiswa
Ilmu Komputer Universitas Bina Darma Palembang).
Jurnal Imiah MATRIK Vol95. No12. Hal. 1 -20, April.
Jogiyanto. 2007. Sistem Informasi Keperilakuan. Penerbit
Andi.
Marini; Sarwindah. 2017. Analisis Model Penerimaan
Teknologi (Technology Acceptance Model) Aplikasi
ICRI 2018 - International Conference Recent Innovation
3058

BPJS Online. Jurnal Edukasi dan Penelitian
Informatika. Vol.3. no.1
Monalisa, Siti; Setia, Dwi Putri. 2016. Analisis
Penerimaan Sistem Informasi Pengolahan Data
Statistik Rutin (SISR) Menggunakan Metode
Technology Acceptance Model (Studi Kasus: BKKBN
Provinsi Riau). Jurnal Rekayasa Dan Manajemen
Sistem Informasi, Vol. 2, No. 1, Februari.
Oktofiyani, Rini; Nurmalasari; Anggraeni, Wakhyu. 2016.
Penerimaan Sistem E-Learning Menggunakan
Technology Acceptance Model (TAM) Study Kasus
Siswa/I Kelas X Di SMU Negeri 92 Jakarta. Jurnal Pilar
Nusa Mandiri Vol.XII, No. 1 Maret.
Permana, Putu Adi Guna. 2018. Penerapan Metode TAM
(Technology Acceptance Model) dalam Implementasi
Sistem Informasi Bazzar Banjar . Journal Speed –
Sentra Penelitian Engineering dan Edukasi – Volume
10 No 1.
Rosyida, Susy. 2017. Technology Acceptance Model (TAM)
Terhadap Penggunaan Internet dalam Berbelanja
Online. Jurnal Sistem Informasi STMIK Antar Bangsa.
Vol. VI. No.2 Agustus.
Sayekti, Fran; Putarta, Pulasna. 2016. Penerapan
Technology Acceptance Model (TAM) Dalam
Pengujian Model Penerimaan Sistem Informasi
Keuangan Daerah. Jurnal Manajemen Teori Dan
Terapan Tahun 9. No. 3, Desember.
Syafrizal, Agusdi; Ernawati; Dwiandiyanta, B.Yudi. 2015.
Penerapan Model Technology Acceptance Model
(TAM) Untuk Pemahaman Media Pembelajaran
Berbasis Multimedia Interaktif. Scientific Journal Of
Informatics, Vol. 2, No. 1, Mei.
Tileng, Kartika Gianina. 2015. Penerapan Technology
Acceptance Model Pada Aplikasi Edmodo Di
Universitas Ciputra Surabaya Menggunakan Analisis
Jalur. JUISI, Vol. 01, No. 01, Februari.
Analysis of Acceptance of Online KRS using Technology Acceptance Model (TAM) Method: Case Study of STMIK Cipta Darma Surakarta
Student
3059
