
The Factors That Causes Community Living at the Kapuas Riverside
Settlement, Pontianak City
Wisnu Sasongko
1
, Surjono
1
and Arini Wafia
1
1
Urban and Regional Planning, Engineering Faculty, Universitas Brawijaya, Malang, Indonesia
Keywords: Riverside-settlement, Place-attachment
Abstract: As a riverside community who live in Pontianak, they depend on their need for life on the Kapuas River and
become the reason for the appearance of civilization. Some of the problems arising from settlement activity
around the Kapuas River do not make the community want to move, but make them survive in the Kapas
riverside settlement. Therefore, a study of the underlying reasons for the community around the Kapuas River
is required to be attached to the settlement. This study aims to see the attachment of the community to the
location of the residence is measured using place attachment calculation in two dimensions, which is place
identity and place dependence. The second goal of this study is to find factors that cause community still livint
at Kapuas riverside settlement using factor analysis. Place attachment is done by validity and reliability test
then analyzed descriptive statistic. The result of the research shows that there is a “strong” place attachment
attributed to 3 groups of community factors surviving in the Kapuas riverside settlement, Pontianak city,
namely Jaminan Sosial-Budaya, Faktor Aksesibilitas, and Faktor Lingkungan-Shelter.
1 INTRODUCTION
One of the provincial capitals in Indonesia dubbed
the river city is the City of Pontianak located in the
province of West Kalimantan. Benefits of the
existence of rivers for human life, namely as a
provider of water and water containers to meet
household needs, environmental sanitation,
agriculture, industry, tourism, sports, defense,
fisheries, electricity generation, transportation, and
others. (PP 38/2011 concerning Rivers) While the
benefits of the existence of rivers for natural life are
as a water quality restorer, a distributor of floods, and
a major generator of flora and fauna ecosystems.
Settlements on the edge of the water emerged at the
beginning of Pontianak City civilization as evidence
of dependence on the Kapuas River. (Khaliesh, et. Al,
2012)
Some problems that arise due to settlement
activities around the Kapuas River, including: (1)
high building density; (2) buildings not habitable; (3)
rain for a long time also often causes puddles; (4) road
conditions are not feasible; (5) drinking water
problems; and (6) poor waste and sanitation
problems. Behind this, the Pontianak City community
chose to remain in the Kapuas River waterfront
settlement. Therefore, a study is needed regarding the
reasons underlying the communities around the
Kapuas River to have an attachment and remain in the
settlement. Still living in a location can be caused by
several things, namely social, economic, cultural,
physical and institutional factors. (Himbawan, 2010)
Therefore, research was conducted on the level of
community engagement with the location of their
place of residence, as well as the factors of
community survival to live in the waterfront
settlements of the Kapuas River, Pontianak City.
Research "The Factors That Causes Community
Living at The Kapuas Riverside Settlement,
Pontianak City" was carried out in 3 priority areas for
handling slum areas based on Pontianak City RKP-
KP 2016. The 3 areas in question are Tambelan
Sampit-Banjar Serasan, In Bugis-Tanjung
Downstream, and Central Siantan 1. These areas are
further divided into 6 villages where each region
consists of 2 villages.
728
Sasongko, W., Surjono, . and Wafia, A.
The Factors That Causes Community Living at the Kapuas Riverside Settlement, Pontianak City.
DOI: 10.5220/0009915407280735
In Proceedings of the 1st International Conference on Recent Innovations (ICRI 2018), pages 728-735
ISBN: 978-989-758-458-9
Copyright
c
2020 by SCITEPRESS – Science and Technology Publications, Lda. All rights reserved

Fig 1. Research study map
Figure 1. is a map of the location of the study area.
There are 6 villages that have river waterfront
settlements and at the same time become priority
areas for slum handling. Following Table 1. shows
the distribution of regions and villages included in
each research area.
Table 1. Research Area
No. Name of Area
Keluarahan
Tambelan
Sampit-
Banjar
Tambelan
1. Sampit
Serasan Area
Banjar Serasan
2.
Dalam Bugis-Tanjung Hilir Dalam Bugis
Area
Tanjung Hilir
3. Siantan Tengah 1 Area
Siantan Tengah
Siantan Hulu
Table 1. describes the division of kelurahan into
each region. The Tambelan Sampit-Banjar Serasan
area consists of Tambelan Sampit and Banjar Serasan
Villages. The area in Bugis-Tanjung Hilir consists of
Kelurahan Dalam Bugis and Tanjung Hilir. The
Central Siantan Area 1 consists of the Districts of
Siantan Tengah and Siantan Hulu
2 METHOD
2.1 Population and Sample
The study used an analysis unit in the form of
priority areas for slum handling. Determination of
samples using probability sampling with random
sampling technique. The study used a 10: 1
comparative analysis between the number of
respondents with factor analysis and 200 respondents.
The sample division is done by looking at the
percentage of each slum mission area which can be
seen in Table 2.
Table 2. Distribution of the number of respondents
Name of
Count of
Distribution
No.
%
of
Areas
Population
Respondents
Tambelan
Sampit-
1. Banjar 3.815 30,23
60
Serasan
Area
Dalam
2.
Bugis-
5.021 39,79
80
Tanjung
Hilir Area
Siantan
3. Tengah 1 3.782 29,97
60
Area
Total 12.618
100
200
2.2 Research Variables
The study used several analytical techniques in
the form of Place Attachment Analysis to measure
community boundaries with the study location,
Factor Analysis to reduce variables that could not be
used in the study location and classify variables into
groups of factors. Table 3. shows the place
attachment variables and the factors of the survival of
the community to live in the riverside settlements
used in the study.
Table 3. Research Variables
Purpose
Variabel
Knowing the relationship Place Attachment
between residents and the Place Identity
location
of
their Place Dependence
settlements above and on
the banks of the Kapuas
River, Pontianak City.
Determine
the
factors
o
f
Close to the market
the survival of
the
Close to Educational
The Factors That Causes Community Living at the Kapuas Riverside Settlement, Pontianak City
729
Purpose
Variabel
community to live in the Facilities
waterfront settlements o
f
Close to Health Facilities
the Kapuas River, Close to Public Service
Pontianak City. Facilities
Close to the Open Space
Close
to
places o
f
worship
Relations with the
Community
Culture descends
Close to family
Customs
Organization
The Appeal of the
Government
Condition / Construction
of Houses
Close to outdoors
Security Conditions
Ease of Access to Clean
Water
Ease in disposing o
f
waste
Ease in Waste Disposal
Fire Extinguisher
Economic Conditions
(Capital)
2.3 Place Attachment
Place attachment analysis is carried out in two
phases, namely validity and reliability testing
conducted before the field survey to test the
questions, then descriptive statistical analysis to
measure the place attachment level.
2.4 Validity and Reliability Test
Validity can indicate the extent to which the
research measuring instrument is able to identify the
object of research in accordance with the goal (valid
measure if it succesfully measures the phenomenon).
Reliability is used to determine the extent to which
the measurement results remain consistent, if the
measurement is done twice or more with the same
symptoms and measuring instruments. The validity
and reliability test survey uses 30 household
respondents. Research is said to be reliable if it has
instrument criteria with coefficient (r)> 0.6. A
research instrument is said to be valid, if:
1. If the product moment correlation coefficient
exceeds 0.3
2. If the product moment correlation
coefficient> r-table (α; n-2), n = number of samples
3. Sig value ≤ α
2.5 Statistic Descriptive
According to Guilani (2003), Halpenny (2006)
and Manzo (2003), there are 3 (three) components
discussed in place attachments namely place identity,
place dependence, and place affect. However, place
attachment research was identified using 2 (two)
components, including place identity and place
dependence following previous research from Doss
(2012), Ujang et al (2015), Williams and Roggenbuck
(1989), William and Vaske (2003) and Eder and
Arnberger (2012).
Questionnaires that have been tested are used to
measure place attachments with 200 KK respondents.
Place identity is a self dimension that determines an
individual's identity that is related to a place
physically. (Prohansky et al, 1983) Place dependence
is the level of importance of someone to use the
function of a place. (Stokols & Shumaker, 1981) The
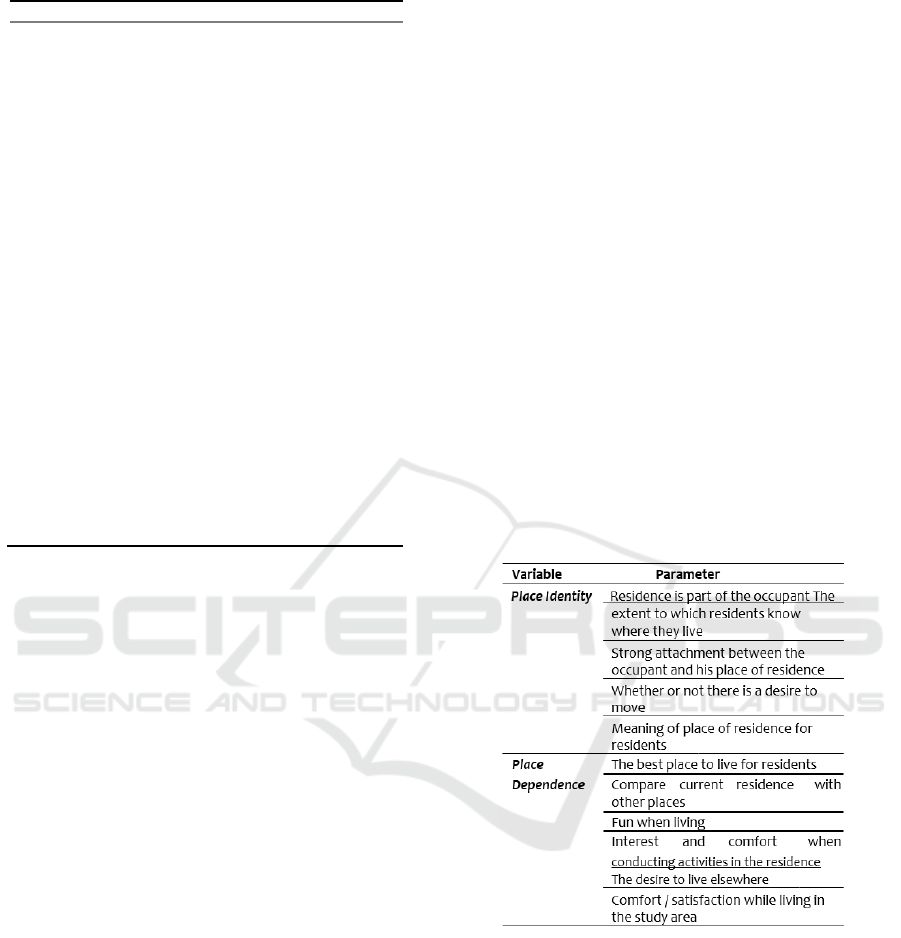
answer scale used is the Likert scale. Table 4.
Describes the parameters specified in place
attachment.
Table 4. Parameter of Place Attachment
The results of the place attachment value of
each respondent are processed by descriptive
statistics, namely by calculating the scale of the
answer, criterion score, rating scale value, frequency
of the answer scale, and determine the value of the
results. The answer scale used is the Likert scale. The
final score is used to see the answer on the rating scale
based on the criteria score. The following is Table 5.
which shows the criterion score in the study.
ICRI 2018 - International Conference Recent Innovation
730
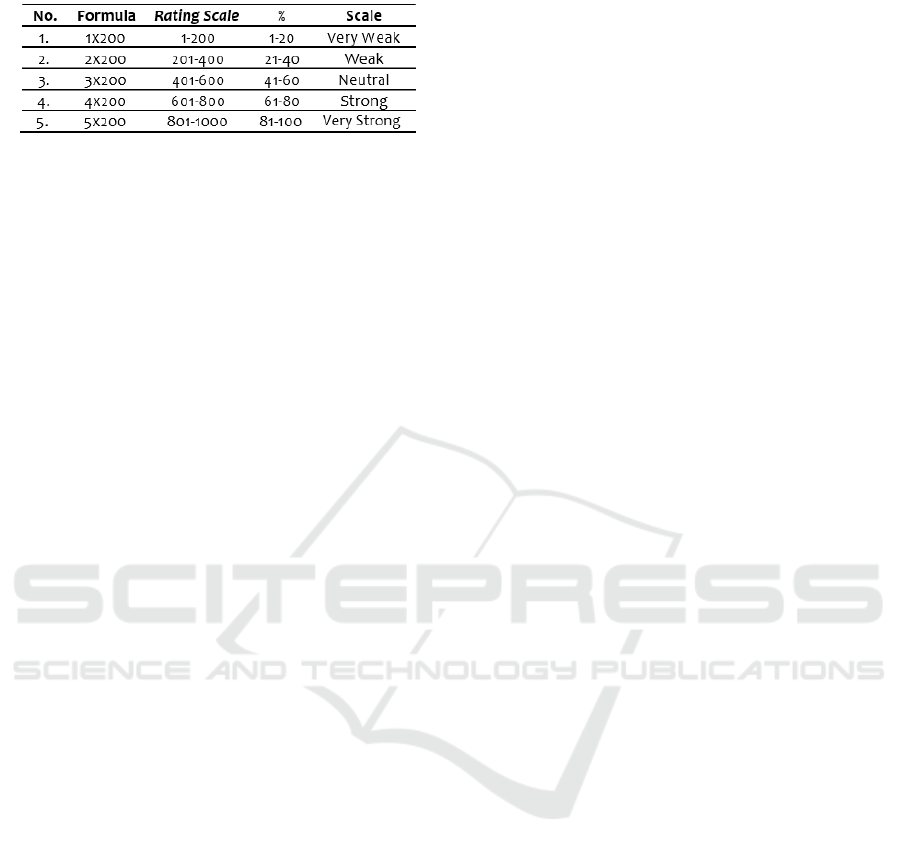
Table 5: Skor Kriterium
2.6 Factor Analysis
Research uses the EFA technique because it aims to
form factors from several existing variables. The
steps to perform Factor Analysis are as follows.
1. Convert ordinal data to intervals
2. Feasibility analysis of factor analysis
(KMO and Bartletts Test)
3. Variable reduction (anti-image matrics)
4. Communality
5. Factors formed
6. Factor group
The questionnaire used in the study uses a
Likert scale and produces ordinal data. Before a factor
analysis is carried out, data must be converted from
ordinal scale to interval scale. Furthermore, data from
factor analysis instruments were converted to interval
scale using the MSI (Method of Internal Success)
method so that it could be analyzed using further
analysis. (Sarwono, 2016)
3 DISCUSSION
3.1 Description of Study Area
Each sub-district in Pontianak City, 55 rivers and
ditches are passed by as a place to fulfill their needs.
Almost all areas of Pontianak City are within a radius
of 15 km from the river mouth located in the
lowlands. The priority areas that became the study
area consisted of Tambelan Sampit-Banjar Serasan
Region, In Bugis-Tanjung Hilir, and Central Siantan
1 (Figure 1 and Table 1) which had part of the Kapuas
River waterfront settlement. The height of Pontianak
City ranges from 0.10 to 1.50 masl (meters above sea
level) with a flat slope, which is less than 2% which
has a distance of about 1-2 meters above the water
surface.
3.2 Place Attachment
3.2.1 Validity and Reliability Test
Table R shows that respondents with N values of 30
have an R value of 0.349. The calculated R value
shows the results of 0.859-0.991 which is greater than
0.349 so that all instruments or questions place
attachment both place identity and place dependence
for interviews can be continued for the next process
because it has been declared valid.
The reliability test looks at the chronbach
alpha value that is conceptualized in an assessment.
The criteria for the instrument used must have a
coefficient (r) or a cronbach alpha value greater than
0.6. The results of a clear reliability test in measuring
place attachment instruments in this study resulted in
a reliability statistics value of 0.974. This value
means that the overall question instrument has been
reliable, stated to be very stable and consistent so that
it is then compiled in the form of a questionnaire.
3.2.2 Place Attachment Scale
The survey has been conducted using a Likert scale,
identifying the attachment of the waterfront
settlement community to its residence in the Kapuas
River, Pontianak City. The likert scale is determined
based on the average value of place attachment
results. Determination of the final results is seen using
the frequency of the appearance of each response
scale from respondents (KK units).
Calculation of place attachment scale of the
community of the Kapuas River waterfront
settlements, Pontianak City in Table 6. shows the
percentage of 71.55% included in the 4 or "Strong"
scale interval. Table 6. is an explanation of the results
of the scale on each place attachment question.
The Factors That Causes Community Living at the Kapuas Riverside Settlement, Pontianak City
731
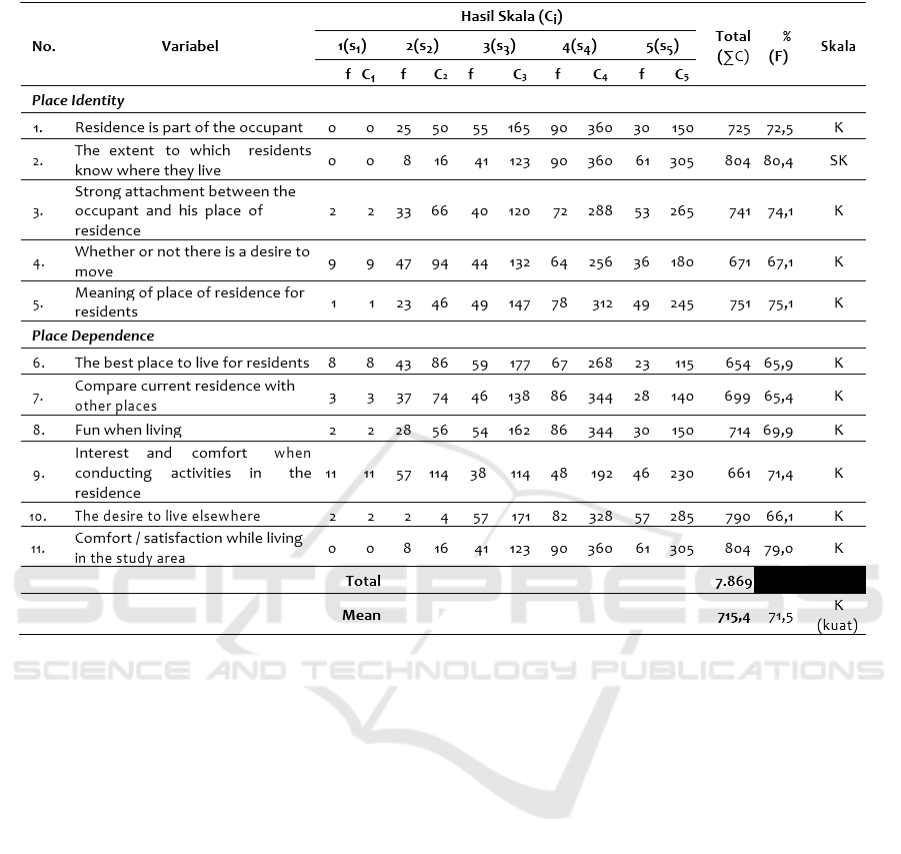
Table 6: Result of Place Attachment Scale
The value of the Kapuas River waterfront
settlement community, Pontianak City:
1. Having a positive emotional bond with the
environment in which he lives
2. Feeling depressed if separated from the
environment in which they live.
3. Feeling emotionally benefited from the
environment in which he lives
4. Know the environment in which he lives
properly so that he can interact and behave well
with the environment in which he lives.
5. Having emotional, cognitive, and functional ties
to the environment in which he lives.
The difference in place attachment values in each
region does not show a large value. Place attachments
in the Tambelan Sampit-Banjar Serasan Area are
72,6%, the Bugis-Tanjung Hilir Area is 70,5%, and
the central Siantan Region 1 is 71,8%, all of which
are in the strong category.
The result of place attachment that has a strong
value proves that the community does not want to
move and stay at the waterfront settlement of the
Kapuas River, Pontianak City. Therefore, factor
analysis can be continued to underlie the reason for
the survival of the community to remain in the
waterfront settlements of the Kapuas River,
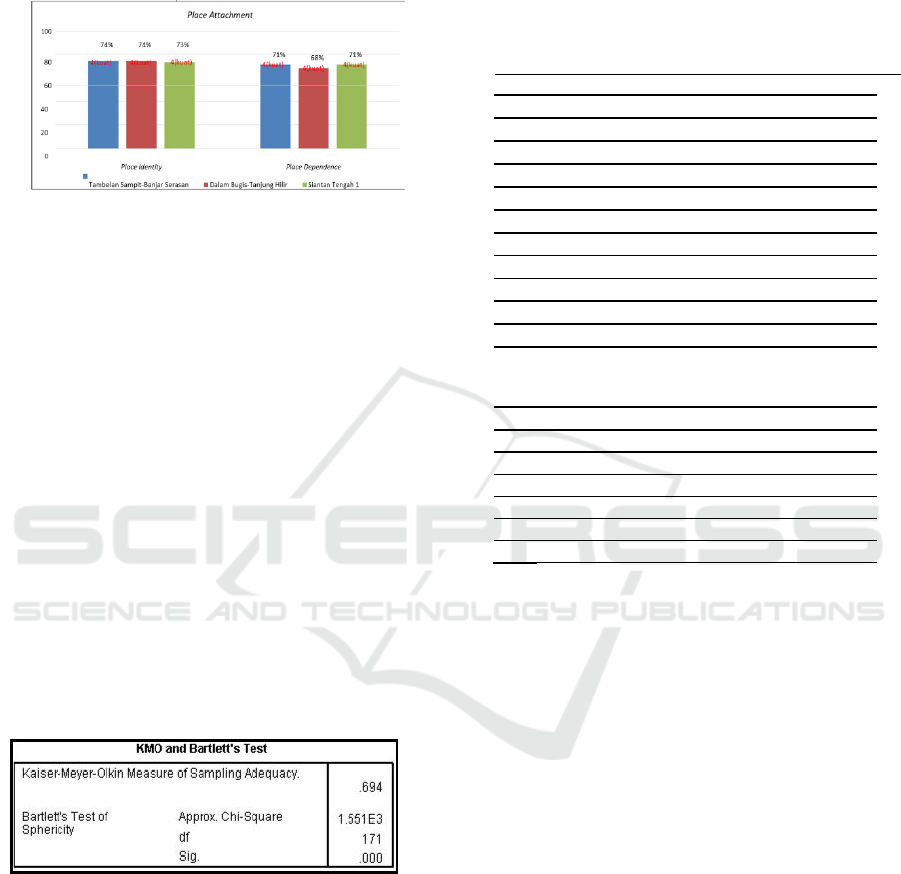
Pontianak City. The difference in place attachment
assessment for each location can be seen in Figure 2.
The calculation of place attachment scale answers
to the waterfront settlement community, Kapuas
River Tambelan Region Sampit-Banjar Serasan, In
Bugis-Tanjung Hilir, and Central Siantan 1 shows the
percentage of 71.55%, 70.5%, and 71.8% that go into
area interval scale 4 or "Strong". This causes the
Kapuas River watershed community in each region to
have a self-identity that can be described in their
environment and their daily activities depend on the
"strong" environment and show that the community
is considered to feel that the waterfront settlements of
the Kapuas River, Pontianak City are part of
themselves. The result of place attachment that has
strong value proves that the community does not want
to move and stays at the waterfront settlement of the
Kapuas River, Pontianak City. Therefore, factor
analysis can be continued to underlie the reason for
ICRI 2018 - International Conference Recent Innovation
732
the survival of the community to remain in the
waterfront settlements of the Kapuas River,
Pontianak City.
Figure 2. The result of the place attachment (place identity
and place dependence)
3.3 The Causative Factor of
Community Living at the Kapuas
Riverside Settlement, Pontianak
City
Variables that have been determined by several
sources, then submitted to 200 respondents who live
in the waterfront settlements of the Kapuas River,
Pontianak City. Data obtained from respondents in
the form of an ordinal scale need to be converted into
the form of interval scale using the MSI method.
3.3.1 KMO and Bartlett’s Test
The Bartlett's sphericity test is used to show the
correlation between variables as a whole. The KMO
test shows the data adequacy requirements so that it
can be used in factor analysis. The following is Figure
3. which is a cut of the results of KMO and Bartlett's
Test acquisition analysis in the SPSS application.
Bartlett's Test of Sphericity coefficient is 1.551E3
or equal to 12.664, with 171 degrees of freedom, and
0.000 significance so that the overall correlation
between variables is significant at the 0.01 level and
has met the requirements of factor analysis. The
results of the Kaiser-Meyer-Olkin Measure of
Sampling Adequacy test give a value of 0.694 which
indicates that there has been a sample adequacy so
that it meets the requirements for the factor analysis
process and can be further analyzed.
3.3.2 MSA Value
The MSA value in the Anti-Image Correlation table
in SPSS is used to determine which variables are
reduced and variables that can be further analyzed.
Table 7. MSA Value
No.
Factors
MSAValue
1.
Closetothemarket
0,735
2.
ClosetoEducationalFacilities
0,692
3.
ClosetoHealthFacilities
0,753
4.
ClosetoPublicServiceFacilities
0,692
5.
ClosetotheOpenSpace
0,674
6.
Closetoplacesofworship
0,623
7.
RelationswiththeCommunity
0,814
8.
Culturedescends
0,733
9.
Closetofamily
0,746
10.
Customs
0,709
11.
TheAppealoftheGovernment
0,547
12.
Condition/Constructionof
0,712
Houses
13.
Closetooutdoors
0,596
14.
SecurityConditions
0,609
15.
EaseofAccesstoCleanWater
0,691
16.
Easeindisposingofwaste
0,627
17.
EaseinWasteDisposal
0,623
18.
FireExtinguisher
0,614
19.
EconomicConditions
0,680
Table 7 explains that the value of MSA = 1, the
variable can be predicted without error by other
variables; if the MSA value is> 0.5, the variables can
still be predicted and analyzed further; whereas if the
MSA value is <0.5, the variable cannot be predicted
further and cannot be further analyzed or excluded
from other variables.
The Factors That Causes Community Living at the Kapuas Riverside Settlement, Pontianak City
733

Table 8. Factors Groups
Factor Groups Variable
Component Matriks
Value
Culture Descends (X8) 0,919
1
st
Factor Relations with the Community (X7)
0,868
Security Close to family (X9)
0,803
Social – Culture Economic Conditions (Modal) (X19)
0,761
Customs (X10)
0,540
Close to places of worship (X6) 0,835
2
nd
Factor
Close to Public Service Facilities (X4)
0,842
Close to the Open Space (X5)
0,790
Accesibility
Close to Health Facilities (X3)
0,693
Close to Educational Facilities (X2)
0,398
Ease in disposing of waste (X16)
0,804
Ease in disposing of waste (X17) 0,778
Condition / Construction of Houses (X12)
0,476
3
rd
Factor
Fire Extinguisher (X18)
0,569
Security Conditions (X15) 0,524 Environment dan
shelter
Close to the market (X1)
0,456
The Appeal of the Government (X12)
0,325
Close to Work Place (X13) 0,342
Ease of Access to Clean Water (14)
0,300
There are variables that must be reduced and
cannot be used for further analysis, namely influential
organizations in the community. This happens
because the acquisition of the MSA value from the
organizational variable does not reach a value of 0.5,
which is only 0.344. Therefore, organizational
variables are excluded from the next calculation and
there are 19 variables that can be continued for the
next process.
3.3.3 Factor Groups
The number of factor groups is set at 3 factors. The
Component Matrix table provides information on the
number of factors that are formed and which variables
enter the first, second, and third factors. Two rotation
steps were taken to determine the group of factors,
namely the varimax method and quartimax method.
Giving names to all three factors is based on
subjective judgments of the characteristics of each
group member of each factor. The results of 19
variables that have been reduced and grouped into 3
factors can be seen in Table 8. as follows.
4 CONCLUSION
Conclusions from the research Factors That Caused
the Community to Survive in the Settlement of the
River Basin of Kapuas, Pontianak City includes the
results of the attachment between the community and
their place of residence that is "4" or has a strong
attachment to their place of residence. The
community's attachment to the place of residence that
has a strong value indicates that the community is at
home in the study location. Factors of community
survival to live in river water settlements are the
Socio-Cultural Assurance Factors, Accessibility
Factors, and Environmental Factors - Shelter.
REFERENCES
DosS. Hailey B. The Examination of Place Attachment In
Camp Staff and Its Association With Connectedness to
Nature Over The Course Of A Seven Day Camp. Salem,
Virginia. Bachelor of Arts in Art. Roanoke College,
2012.
EdeR, Renate. Arnberger, Arne. The Influence of Place
Attachment and Experience Use History on Perceived
Depreciative Visitor Behavior and Crowding in an
ICRI 2018 - International Conference Recent Innovation
734

Urban National Park. Vienna. University of Natural
Resources and Life Sciences. 2012.
Halpenny, Elizabeth A. Pro-environmental behaviours and
park visitor: The effect of place attachment. Edmonton,
Canada. University of Alberta. 2006.
Himbawan, GigihPenyebab Tetap Bermukimnya
Masyarakat di Kawasan Rawan Banjir Kelurahan
Tanjung Agung Kota Bengkulu. Semarang. Universitas
Diponegoro. 2010.
Khaliesh, Hamdil. Widiastuti, Indah. Budi, Bambang Setia.
Karakteristik Permukiman Tepian Sungai Kampung
Beting di Pontianak. Malang. IPLBI, 2012.
Manzo, Lynne C. Beyond Home and Haven: Toward a
Revisioning of Emotional Relationship with Places.
Washington D.C, Amerika Serikat. University of
Washington. 2003.
Peraturan Pemerintah Republik Indonesia Nomor 38 tahun
2011 tentang Sungai.
Prohansky, Harold M. Fabian, Abbe K, Kaminoff, Robert.
Place Identity: Physical World Socialization of the Self.
New York, Amerika Serikat. University of New York.
1983
Sarwono, Jonathan. Tt. Mengubah Data Original ke Data
Interval dengan Metode Suksesif Interval (MSI).
www.jonathansarwono.info. Diakses pada 21 Juni
2018.
Stokols, Daniel. Shumaker, Salli Ann. The Psychological
Context of Residental Mobility and Well Being. Irvine,
California. University of California. 1981.
Ujang, Norsidah. 2004. Sense of Well-Being Indicators
Attachment to Public parks in Putrajaya, Malaysia.
Istanbul, Turkey. ASEAN-Turkey ASLI (Annual Serial
Landmark International) Conference of Quality of Life
2014.
Williams, Daniel R. Roggenbuck, Joseph W. Measuring
Place Attachment: Some Preliminary Results. San
Antonio, Texas. NRPA Symposium on Leisure
Research. 1989.
William, Daniel R. Vaske, Jerry J. The Measurement of
Place Attachment: Validity and Generalizability of a
Psychometric Approach. Colorado. Rocky Mountain
Research Station. 2000
The Factors That Causes Community Living at the Kapuas Riverside Settlement, Pontianak City
735
