
Structural Study of Al-doped ZnO Thin Films Produced by the
Sol-
g
el Techni
q
ue
F. Boufelgha
1,2
, N. Brihi
2
, A. Bouaine
2
, R. Zellagui
1
, N. Ouafak
1
and A. Boughelout
1
1
Research Center in Industrial Technologies CRTI, P. O. Box 64, Cheraga 16014, Algiers, Algeria
2
Laboratory of Condensed Matter and Nanomaterials Physics (LPMCN), Department of Physics, Faculty of Exact
b
oufel
g
halem
@y
ahoo.f
r
Keywords: thin films, spin coater, ZnO / Al, XRD, SEM, UV-Visible
Abstract: In this work we studied the effect of aluminum doping concentration on the structural properties of zinc
oxide thin films, we deposited samples of ZnO and aluminum doped ZnO with a doping rate of 1, 2, 3, 4
and 5%, on glass substrates by the spin coating technique. The structural characterization of the samples is
done by the XRD and SEM techniques, the XRD spectra show that the layers are polycrystalline with a
hexagonal würtzite structure, and a preferred orientation in the plane (002), and for the doping 5% the
structure is almost monocrystaline (002). SEM images are used to confirm grain sizes and surface
conditions. Optical characterization is done by UV-visible spectroscopy, gives a good visible transmittance
up to 80% and exceeds 90% for 2% doping, and the gap varies with the doping variation with a small gap
for the same doping (2%).
1 INTRODUCTION
In recent years, transparent and conductive
oxides (TCO) such as ZnO, find important
applications in new technologies. Since the
discovery at the beginning of the century of duality:
good electrical conductivity and good optical
transparency in the visible, research in the field of
TCO are really intensified from the 80s. Non-
toxicity and this great existence on earth are the
main advantages of ZnO, these advantages give the
possibility of reducing the manufacturing costs of
ZnO-based composites, in the massive state the ZnO
has several structures, among its structures, the
Würtzite structure is the most stable for ZnO, these
lattice parameters of the latter are: a = 0.3296 nm
and c = 0.5207 nm. It does not have a center of
symmetry. It can be deduced that this structure is an
insertion of two HC networks (the O2- and Zn2 +
network), with the displacement of the oxygen
network by a fraction of 0.38 the size of a unit cell
relative to ZnO is a degenerate semiconductor with
n-type conductivity, this conductivity is due in
particular to excess zinc in interstitial positions, with
a large direct gap (3.436 to 0 K and 3.2 eV at room
temperature). ). Its electrical properties can be
changed by heat treatment, or by appropriate doping,
the conductivity of ZnO can be increased by the
substitution of trivalent atoms for the positions of
the Zn atoms, and to reduce the conductivity the Zn
atoms can be substituted by monovalent atoms.
The methods of elaboration of the thin layers are
classified in two big categories: Physical methods
(Sputtering, Laser ablation, Evaporation under
vacuum), and Chemical methods (Spray pyrolysis,
Sol gel), in this work we prepared our layers by the
Sol-Gel method associated with spin coater.
2 EXPERIMENTAL PART
The ZnO layers are deposited based on a
solution that prepares as follows: zinc acetate
dihydrate [Zn (CH
3
COO) 2. 2H2O] (a concentration
of 0.4M / L) dissolved in a mixture of isopropanol,
ethanol and monoethanolamine, this mixture and
heated stirring with a temperature of 60 ° C for a
period of 2 hours. The dopant source (Aluminum) is
aluminum chloride (AlCl
3
). The deposit is made by
Boufelgha, F., Brihi, N., Bouaine, A., Zellagui, R., Ouafak, N. and Boughelout, A.
Structural Study of Al-doped ZnO Thin Films Produced by the Sol-gel Technique.
DOI: 10.5220/0009772001290132
In Proceedings of the 1st International Conference of Computer Science and Renewable Energies (ICCSRE 2018), pages 129-132
ISBN: 978-989-758-431-2
Copyright
c
2020 by SCITEPRESS – Science and Technology Publications, Lda. All rights reserved
129
the spin-coating technique (rotation of about 2500
rpm) for 30s, and drying between each 2 layers at
200 ° C for 10 minutes, and a final annealing at 600
° C for 3 hours.
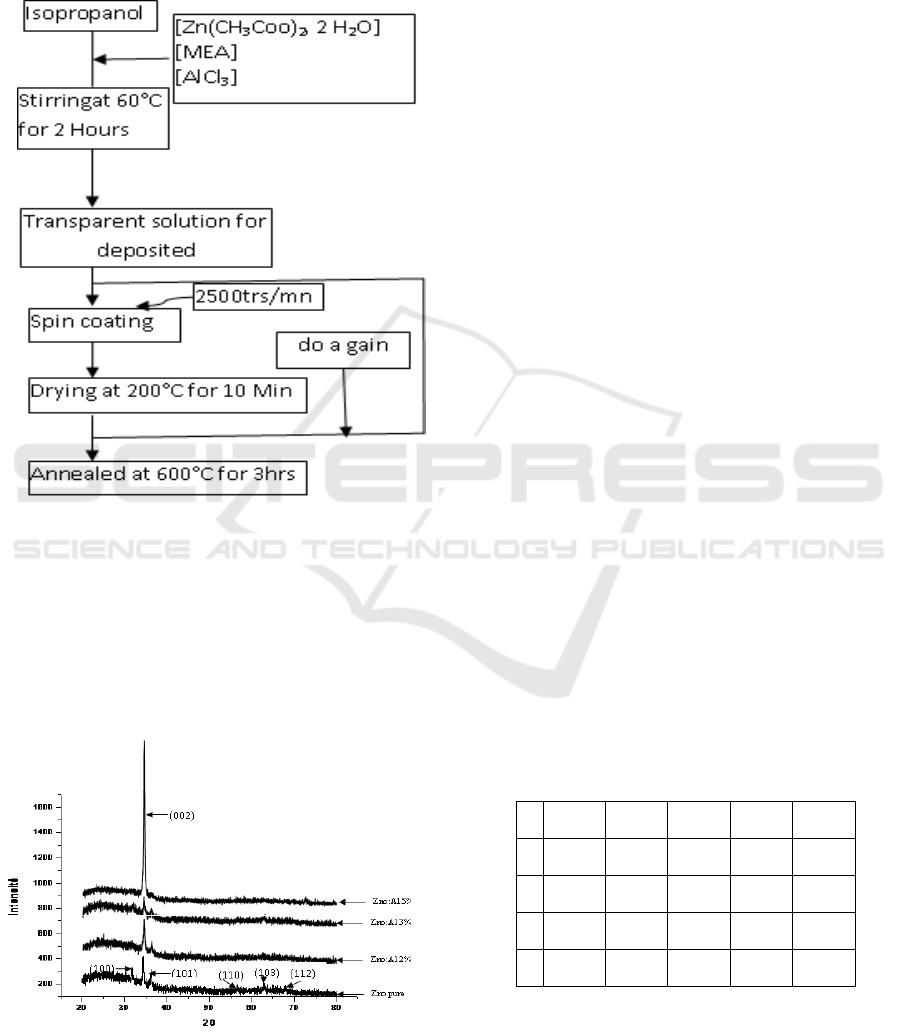
We can schematize the steps followed for the
preparation of our samples as follows:
Fig.1 Schematization of the steps followed for the
elaboration of our samples.
3 RESULTS AND DISCUSSIONS
3.1 Structural Properties
Fig.2 ZnO DRX Spectra: Pure, Doped Aluminum 2, 3 and
5%
Fig.2 shows the X-ray spectra of thin layers of
zinc oxide, deposited by the sol-gel method (spin-
coating technique), pure samples, doped with
aluminum with different concentrations 2, 3 and 5%.
The identification of the peaks is made by
comparing them with the diffraction angles found on
ASTM sheets 36-1451 (American Society for
Testing and Materials). The spectra affirm a
crystallization. For the ZnO which one can not speak
about a growth in a preferential direction (the
appearance of 3 peaks of the same intensity) almost:
(100), (002) and (101), in the case of ZnO doped on
speaks of growth in a preferential orientation
according to the direction (002). One can speak to
almost total growth in the (002) direction for the 5%
concentration. These results confirm the results
found by F. Chouikh for pure and Al doped ZnO
samples deposited by the pyrolysis spray technique.
Texture
For the purpose of checking the preferred
orientation, the ratio R
xi
which is given by:
∑
For pure ZnO: there are 5 peaks with the
concentrations: I
(100)
=283, I
(002)
=450, I
(101)
=251,
I
(103)
=258, I
(112)
=164,
R
(100)
= I
(100)
/[ I
(100)
+ I
(002)
+ I
(101)
+ I
(103)
+
I
(112)
]=283/1306=0.217
R
(002)
= I
(002)
/[ I
(100)
+ I
(002)
+ I
(101)
+ I
(103)
+
I
(112)
]=450/1306=0.344
R
(101)
= I
(101)
/[ I
(100)
+ I
(002)
+ I
(101)
+ I
(103)
+
I
(112)
]=251/1306=0.192
R
(103)
= I
(103)
/[ I
(100)
+ I
(002)
+ I
(101)
+ I
(103)
+ I
(112)
]=158/1306=0.121
R
(112)
= I
(112)
/[ I
(100)
+ I
(002)
+ I
(101)
+ I
(103)
+
I
(112)
]=164/1306=0.126
in the same way, we find:
Table 1: Texturing variation of orientations for each
doping rate.
(100) (002) (101) (103) (112)
0 0.217 0.344 0.192 0.121 0.126
2 0.000 0.832 0.088 0.080 0.000
3 0.000 0.847 0.072 0.081 0.000
5 0.000 0.850 0.087 0.000 0.063
For the undopedZnO, the growth does not have a
preferential direction, we notice the appearance of
the peaks (lines): (100), (002), (101), (103) and
(112) with almost the same concentrations
ICCSRE 2018 - International Conference of Computer Science and Renewable Energies
130
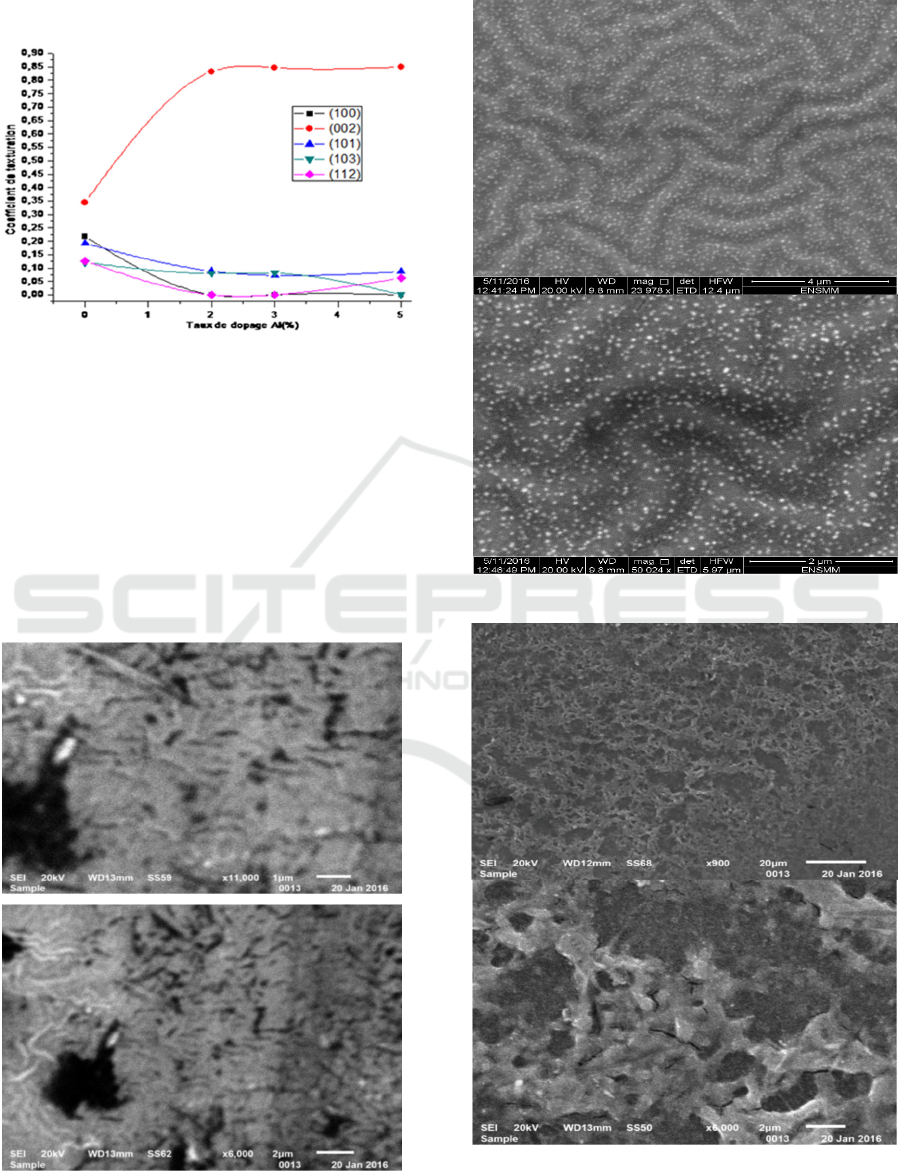
(intensities), this non-texturing is similar to the
surface energies of the three lines.
Fig.3 Variation of texture coefficients according to doping
rates.
In the case of doped ZnO, an increase in the
texture coefficient of the line (002) as a function of
ZnO doping rate with Al is observed, a maximum
texturing (R (002)) is observed on the line (002) for
the concentration 5%.
3.2 Morphology of the Layers
Fig 4, 5 and 6 show the SEM images of aluminum
doped ZnO samples by percentages 2%, 3% and 5%
respectively.
Fig.4 ZnO/Al 2%
Fig.5 ZnO/Al 3%
Fig.6 ZnO/Al 5%
The SEM images show a homogeneity of the
morphology of the surface of all the samples.
Structural Study of Al-doped ZnO Thin Films Produced by the Sol-gel Technique
131
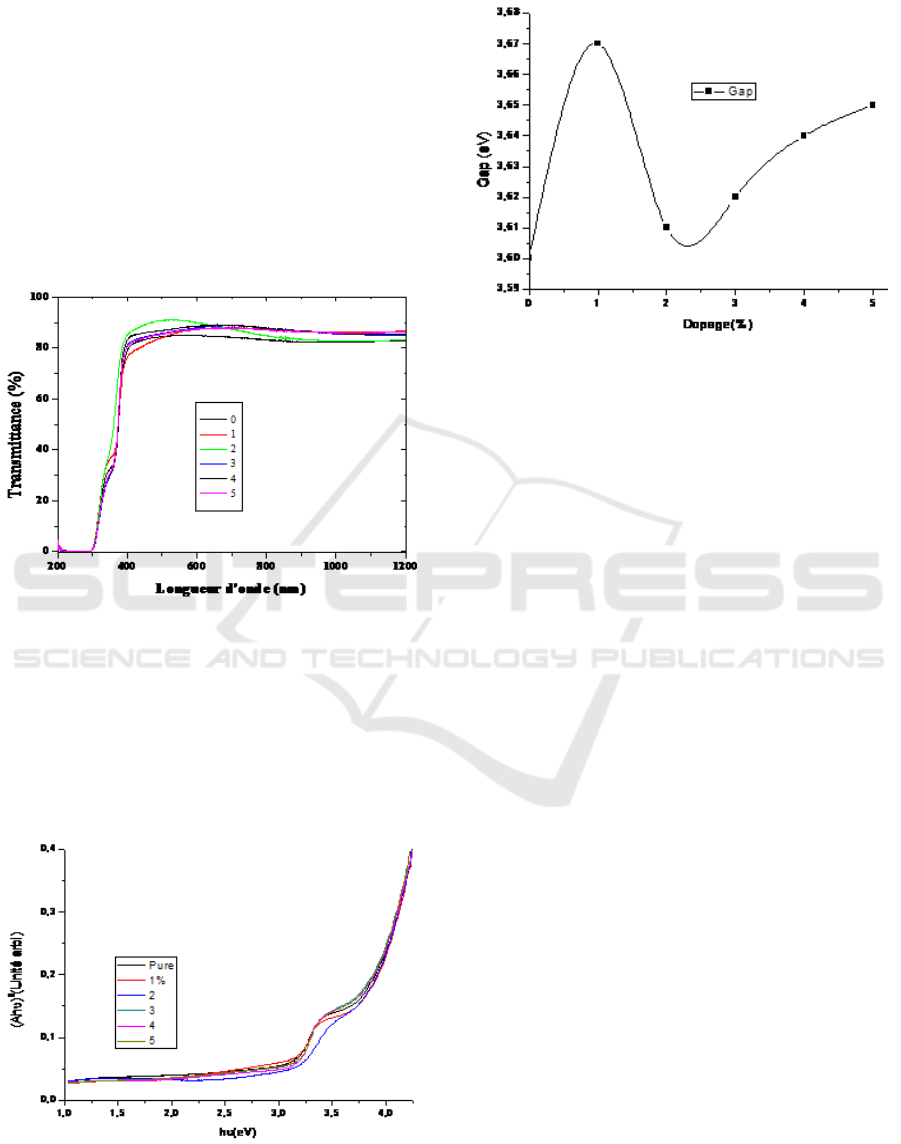
Fig.4 (2% doping) has a homogeneous can with
the presence of rod-shaped relief.
Fig.6 (5% doping) has a melted and porous
layer showing the presence of some microcracks at
the surface.
For Fig.5 (3% doping) has a completely
homogeneous layer, with the presence of shape
grains.
3.3 Optical Properties
Fig.7 represents the UV-visible spectra of
aluminum doped ZnO samples (Al) in percentages 1,
2, 3, 4 and 5%.
Fig.7 Transmittance spectra of ZnO and ZnO / Al (1,
2, 3, 4 and 5%)
The UV spectra show a transmittance higher
than 80% in the visible for all the samples, the
transmittance exceeds the 90% for the 2% doping,
one can hard that the latter to a better transmittance
compared to the others.
Fig.8 shows the optical Gaps of ZnO and ZnO /
Al (1, 2, 3, 4 and 5%).
Fig.8 ZnO and ZnO / Al Optical Gap (1, 2, 3, 4 and 5%)
Fig.9 shows the variation of the ZnO / Al gaps
Fig.9 optical Gap variation of ZnO and ZnO / Al (1, 2, 3, 4
and 5%)
4. CONCLUSION
The thin layers of undoped and Al doped ZnO
were developed by spin-coater-associated sol-gel
methods on glass substrates. Aluminum doping
changes the properties of our layers (structural and
optical). the results of the XRD show a preferential
orientation according to the plan (002). The UV-
Visible results show a transmittance of over 80%.
Note for concentration 5% the crystal and almost
mono
.
REFERENCES
Chouikh Fathi et al, paperexposed on Vème Congrès
International sur les Energies Renouvelables et
l’Environnement, Sousse ,Tunisie,04-06 Novembre,
E.Heredia et al, Applied Surface Science 317 (2014) 19-25
M. Sahal and al, Afrique SCUENCE 02(3)(2006) 245-154
N.JabenaBegum et al. Superlattices and Microstructures
53 (2013) 89-98
R. Sankarganesh et al, Journal of Alloys and Compounds
698 (2017) 555-564
S.Fernandez et al, Thin Solid Films 517 (2009) 3152-3156
Youssef Ammaihet al.Opt Quant Electron (2014) 46:229–
234
ICCSRE 2018 - International Conference of Computer Science and Renewable Energies
132
