
Analysis of Poverty, Regional Tax and Economic Growth on HDI
District/City in North Sumatra
Evi Syuriani Harahap
1
, Indra Maipita
1
and M. Fitri Rahmadana
1
1
Faculty of Economics, Universitas Negeri Medan, Medan -Indonesia
Keywords: Poverty, Regional Taxes, Economic Growth, HDI
Abstract: This study aims to analyze Poverty, Regional Taxes and Economic Growth on HDI District/City In North
Sumatra. The analytical model used in this study is panel data analysis using time series data from 2013 to
2016 while the cross section data is 33 District/City in North Sumatra. From the estimation results show that
poverty has a negative influence on HDI, regional taxes have a positive influence on HDI and economic
growth has a positive influence on HDI. This means that an increase in poverty will comply with the HDI,
and an increase in regional taxes and economic growth will increase the HDI of District/City in North
Sumatra.
1 INTRODUCTION
The development paradigm that is currently
developing is economic growth as measured by
human development, seen by the level of quality of
human life in each country. One of the benchmarks
used in looking at the quality of human life is the
Human Development Index (HDI) which is
measured by the quality of education, health and
economic levels (purchasing power). Through the
improvement of these three indicators, it is expected
that there will be an increase in the quality of human
life. This is due to the existence of individual
heterogeneity, geographic disparity and the diverse
social conditions of the community, causing income
levels to no longer be the main benchmark in
calculating the success rate of development (Ananta,
2013).
Placing human development as the ultimate goal
of the development process is expected to create
opportunities that directly contribute to efforts to
expand and improve human capabilities and the
quality of their lives, among others, through
improving health services, basic education and
social security (Sen, 1999). The government as the
executor of development certainly requires quality
human capital as the basic capital of development.
To produce quality human beings, efforts are needed
to improve their human resources. The human
quality can be measured through the human
development index.
Regional tax is a financial source that comes
from the community in an area that will be used to
finance the needs of an area. The size of the tax paid
depends on the population and the potential of the
community in improving the economy. One way to
improve the economy is to improve the quality of
human resources as measured by the Human
Development Index (HDI). The higher the HDI in an
area, the more advanced the quality of human
resources which results in an increase in the
potential of the community in increasing their
economy which results in an increase in local taxes
as a result of economic activities. This is in line with
the research conducted by Fatmasari (2015) and
Saragih (2018) which states that regional taxes have
a significant effect on increasing the HDI value.
Economic growth is something that is often
associated with human development. The increase in
economic growth can enable increased output and
income in the future so that it will increase the HDI.
One of the most important development tasks is to
translate economic growth into an increase in human
development. Human development or the quality of
Human Resources (HR) is very important, efforts to
improve the quality of human resources in
development have become a necessity. Good quality
of human resources in a region has a role in
Harahap, E., Maipita, I. and Rahmadana, M.
Analysis of Poverty, Regional Tax and Economic Growth on HDI District/City in North Sumatra.
DOI: 10.5220/0009509506090615
In Proceedings of the 1st Unimed International Conference on Economics Education and Social Science (UNICEES 2018), pages 609-615
ISBN: 978-989-758-432-9
Copyright
c
2020 by SCITEPRESS – Science and Technology Publications, Lda. All rights reserved
609

determining the success of management
development in the region (Putra, 2015).
Poverty will prevent individuals from consuming
nutritious nutrition, get proper education and enjoy
the environment that supports healthy living. From
an economic point of view all of them will produce
less qualified human resources, or can be said to
have a low level of productivity. So that in
development this will affect the level of human
development in an area. This is consistent with the
research conducted by Mirza (2012) which states
that poverty has a negative effect on the Human
Development Index. This means that if the poverty
level rises, the HDI falls.
When viewed from the condition of North
Sumatra, the increase in Regional Taxes, GDRB was
followed by an increase in the Human Development
Index (HDI) but the poverty rate even increased in
2015. The following are GDRB data, poverty rates
and HDI in North Sumatra from 2013 - 2016.
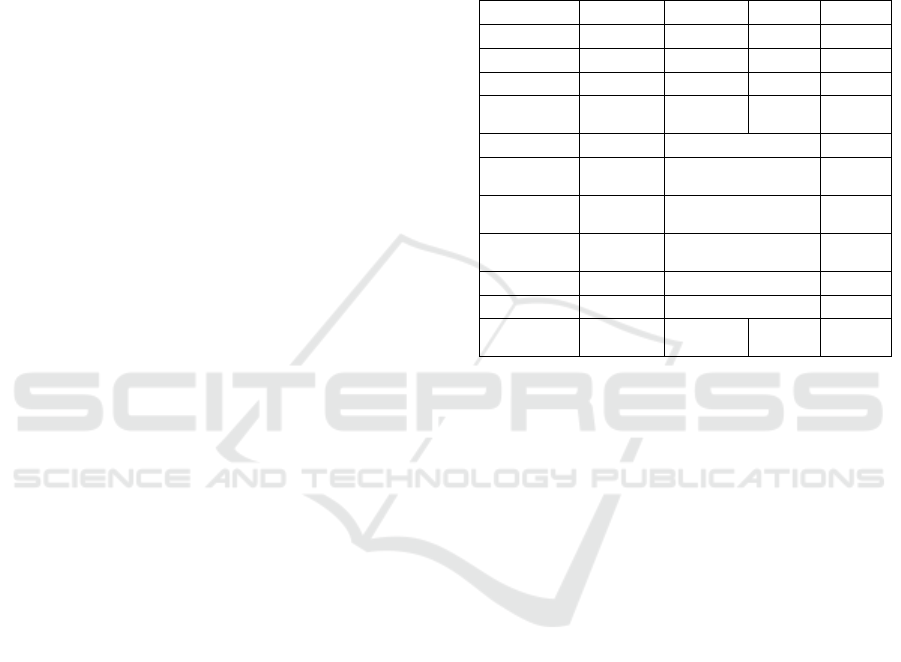
Table 1: Regional Tax Data, GDRB and Poverty in
North Sumatra
Source: Central Statistics Agency (CSA)
If seen from the table above, the increase in
regional taxes from 2013 - 2016 was followed by an
increase in GDRB and HDI. This was not followed
by a decrease in the number of poor people. In 2014
to 2015 the number of poor people increased from
1360610 to 1508140.
Based on the data and description above
regarding the human development index, economic
growth, poverty and local / regency / city tax in
North Sumatra, the authors are motivated to conduct
further research under the title Poverty Analysis,
Economic Growth and Regional Taxes on Regency /
City Economic Growth in North Sumatra ".
2 THEORICAL FRAMEWORK
Human Development Index (HDI)
The basic idea underlying this index is the
importance of paying attention to the quality of
human resources. HDI has played two key roles in
the field of economic development implemented: 1)
as a tool for popularizing human development as a
new understanding of welfare, and 2) as an
alternative to per capita GDP as a way to measure
the level of development for comparison between
countries and time (Elizabeth, 2007). To find out the
quality of life or welfare of the community, the
United Nations has determined the Human
Development Index (HDI) or Human Development
Index (HDI), which is a measure of human
development standards. This index is formed based
on four indicators namely: 1). life expectancy, 2).
literacy rates, 3). average school years and 4).
purchasing power. Life expectancy indicators
represent the dimensions of longevity and health
(health dimensions), while indicators of literacy and
school length reflect the output of the knowledge
dimension (education dimension). The indicators of
purchasing power ability (income) are used to
measure the dimensions of decent life (UNDP,
2004).
Poverty
Etymologically, "poverty" comes from the word
"poor" which means it is not material and is
inadequate. The Central Bureau of Statistics defines
as the inability of individuals to meet the minimum
basic needs for decent living (BPS, 2016) further
stated that poverty is a condition that is below the
standard line of minimum needs, both for food and
non-food called the poverty line or also called a limit
poverty. According to (World Bank, 2004) one of
the causes of poverty is due to lack of income and
assets to meet basic needs such as food, clothing,
housing, acceptable levels of health and education.
In addition, poverty is also related to limited
employment and usually those who are categorized
as poor do not have jobs (unemployment), and their
education and health levels are generally inadequate.
The measure of poverty is not only living in food
shortages and low income levels, but looking at the
level of health, education and fair treatment before
the law and so on (Adisasmita, 2005).
Economic Growth
In general, economic growth is defined as increasing
the ability of an economy to produce goods and
services. Economic growth shows the extent to
which economic activity will generate additional
income for the community in a given period.
Because basically economic activity is a process of
using production factors to produce output, then this
process will in turn result in a return of service to the
factors of production owned by the community.
With the economic growth, it is expected that
people's income as the owner of production factors
will also increase (Sukirno, 2006: 423). According
to Kuznets economic growth is a long-term increase
in the ability of a country to provide more and more
Years GDRB (Rp)
Proverty
(Person)
Regional
Tax (Rp)
HDI
(%)
2013 469464020000 1416400 1937261087 68.36
2014 521954950000 1360600 2050583195 68.87
2015 571722010000 1508140 2290986197 69.51
2016 628394160000 1452550 2407715357 70.00
UNICEES 2018 - Unimed International Conference on Economics Education and Social Science
610

types of economic goods to its population; this
ability grows according to technological progress,
and institutional and ideological adjustments that are
needed (Jhingan, 2010: 57).
Thus it can be concluded that developments in
economic activities are characterized by an increase
in the output of goods and services which impacts on
the increase in per capita income.
Economic growth is an increase in the output of
society caused by the increasing number of
production factors used in the production process,
without any change in "technology" production
itself, for example an increase in output caused by
the growth of capital stock or the addition of
production factors without changes in technology
long production (Arsyad, 2010).
The concept of calculating economic growth in
a period is:
𝐆
𝐭
𝐏𝐃𝐑𝐁
𝐭
𝐏𝐃𝐑𝐁
𝐭𝟏
𝐏𝐃𝐑𝐁
𝐭𝟏
Where:
Gt = period t economic growth (quarterly or
annual)
PDBRt = Real Gross Domestic Product period t
(based on constant prices)
PDBRt-1= PDBR one previous period
Local tax
Regional Regional Tax is a mandatory fee carried
out by an individual or regional head body without
balanced direct compensation, which can be forced
based on applicable laws and regulations and used to
finance the administration and regional development
(Prakosa, 2005). Measuring the success of regional
development in increasing the value of HDI, the
amount of PAB acquisition is one of the factors used
to see the successful implementation of regional
autonomy. PAD was chosen as one of the influential
factors, because this research was shown to look at
the financial performance of local governments in
supporting the implementation of regional
development. Regional taxes which act as regional
revenues will then determine the size of the PAB
acquisition and are used to support government
expenditures, one of which is shown to improve
social welfare. The effect of PAD on HDI will then
again affect the receipt of regional retribution. In
addition, the changes that occur in the GRDP value
will again affect the value of regional taxes, regional
levies and regional profits which act as sources of
regional revenue. From the explanation, it can be
concluded that there is a causal relationship between
regional revenue and the implementation of regional
development.
Effect of Poverty on the Human Development
Index (HDI)
The new growth theory emphasizes the importance
of the role of government, especially in improving
HDI and encouraging research and development to
improve human productivity. The reality can be seen
by investing in education will be able to improve the
quality of human resources as shown by the increase
in one's knowledge and skills. The higher the level
of education of a person, then the knowledge and
expertise will increase so that it will encourage an
increase in work productivity. Companies will get
more results by hiring workers with high
productivity, so the company will also provide
higher salaries to those concerned. In the informal
sector such as agriculture, increasing the skills and
expertise of the workforce will be able to increase
agricultural output, because skilled workers are able
to work more efficiently. In the end someone who
has high productivity will get better welfare, which
is shown through increased income and
consumption. The low productivity of the poor can
be caused by their low access to education (Rasidin
and Bonar, 2004).
The Effect of Economic Growth on the Human
Developmend Index (HDI)
The relationship between economic growth and
human development is influenced by 2 (two) main
lines, namely the path of household activities,
including households and various community
organizations, as well as shopping channels and
government policies. Household activities contribute
greatly to improving human development indicators
through household spending on food, clean water,
health care and schools (UNDP, 1996). The
tendency of household activities to spend a number
of factors that directly reduce human beings. Vice
versa, the relatively high level of income tends to
increase household spending to increase human
development (Ananta, 2013).
Economic growth provides direct benefits for
increasing human development through increasing
income. Increased income will increase the
allocation of household spending for more nutritious
food and education, especially for poor households
(Ranis, 2004).
Regional Tax Effects on the Human Development
Index
The decentralization policy is aimed at realizing
regional independence, autonomous regional
governments have the authority to regulate and
manage the interests of local communities according
to their own initiatives based on community
Analysis of Poverty, Regional Tax and Economic Growth on HDI District/City in North Sumatra
611

aspirations (Law No. 34/2004). The ability of
regions to provide funding originating from the
regions is highly dependent on the ability to realize
these economic potentials into forms of economic
activity that are capable of creating revolving funds
for sustainable regional development (Darwanto and
Yustikasari in Setyowati and Suparwati, 2012).
PAD is the most important source of financing in
supporting regional capacity in carrying out regional
autonomy. In this context, PAD as a measure of
regional own income is highly expected as a source
of funding for improving services to the community
(Abdullah and Solichin, in (Setyowati and
Suparwati, 2012).
3 RESEARCH METHOD
This study examines the analysis of poverty,
regional tax and economic growth in the Regency /
City Human Development Index in North Sumatra
during the period of 2013 to 2016. It always leads to
increased income. This is because the resources
generated by economic growth cannot be used to
promote the improvement of other indicators. In
addition, the structure and processes that occur in the
community cannot benefit the poor. For example,
various increases in yields only benefit landowners
and not laborers. However, the condition can
change. The poor can get multiple benefits from
income growth and increasing HDI if the
government wants to use the benefits of growth to
finance health services and access to education for
the poor. In addition, the structure and processes that
exist in the community are appropriate, so that the
benefits of economic growth are also enjoyed by the
poor. According to the World Development Report,
progress in both fields is mutually reinforcing each
other and one without the other is not enough
(Kanbur and Squire, 1999).
Types and Data Sources
The data in this study are secondary data obtained
from the North Sumatra Central Bureau of Statistics
which is panel data consisting of time series data
during the period 2013-2016 and cross section data
consisting of 33 regencies / cities in North Sumatra.
Analysis Method
In the model data panel model equation with a
combination of time series and cross section, the
model can be written with:
Y
it
= β
0
+ β
1
X
it
+ β
2
X
it
+ β
3
X
it
+ μ
it
Information:
Y = Human Development Index (HDI)
X1 ` = Poverty
X2 = Regional Tax
X3 = Economic Growth
β0 = intercept
β1, β0, β3 = independent variable regression
coefficient
μit = error component at time t
unit cross section i
i = 1, 2, 3, ...., 33 (district / city
cross section data in North Sumatra)
t = 1, 2, 3, 4 (time series data,
2013 - 2016)
There are three tests that can be used as a tool in
choosing a panel data regression model (Common
Effect Model, Fixed Effect Mode, and Random
Effect Model) based on the characteristics they have,
namely: F Test (Chow Test), Hausman Test and
Lagrange Multiplier Model .
a. F Test (Chow Test)
It is done to choose which model is the most
appropriate between the Common Effect Model
and the Fixed Effect Model. The basis of the
hypothesis is obtained by comparing the
probability values of Cross-Section Chi-Square.
If the Probability value < 0.05, Fixed Effect
Model is more appropriate to use than the
Common Effect Model. Whereas if the
Probability value > 0.05 then the Common
Effect Model is more appropriate to use than the
Fixed Effect Model.
b. Hausman Test
Is done to choose whether which model is the
most appropriate between Fixed Effect Model
or Random Effect Model. If the Probability of
Cross-Section Random < 0.05, Fixed Effect
Model is more appropriate than the Random
Effect Model. Whereas if the Probability value
> 0.05 then Random Effect Model is more
appropriate to use than the Fixe Effect Model.
c. Lagrange Multiplier Model
If the Chow Test model chosen is the Common
Effect Model while the Hausman Test model is
chosen by Random Effect Model, then to
determine which model is the most appropriate
between Common Effect Model or Random
Effect Model, the Lagrange Multiplier Model is
tested. The method used is Pagan Breusch. If
the P value is <0.05, the best estimation method
is the Random Effect Model. If the P value is >
0.05, the best estimation method is the Common
Effect Model.
UNICEES 2018 - Unimed International Conference on Economics Education and Social Science
612
Testing of Classical Assumptions
a. Multicollinearity Test
The multicollinearity test aims to test whether
the panel regression model found a correlation
between independent variables. A good model
is a model that does not have a correlation
between the independent variables. To test the
problem of muticolinearity can be seen from the
correlation coefficient of more than 0.80, there
is multicollinearity (Gujarati, 2006).Uji
Heterokedastisitas
b. Uji heterokedasticity
Used to see whether the residuals of the model
formed have a constant variance or not. A good
model is a model that does not occur
heterocedasticity. The heterocedasticity test
used in this study used the Glejser Test. The
Glejser test regresses the independent variables
to absolute residuals. The Glejser test only
applies to the Fixed Effect Model. Glejser Test
Results can be seen from the Probability value.
If the P value is < 0.05, there is
heterocedasticity. Conversely, if P value> 0.05,
it is free from violations of the assumption of
heterocedasticity.
c. Normality test.
The normality test aims to test whether in the
regression model the panels are normally
distributed or not. A good regression model is to
have normal data distribution. This can be seen
by comparing the value of Probability Jarque -
Bera (JB). If P value JB> 0.05 then the data is
normally distributed. Conversely, if P value JB
<0.05, the data is not normally distributed.
Hypothesis test
a. T test
The t test is used to test the independent
variables on the dependent variable partially.
This can be known from the prob value t count.
If the prob value is <0.05, the hypothesis is
accepted. Conversely, if the Prob value is> 0.05,
the hypothesis is rejected.
b. F test
The F test is used to test the relationship of
independent variables to the dependent variable
simultaneously. This can be known from the
prob value F count. If the prob value is <0.05,
the hypothesis is accepted. Conversely, if the
Prob value is> 0.05, the hypothesis is rejected.
c. Coeficient Determinan (R
2
)
The coefficient of determination is used to see
how much influence the independent variables
have on the dependent variable. The coefficient
of determination is determined by the adjusted
R-Square value. Table 2
4 RESULT AND DISCUSSION
Table 2:Panel Data Result
Variable Coeffici ent Std. Error t-Statistic Prob.
C 3.687909 0.048541 75.97551 0.0000
Log(Prover ty) -0.097306 0.009664 -10.06939 0.0000
Log(GD RP) 0.073514 0.007612 9.658163 0.0000
Log(Regional
Tax) 0.013555 0.004713
2.876176 0.0047
R-squared 0.613785 Mean dependent va
r
4.217612
Adjusted R-
squared 0.604662 S.D. dependent va
r
0.073225
S.E. o
f
regression 0.046041 Akaike info criterion -3.288525
Sum squared
resid 0.269207 Schwarz criterion -3.200733
Log likelihoo
d
219.3984 Hannan-Quinn criter. -3.252851
F-statistic 67.27757 Durbin-Watson sta
t
0.088255
Prob(F-
statistic) 0.000000
From the table of estimation results, the
regression equation in this study is made as follows:
Y
it
= 3.687909 – 0.097306 X
it
+ 0.073514X
it
+
0.013555X
it
+ μ
it
From the above equation, it can be explained as
follows:
a. The constant value is 3.687909, meaning that if
Poverty, Economic Growth and Regional Taxes
increase, the HDI will increase by 3.69%. Nilai
β
1
= - 0.097306, meaning that if the Poverty
variable rises by 1% while the Economic
Growth and Regional Tax variables remain then
HDI decreases by 9.7306% Sign (-) shows there
is a contradictory relationship between Poverty
and HDI. If poverty increases, the HDI will
drop.
b. b. The value of β2 = 0.073514, meaning that if
the Economic Growth variable rises by 1%
while the Poverty and Regional Tax variables
remain then HDI increases by 7.3514% Signs
(+) indicate that there is a unidirectional
relationship between Economic Growth and
HDI. If Economic Growth rises, the HDI will
rise.
c. The value of β3 = 0.013555, meaning that if the
Regional Tax variable rises by 1% while the
Poverty and Economic Growth variables remain
then the HDI increases by 1.3555% Signs (+)
indicates that there is a unidirectional
Analysis of Poverty, Regional Tax and Economic Growth on HDI District/City in North Sumatra
613
relationship between Regional Taxes and HDI.
If the Regional Tax increases, the HDI will rise.
Test Panel Data Model
a. Chow Test
Table 3: Chow Test Result
Effects Test Statistic d.f. Prob.
Cross-section
F 583.158537 (32,95) 0.0000
Cross-section
Chi-square 692.386875 32 0.0000
From the table it can be seen that the probability
value of the Chi-Square cross-section is 0,000 <0,05,
so it is concluded that the Fixed Effect Model is
more appropriate to use than the Common Effect.
b. Hausman Test
Table 4: Hausman Test Result
Test
Summary
Chi-Sq.
Statistic
Chi-Sq.
d.f. Prob.
Cross-section
rando
m
209.276642 3 0.0000
From the table it can be seen that the probability
value of the cross-section random is 0,000 <0,05, so
it is concluded that Fixed Effect Model is more
appropriate to use than Random Effect.
Classic assumption test
a. Multicollinearity Test
Table 5: Multicolinearity Test Result
log(p
eko)
Log(paja
k
daerah)
log(kemiski
n
an)
log(GDRP) 1 0.4029
351
0.306 8735
log(Regio
nal Tax)
0.402
9351
1 0.5091601
log(Prover
t
y
)
0.306
8735
0.509160
1
1
If the value of the independent variable is <
0.80, there is no multicollinearity between
independent variables.
b. Heteroscedasticity Test
Table 6: Heteroscedasticity Test Result
Variable Coefficient
Std.
Error
t-Statistic Prob.
C 12.48428 8.378710 1.490001 0.1395
Log(GD
RP
)
-1.103073 1.025723 -1.075410 0.2849
Log(Regi
onal Tax
)
-0.043890 0.095112 -0.461459 0.6455
Log(Pro
verty) -1.009355 1.435608 -0.703085 0.4837
From the table above it can be seen, the
probability value of the independent variable> 0.05
is free from violations of the assumption of
heterocedasticity.
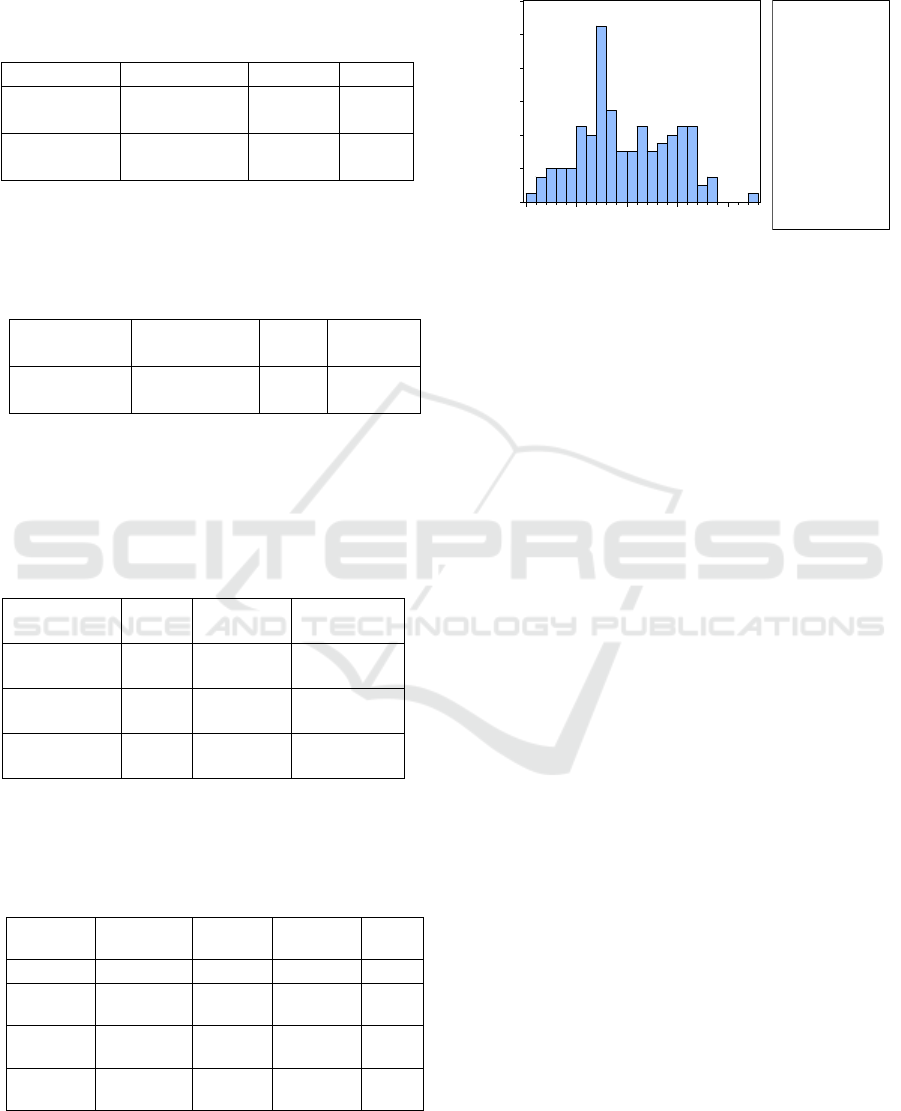
c. Normality test
0
4
8
12
16
2
0
2
4
-0.10 -0.05 0.00 0.05 0.10
Series: Standardized Residuals
Sample 2013 2016
Observations 131
Mean 1.01e-15
Median -0.007397
Maximum 0.127166
Minimum -0.090554
Std. Dev. 0.045506
Skewness 0.170942
Kurtosis 2.326530
Jarque-Bera 3.113683
Probability 0.210801
Figure 1: Normality Test Result
From the table it is known that the Jarque-Bera
Probability value is equal to 0.210801 where it is
greater than 0.05 so it is concluded that the data is
normally distributed.
Hypothesis testing
a. T test
From the results of testing the data obtained the
value of Prob (t-statistic) <α is equal to 0.0000 <0.05
for the poverty variable. Thus the poverty variable
has a negative and significant influence on the
District / City HDI in North Sumatra. So, the higher
the poverty, the lower the HDI Regency / City in
North Sumatra will be. The value of the Prob (t-
statistic) Economic Growth variable is 0.0000 <0.05.
With the value of the Prob (t-statistic) shows that the
variable economic growth has a positive and
significant effect on HDI. So, the higher the
economic growth, the higher the HDI district/city in
North Sumatra. The value of the Prob (t-statistic)
Regional Tax variable is equal to 0.0047 < 0.05.
With the Prob value (t-statistic) it shows that the
regional tax variable has a positive and significant
effect on HDI. So, the higher the regional tax, the
higher the HDI district / city in North Sumatra.
b. F test
The F test is used to test the relationship of
independent variables to the dependent variable
simultaneously. From the results of testing the data
obtained the value of Prob (F-Statistics) <α that is
equal to 0.000000 <0.05. Then the two independent
variables, namely poverty, economic growth and
local taxes jointly influence the HDI District / City
in North Sumatra.
c. Determinant Coefficient (R2)
The coefficient of determination is used to see how
much influence the independent variables have on
the dependent variable. The coefficient of
determination is determined by the adjusted R-
UNICEES 2018 - Unimed International Conference on Economics Education and Social Science
614

Square value. Based on the estimation results
obtained the value of R-Squared is equal to. This
shows that the variables of poverty, regional tax and
economic growth are able to explain the HDI
variable of 61.3785%. While the remaining
38.6215% is influenced by other variables not used
in this study.
5 CONCLUSIONS
Based on the results of the analysis and discussion
that has been conducted, the conclusions can be
taken as follows:
1. Partially, Poverty has a negative and significant
effect on HDI District / City in North Sumatra.
2. Partially, Economic Growth has a positive and
significant effect on District / City HDI in North
Sumatra.
3. Partially, Regional Taxes have a positive and
significant effect on District / City HDI in North
Sumatra.
4. Poverty, Economic Growth and Regional Tax
simultaneously have a positive and significant
effect on HDI District / City in North Sumatra
REFERENCES
Adisasmita, Rahadjo. (2005). Dasar-dasar Ekonomi
Wilayah. Yogyakarta: Graha Ilmu.
Ananta, Prayudha. (2013). Determinan Pembangunan
Manusia Provinsi Lampung. Tesis. FEB
Universitas Lampung.
Arsyad, Lincolin. (2010). Ekonomi Pembangunan.
Yogyakarta: STIM YKPN
Badan Pusat Statistik. Sumatera Utara (2016). Indeks
Pembangunan Manusia (IPM) Provinsi Sumatera
Utara. BPS Sumatera Utara. Diakses melalui
website: www.bps.go.id.
Elizabeth A. Stanton. (2007). The Human Development
Index: A History. Working Paper Series Number
127: Global Development and Environment
Institute Tufts University.
Fatmasari, Rahmi Budhy. (2015). Analisis Pengaruh Pajak
Daerah Terhadap Pelaksanaan Pembangunan
Daerah di Provinsi Jawa Tengah. Skripsi Fakultas
Ekonomi dan Manajemen Institu Pertanian Bogor.
Bogor.
Gujarati, D. (2004). Basic Econometrics. Fourth Editions.
New york: The McGraw Hill Companies.
Jhingan, M.L. (2010). Ekonomi Pembangunan dan
Perencanaan, Terjemahan. Penerbit Rajawali.
Jakarta.
Kanbur, Ravi dan Lyn Squire. (1999). The Evolution of
Thinking about Poverty: Exploring The
Interactions.
http://kanbur.dyson.cornell.edu/papers.htm.
Mirza, Denni Sulistio. (2012). Pengaruh Kemiskinan,
Pertumbuhan Ekonomi dan Belanja Modal
terhadap Indeks Pembangunan Manusia di Jawa
Tengah Tahun 2006 – 2009. Jurnal Ekonomi
Pembangunan.
Putra, Dwi. (2015). Pengaruh Dana Alokasi Umum, Dana
Bagi Hasil, Dana Alokasi Khusus dan Pendapatan
Asli Daerah Provinsi Bali. Jurnal Ekonomi
Pembangunan.
Prakosa, K. (2005). Pajak dan Retribusi Daerah.
Yogyakarta: UII Pr.
Ranis, Gustav. (2004). Human Development and
Economic Growth. Working Papers 887.
Economic Growth. New Haven: Yale Universi
Sen, Amartya. (1999). Development as Freedom. New
York: Anchor Books. Chicago
Saragih, Arfah Habib. (2018). Analisis Pengaruh
Penerimaan Pajak Daerah terhadap Indeks
Pembangunan Manusia. Jurnal Economia, Volume
14, Nomor 2, Oktober 2018.
Sukirno, Sadono. (2006). Pengantar Teori Makro Ekonomi
. Jakarta: Raja Grafindo Persada.
UNDP. (1996). Human Development Reports 1996. New
York: Oxford University Press.
UNDP. (2002). Arab Human Development Report 2002.
New York: United Nations Publications.
UNDP. (2004). Human Development Report. New York :
Oxford Univesity Press
World Bank. (2004). Definisi Kemiskinan. http:/ /www.
worldbank. Org (online). Diakses tanggal 2
Desember 2018
Analysis of Poverty, Regional Tax and Economic Growth on HDI District/City in North Sumatra
615
