
Analysis of Financial Ratio for Measuring the Average of the
Banking Industry Ratio Listed in LQ45
Titing Suharti
1
, Diah Yudhawati
1
and Siti Nadira Azzahra
1
1
Economic and Business Faculty, Universitas Ibn Khaldun
Keywords: Competencies Liquidity, Solvability, Rentability, Industry Ratio
Abstract: This study aims to determine the average financial ratios of the banking industry at PT. Bank Negara
Indonesia (Persero) Tbk, PT. Bank Central Asia Tbk, PT. Bank Rakyat Indonesia (Persero) Tbk, PT. Bank
Mandiri (Persero) Tbk in 2013-2017 from the aspect of financial ratios Liquidity, Solvability and
Rentability. The sampling of this study was obtained by purposive sumpling method. Data analysis method
measures the ratio of industry Quick Ratio, Inventory Policy Ratio, Primary Ratio, Capital Ratio, Net Profit
Margin, and Return On Equity. Types of quantitative data and data sources use secondary data. The results
showed that the average liquidity ratio of the banking industry for the 2013-2017 period for the Quick Ratio
of 13.21% and Investing Policy Ratio was 7.88%. For the Solvency Ratio, the average banking industry
ratio for Primary Ratio was 14.13% and Capital Ratio 25.50%. For profitability ratios, the average banking
industry ratio for Net Profit Margin is 80.48% and Return on Equity is 18.22%.
1 INTRODUCTION
Every company must want their business to run
smoothly and even develop. One of the successes of
a company can be measured based on its financial
performance. The financial performance of the
company itself can be analyzed through financial
statements that are presented regularly every period.
Accounting information in financial statements is
very important for users of financial statements in
evaluating past, present and future events.
Financial ratio analysis is an activity to analyze
financial statements by comparing one other account
in the financial statements, these comparisons can be
between accounts in balance sheet financial
statements and profit losses (Sujarweni, 2017, p.
59). Financial ratio analysis describes a relationship
and a comparison between the number of one
account and the number of other accounts in the
financial statements.
By using the ratio analysis method can explain or
give an idea of the good or bad state or position of
financial performance of a company. The financial
ratio used to measure the ratio of the banking
industry in this study is the Liquidity Ratio,
Solvability Ratio, and Profitability Ratio.
The Liquidity Ratio consists of Quick Ratio and
Investing Policy Ratio. This ratio shows how
quickly the company fulfills its financial obligations,
generally short-term liabilities or obligations that are
less than one year. Solvability ratio is a measure
used to see the ability of a bank to fulfill all its
obligations. Some of these ratios include Primary
Ratio, and Capital Ratio (CAR). Profitability ratio,
used to measure how much the ability of a company
to obtain profits in relation to sales. This ratio
includes Net Profit Margin, and Return On Equity.
Based on this background the author is interested
in conducting research with the title "Financial Ratio
Analysis to Measure Average Banking Industry
Ratios Registered at Lq45 (Case Study at PT Bank
Negara Indonesia (Persero), PT Bank Central Asia
Tbk, PT Bank Rakyat Indonesia (Persero), PT Bank
Mandiri (Persero) Tbk in 2013-2017). "
2 THEORICAL FRAMEWORK
Financial Management is a process in the company's
financial activities related to efforts to obtain
company funds and minimize company costs and
also financial management efforts of a business
entity or organization to be able to achieve
predetermined financial goals.
810
Suharti, T., Yudhawati, D. and Azzahra, S.
Analysis of Financial Ratio for Measuring the Average of the Banking Industry Ratio Listed in LQ45.
DOI: 10.5220/0009507208100816
In Proceedings of the 1st Unimed International Conference on Economics Education and Social Science (UNICEES 2018), pages 810-816
ISBN: 978-989-758-432-9
Copyright
c
2020 by SCITEPRESS – Science and Technology Publications, Lda. All rights reserved

According to Kamaludin and Indriani (2012, p.
1) Financial management is an effort and activity in
order to increase the value of the company and as an
effort to get funds in the most profitable way and
allocate funds efficiently in the company as a means
to achieve the target for shareholder wealth.
Efficient financial management requires goals
and objectives that are used as standards in
evaluating financial decision efficiency. To be able
to take the right financial decisions, financial
managers need to determine the goals that must be
achieved.
The overall goal of financial management in a
company is to maximize profits, maintain cash flow,
prepare capital structures, maximize utilization of
corporate finance, optimize company wealth,
improve efficiency, ensure the survival of the
company, reduce operational risk, and reduce capital
costs.
The size and importance of the financial
management function depends on the size of the
company. In small companies, financial functions
are generally carried out by the accounting
department. After the company developed, it
gradually became a department. The main function
of financial management is in terms of investment
decisions, funding decisions and dividend decisions
for a company or organization and even cooperatives
or even other agencies. These financial decisions are
implemented in daily activities to earn profits. Profit
obtained is expected to increase the value of the
company if the higher share prices, so that the
prosperity of shareholders by itself increases. The
financial management function includes three
financial management decisions. First, Investment
Decisions. Investment decisions are decisions on
assets that will be managed by the company. this
decision is most important because this investment
decision has a direct effect on the amount of
investment profits and the company's cash flow for
future times. Second, Funding Decision. Funding
decisions are financial management decisions in
carrying out consideration and analysis of the
combination of the most economical sources of
funds for the company to fund investment needs and
operational activities of the company. The funding
decision concerns the sources of funds that are on
the asset side. There are a number of things
regarding funding decisions, namely decisions
regarding the determination of the source of funds
needed to finance investments, and the
determination of the best balance of spending or
often called the optimum capital structure. Third,
Dividend Decision. Dividends are part of a
company's profits that must be paid to shareholders.
Dividend decisions are financial management
decisions in determining the amount of profit to be
shared with shareholders and funds to be deposited
in the company as retained earnings for the growth
of the company.
According to Wijaya (2017, p. 13) Financial
statements are business languages because in the
financial statements it contains information about
the company's financial condition to its users. Users
of financial statements are management, investors,
creditors, and other stakeholders related to the
company. Kamaludin and Indriani (2012, p. 34)
Financial Reports are the final results of a recording
process which is a summary of financial transactions
that occur during the relevant financial year.
Financial statements consisting of several sheets of
paper containing numbers. But behind these
numbers are stored various information ranging
from real assets, financial assets, corporate
liabilities, company profits, to future predictions of
what will be experienced by the company.
Financial statements are the end result of the
accounting process. Financial statements indicate the
position of resources owned by the company for one
period. In addition, financial statements show the
company's performance as indicated by the
company's ability to generate revenue with the
resources owned by the company. In the accounting
process identified various transactions or events
which are economic activities within the company
through measurement, recording, classification and
pengikhtisaran that produce information.
Information that is relevant and interconnected one
another can provide a proper description of the state
of the company and the results of the company's
operations that are combined and presented in the
form of financial statements.
In conducting financial statement analysis, it is
important for someone to analyze the types,
formulations and weaknesses in analyzing these
financial statements. Characteristics that must be
met by the information contained in financial
statements are set out in the basic framework of
preparing and presenting financial statements. In
general, there are five types of financial statements
that we know, namely: Balance Sheet, Income
statement, Capital change report, Cash flow report
and Notes / financial statements.
Every financial report made has a specific
purpose. In general, the financial statements of a
company, arranged at certain times and at certain
periods. The purpose of financial statements is
prepared to meet the interests of the company, so
Analysis of Financial Ratio for Measuring the Average of the Banking Industry Ratio Listed in LQ45
811

that financial statements can provide financial
information to parties inside and outside the
company that have an interest in the company. In
general, the purpose of financial statements is to
provide reliable financial information regarding
assets, liabilities and capital of a company, provide
financial information that helps users of financial
statements to estimate the company's ability to
generate profits, provide reliable information about
changes in net assets (assets reduced obligations) of
a company arising from business activities in order
to make a profit, Providing other important
information about changes in the assets and
liabilities of a company, such as information about
financing and investment activities, and put forward
other information relating to financial statements
that are relevant to the needs of report users , such as
information about the accounting policies adopted
by the company.
Financial statements are prepared or made with
the intention to provide an overview or report on
progress made by the management concerned. So
financial statements have a historical nature as well
as a whole and as a report. According to Kasmir
(2008, p. 12) financial statements have two
properties, namely first, is historical, meaning that
financial statements are made and arranged from
past or past data from the present. Second, it is
comprehensive, meaning that the financial
statements are prepared in accordance with the
standards set.
The financial statements have limitations,
namely financial statements that are made
periodically are basically internal reports (reports
made between certain times that are temporary) and
not a final report. Therefore all amounts or things
reported in the financial statements do not indicate
the value of liquidation or realization in which this
report contains personal opinions made by the
Accountant or Management concerned. Second,
financial statements show numbers in rupiah that
appear to be definite and appropriate, but actually
the basis for their compilation with standard values
may differ or change. third, financial statements are
prepared based on the results of recording financial
transactions or rupiah values of various times or past
dates where the purchasing power of the money
decreases, compared to previous years so that the
increase in sales volume expressed in rupiah does
not necessarily indicate the units sold are getting
bigger, maybe the increase was due to the increase
in the selling price of the item which might also be
followed by an increase in the price level. Fourth,
financial statements cannot reflect various factors
that can affect the position or financial condition of
the company because these factors cannot be
measured in units of money.
Parties who need information usually come from
the company's internal parties themselves and from
external parties or outside the company. Internal
Company, Internal parties are parties that are
directly related to the company's operational
activities. Usually this report is used to make policy
decisions by a manager. The company's strategic
decisions or plans that will be carried out to
maximize the company's profits. Company External
Parties, Users of financial statements are not only
important for internal parties, but there are other
financial statement users including: Investors,
investors or investors have the right to know the
results of their investments and need information
that can help them make a profit, whether they
should buy, plant or sell the investment. Employees,
employees or groups that represent them also need
information about the stability and profitability of
the company. They also know information that
allows employees to provide remuneration (wages),
assess the ability of the company, find out
information about pension benefits and information
on employment opportunities. Creditors, creditors or
lenders are also interested in obtaining information
on whether the loans they have given and their
interest can be paid when they are due. Suppliers
and Business Creditors, Suppliers or partners also
need financial statement information that allows
them to be able to decide whether the outstanding
amount will be paid at maturity. Business creditors
need information if the company that is owed is the
main customer and their survival depends on the
company. The government, the Government requires
the company's financial statements regarding taxes
to regulate its activities, compile statistics for the
interests of the state, and most importantly, establish
tax policies.
There are four limitations to these financial
statements according to Jumingan (2017, pp. 10–11),
namely first, financial statements are basically
interim reports, not final reports, because real profit
and loss (final income) can only be determined if the
company sold or liquidated. For this reason financial
statements need to be prepared for a certain period
of time. One year is generally considered a standard
accounting period. Allocation of revenue and cost
over a certain period is influenced by personal
considerations. For example in choosing the final
inventory valuation method, determining the amount
of depreciation, depletion, amortization, and losses
due to uncollectible accounts receivable, the
UNICEES 2018 - Unimed International Conference on Economics Education and Social Science
812

separation between capital expenditure and income
expenditure. So, it is clear that in fact the financial
data is not definite, cannot be measured absolutely
studied, this uncertainty is caused by contingent
assets, contingent liabilities, and deferred
maintenance. Second, the financial statements are
shown in the amount of rupiah that seems certain.
Actually, the amount of rupiah can be different if it
is used by another standard (because there is more
than one standard allowed). Especially when
compared with financial statements if the company
is liquidated, the amount of rupiah can be very
different. Property, plant and equipment are valued
at their historical prices, then deducted by the
accumulated depreciation. The net amount does not
reflect the value of the sale of fixed assets. In a state
of liquidation, intangible assets such as patents,
trademarks, organizational costs are only valued at
one rupiah. Third, the balance sheet and income
statement reflect financial transactions from time to
time. During that period the value of the rupiah may
have declined (the purchasing power of the rupiah
declined due to the increase in the price levels).
Fixed assets purchased in 1970 for example, the
purchase price has now tripled, consequently the
depreciation costs charged will be far smaller than
the depreciation rate based on the replacement cost
base. Also the increase in sales volume in rupiah
amounts is not necessarily as an increase in the
number of units sold. The increase in the rupiah
amount of sales volume may be caused by the
increase in unit selling prices. Therefore, to avoid
misleading analysis, comparative analysis must be
done carefully. Fourth, financial statements do not
provide a complete picture of the state of the
company. The financial statements do not reflect all
the factors that affect the financial condition and
results of operations because not all factors can be
measured in units of money. These factors, for
example, are the ability to find sellers and find
buyers, the reputation and prestige of the company
in the eyes of the public, external trust in the
company, efficiency, loyalty and integrity of the
leadership and employees, the quality of goods
produced, the condition of competitors generally,
and so on.
According to Martono and Agus Harjito (2010,
p. 4) Defining financial statement analysis as
follows: Analysis of financial statements is an
analysis of the financial condition of a company that
involves the balance sheet and profit and loss. After
the financial statements are prepared based on
relevant data, and are carried out with the correct
accounting procedures and valuations, the actual
financial condition will be seen. The financial
condition in question is known how many assets
(wealth), liabilities (debt), and capital (equity) in the
balance sheet owned. Then it will be known the
income to be received and the amount of costs
incurred during a certain period. Thus, it can be
known how the business results (profit or loss)
obtained during a certain period of income statement
are presented. In order for financial statements to be
more meaningful so that they can be understood and
understood by various parties, it is necessary to
analyze the financial statements.
One important source of information for users of
financial statements in making an economic decision
is through financial statements. The financial report
presents a lot of information about the performance
of management and the health of the company.
However, it cannot be denied that financial
statements still have many shortcomings in
presenting information needed by some parties,
therefore analysis of financial statements is needed
to analyze and interpret the report so that it can
provide meaningful information to parties interested
in development. company performance results.
According to Kasmir (2013, p. 8) in general the
objectives and benefits of financial statement
analysis are first, Knowing the financial position of
the company in a given period, both assets,
liabilities, capital, and the results of the business
achieved for several periods. Second, to find out
what weaknesses are lacking in the company. Third,
to know the strengths possessed. Fourth, to find out
what improvement steps need to be done in the
future that relate to the company's current financial
position. Fifth, to evaluate management performance
in the future whether it needs refresher or not
because it is considered successful or failed. Sixth, it
can also be used as a comparison with similar
companies about the results they achieve.
Financial ratio analysis is an activity to analyze
financial statements by comparing one account with
another account in the financial statements, the
comparison can be between accounts in balance
sheet financial statements and profit and loss. This
financial ratio analysis aims to determine the
relationship between accounts in financial
statements, both in the balance sheet and in the
income statement.
Financial ratio analysis describes a relationship
and a comparison between the number of one
account and the number of other accounts in the
financial statements. By using analytical methods
such as this ratio will be able to explain or give an
idea of the good or bad state or financial position of
Analysis of Financial Ratio for Measuring the Average of the Banking Industry Ratio Listed in LQ45
813

a company. The purpose of conducting financial
statement analysis is to be able to assist companies
in identifying the company's financial strengths and
weaknesses, assessing the performance of the
company's financial statements in empowering all
existing resources to achieve the targets set by the
company.
According to Kasmir (2014, p. 315) there are
several financial ratios which are considered
important namely first, the Liquidity Ratio. It is a
ratio to measure a bank's ability to fulfill its short-
term obligations when billed. The types of liquidity
ratios are Quick Ratio, Investing Policy Ratio.
Second, Solvency Ratio. Is a measure of a bank's
ability to find sources of funds to finance its
activities. The ratio is Primary Ratio, and Capital
Ratio. Third, Rentability Ratio. Rentability Ratios
are often called business profitability. This ratio is
used to measure the level of business efficiency and
profitability achieved by the bank concerned.
Rentability Ratio consists of Net Profit Margin, and
Return on Equity (ROE).
The industry ratio is the financial ratio used to
make comparisons between items, which aims to
determine stability when a business is related to its
competitors. The ratio in financial statement analysis
is a number that shows the relationship between an
element and other elements in the financial
statements. The relationship between the elements of
the financial statements is expressed in a simple
mathematical form. This standard ratio can be
determined based on the alternative, first, based on
the records of the financial condition and results of
the company's previous year. Second, based on
financial report data that is budgeted or often called
a goal ratio. Third, based on industry ratios, where
the company in question is included as a member.
Fourth, based on the ratio of other companies that
are competitors, a company that is classified as
advanced and successful is selected.
With a comparison of these standard ratios it will
be known whether the ratio of the company in
question lies above the average, average, or below
average. A good standard ratio is the one that gives
an average picture. Although the industrial ratio is
difficult to obtain or the preparation is very time
consuming (very slow). Thus for the purposes of
comparison can be used other forms of standard
ratios, for example a goal ratio or ratio of the
company itself that has been modified by
anticipating changes that are expected to occur
during an accounting period.
3 RESEARCH METHOD
The purpose of this study was to determine the
average financial ratios of the banking industry
registered in LQ45 for the period 2013-2017.
Basically the selection of ratios used to measure
industry ratios are Liquidity Ratios, Solvability
Ratios and Profitability Ratios. Liquidity ratios
include: Quick Ratio and Investing Policy Ratio.
Solvency ratios include: Primary Ratio and Capital
Ratio. Rentability Ratio includes: Net Profit Margin
and Return On Equity.
The companies studied were four banking
companies registered in LQ45, the sampling method
used was purposive sampling. The required data is
taken from the company's financial statements from
2013 to 2017.
The method used is descriptive research method,
this study uses a quantitative approach, namely data
that is processed and analyzed to obtain results and
conclusions. The pattern of research design in each
discipline has its own peculiarities, but the principles
generally have many similarities. Research design
provides an overview of the procedure for obtaining
information or data needed to answer all research
questions. Therefore, a good research design will
produce an effective and efficient research process.
The classification of research design is divided into
two, namely the design of exploratory and
conclusive research. The conclusive research design
is further divided into two types, namely descriptive
and causal.
4 ANALYSIS
This study aims to measure the average ratio of the
banking industry at PT. Bank Negara Indonesia
(Persero) Tbk, PT. Bank Central Asia Tbk, PT. Bank
Rakyat Indonesia (Persero) Tbk and PT. Bank
Mandiri (Persero) Tbk.
In the period of 2013 to 2017, BNI had a Quick
Ratio of 12.65%, 13.39%, 14.75%, 11.20%, and
13.01% respectively. During this period, the highest
Quick Ratio value was found in 2015 while the
lowest Quick Ratio value was in 2016
In the period of 2013 to 2017, BCA has a Quick
Ratio of 13.32%, 13.95%, 13.40%, 12.89% and
11.80% respectively. During that period, the highest
Quick Ratio value was in 2014 while the lowest
Quick Ratio value was in 2017.
In the period of 2013 to 2017, BRI had Quick
Ratio in a row of 13.75%, 13.54%, 14.83%, 11.80%
and 10.20%. During this period, the highest Quick
UNICEES 2018 - Unimed International Conference on Economics Education and Social Science
814

Ratio value was found in 2015 while the lowest
Quick Ratio value was in 2017.
In the period of 2013 to 2017, Bank Mandiri had
a Quick Ratio of 15.13%, 13.65%, 14.72%, 12.21%
and 11.58% respectively. During that period, the
highest Quick Ratio value was found in 2015 while
the lowest Quick Ratio value is in 2017.
In the period 2013 to 2017, BNI had Investing
Policy Ratios in a row of 4.06%, 4.21%, 2.78%,
5.61% and 7.21%. During this period, the value of
Investing Policy Ratio was highest in 2017 while the
lowest value of Investing Policy Ratio was in 2015.
In the period of 2013 to 2017, BCA had an
Investing Policy Ratio of 9.94%, 5.82%, 0.11%,
0.48% and 1.58% respectively. During this period,
the highest value of Investing Policy Ratio was in
2013 while the lowest value of Investing Policy
Ratio was in 2015.
In the period of 2013 to 2017, BRI had an
Investing Policy Ratio of 8.46%, 13.52%, 18.67%,
17.42% and 22.21%. During this period, the value of
Investing Policy Ratio was highest in 2017 while the
lowest value of Investing Policy Ratio was in 2013.
In the period 2013 to 2017, Mandiri had
Investing Policy Ratios in a row of 5.38%, 7.00%,
7.12%, 8.09% and 7.94%. During this period, the
highest value of Investing Policy Ratio was in 2016
while the lowest value of Investing Policy Ratio was
in 2013.
In the period 2013 to 2017 PT. Bank Negara
Indonesia (Persero) Tbk, Primary Ratio has 12.33%,
14.65%, 15.42%, 14.80% and 14.23% respectively.
During this period, the highest Primary Ratio was
found in 2015 while the lowest Primary Ratio was
found in 2013.
In the period 2013 to 2017, BCA had Primary
Ratio in a row of 12.89%, 14.11%, 15.08%, 16.66%
and 17.51%. During the period, the highest Primary
Ratio value was found in in 2017 while the lowest
Primary Ratio was found in 2013.
In the period 2013 to 2017, PT. Bank Rakyat
Indonesia (Persero) Tbk has a Primary Ratio of
12.67%, 12.19% 12.88%, 14.63% and 14.86%
respectively. During this period, the highest Primary
Ratio value was found in 2017 while the lowest
Primary Ratio value was in 2014.
In the period 2013 to 2017 PT. Bank Mandiri
(Persero), Tbk, has Primary Ratio of 12.11%,
12.26%, 13.13%, 14.77% and 15.12%, respectively.
During this period, the highest Primary Ratio value
was found in 2017 while the lowest Primary Ratio
value was in 2013.
In the period 2013 to 2017 PT. Bank Negara
Indonesia (Persero). Tbk, has a Capital Ratio of
21.77%, 24.49%, 27.74%, 26.94% and 26.16%
respectively. During this period, the highest value of
Capital Ratio was in 2015 while the lowest value of
Capital Ratio was in 2013.
In the period 2013 to 2017, PT. Bank Central
Asia. Tbk has Capital Ratio of 22.69%, 24.90%,
26.06%, 31.04% and 31.84% respectively. During
this period, the highest value of Capital Ratio was in
2017 while the lowest value of Capital Ratio was in
2013.
In the period 2013 to 2017, PT. Bank Mandiri
(Persero). Tbk, has a Capital Ratio of 21.77%,
24.49%, 27.74%, 26.94% and 26.16% respectively.
During this period, the highest value of Capital Ratio
was in 2015 while the lowest value of Capital Ratio
was in 2013.
In the period 2013 to 2017, BNI had a Net Profit
Margin of 80.74%, 81.14%, 80.10%, 80.19% and
79.96% respectively. During this period, the highest
Net Profit Margin was found in 2014 while the
lowest Net Profit Margin was found in 2017.
In the period of 2013 to 2017, BCA has Net
Profit Margin in a row of 83.47%, 80.53%, 79.60%,
79.85% and 79.98%. During this period, the highest
Net Profit Margin value was in 2013 while the
lowest Net Profit Margin value was in 2015.
In the period of 2013 to 2017, BRI had Net
Profit Margin in a row of 81.73%, 85.52%, 83.28%,
77.22% and 78.91%. During this period, the highest
Net Profit Margin value was in 2014 while the
lowest Net Profit Margin was found in 2016.
In the period of 2013 to 2017, Mandiri had Net
Profit Margin in a row of 79.95%, 79.51%, 80.31%,
78.71% and 78.92%. During this period, the highest
Net Profit Margin value was in 2015 while the
lowest Net Profit Margin was found in 2016.
In the period 2013 to 2017, BNI had a Net Profit
Margin of 19.00%, 17.75%, 11.65%, 12.78% and
13.65% respectively. During this period, the highest
ROE value was in 2013 while the lowest ROE was
in 2015.
In the period 2013 to 2017, BCA had ROE of
22.29%, 21.19%, 20.12%, 18.30%, and 17.75%
respectively. During this period, the highest ROE
value was in 203 while the lowest ROE was found in
2017.
In the period of 2013 to 2017, BRI had ROE of
26.92%, 24.82%, 22.46%, 17.86% and 17.36%
respectively. During this period, the highest ROE
was found in 2013 while the lowest ROE was found
in 2017.
In the period 2013 to 2017, Mandiri had ROE of
21.21%, 19.70%, 17.70%, 9.55% and 12.61%
respectively. During this period, the highest ROE
Analysis of Financial Ratio for Measuring the Average of the Banking Industry Ratio Listed in LQ45
815
was found in 2013 while the lowest ROE was found
in 2016
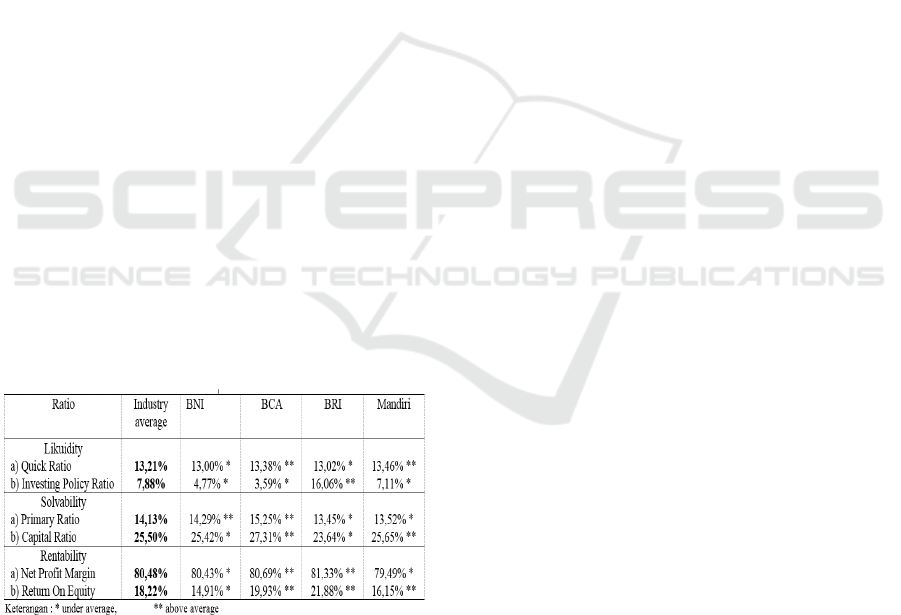
5 RESULTS
Liquidity ratio analysis shows that in 2013-2017, the
average bank financial ratio in the Quick Ratio was
13.21%. Banks that have an average above the
industry average of Mandiri of 13.46% and BCA of
14.38%. Investing Policy Ratio of 7.88%. Banks that
have an average above the industry average of BRI
is 16.06%.
Solvability analysis in 2013-2017, shows the
average financial ratio of banks at Primary Ratio of
14.13%. Banks that have an average above the
industry average of BCA of 15.25% and BNI of
14.29%. the average bank financial ratio at the
Capital Ratio is 25.50%. Banks that have an average
above the industry average of BCA of 27.31% and
Mandiri of 25.65%.
Analysis of profitability in 2013-2017 shows that
the average bank financial ratio on Net Profit
Margin is 80.48%. Banks that have an average
above the industry average, namely BCA at 80.69%
and BRI 81.33%. In this ratio, all banks in a
profitable condition means they can generate profits.
The average bank financial ratio on Return on
Equity is 18.22%. Banks that have an average above
the industry average of BRI are 21.88% and BCA
are 19.93%.
Table 1: Recapitulation of Financial Ratios Periode
2013-2017
6 CONCLUSIONS
From the results of the analysis and discussion, it
can be concluded that the Liquidity Ratio: the
industry average for Quick Ratio is 13.21% and the
industry average of Investing Policy Ratio is 7.88%
during the period 2013-2017. Solvability Ratio: the
industry average for Primary Ratio is 14.13% and
the industry average Capital Ratio is 25.50% during
the period 2013-2017. Profitability Ratio: the
industry average for Net Profit Margin is 80.48%
and the industry average Return on Equity is 18.22%
during the period 2013-2017.
REFERENCES
Jumingan. (2017). Analisis Laporan Keuangan. Jakarta:
Bumi Aksara.
Kamaludin, & Indriani, R. (2012). Manajemen Keuangan.
Bandung: CV Mandar Maju.
Kasmir. (2008). Analisa Laporan Keuangan. Jakarta: Raja
Grafindo Persada.
Kasmir. (2013). Analisa Laporan Keuangan. Jakarta: Raja
Grafindo Persada.
Kasmir. (2014). Analisa Laporan Keuangan. Jakarta: Raja
Grafindo Persada.
Martono, & Agus D. (2010). Manajemen Keuangan.
Yogyakarta: Ekonisia.
Sujarweni. (2017). Analisis Laporan Keuangan.
Yogyakarta: Pustaka Baru press.
Wijaya, D. (2017). Manajemen Keuangan. Jakarta:
Grasindo.
UNICEES 2018 - Unimed International Conference on Economics Education and Social Science
816
