
Analysis of the Competitive Leading Sector in Agricultural Sub
Sectors and the Effect on GRDP in Serdang Bedagai Regency
Pratama Hartadi
1
, Muhammad Yusuf
1
and Muhammad Fitri Rahmadana
1
1
Department of Economy, Postgraduate Faculty, State University of Medan
Keywords: Economic Growth, Location Quotient (LQ), Agriculture Sector, Gross Regional Domestic Product (GRDP)
Abstract: The Agriculture, Forestry and Fisheries sector is the largest contribution sector to GRDP in Serdang
Bedagai Regency with 39.14 percent average contribution in 2011-2016 (year of conservation). The aims of
this research : (1) to determine the leading sub-sectors in the agriculture, forestry and fisheries sector in
Serdang Bedagai Regency, (2) to determine the leading of agricultural sub sector effect on GRDP in
Serdang Bedagai Regency. The data in this study were obtained from The Central Bureau of Statistics
(BPS) of North Sumatera Province and Serdang Bedagai Regency. This research used a type of descriptive
research with a quantitative approach. The analysis used in this research are descriptive analysis, location
quotient (LQ), and simple linear regression. The results of this research that the agriculture, livestock and
fisheries sector is the leading sector base in Serdang Bedagai Regency. Agriculture, livestock and service;
and the fisheries sub sector is a leading sub sector of the agriculture, livestock and fisheries sector in
Serdang Bedagai Regency. The fisheries sub sector is the most leading agricultural sub sector in Serdang
Bedagai Regency. Furthermore, the LQ variable in the agriculture, livestock and fisheries sub sector has a
positive and significant influence on economic growth in Serdang Bedagai Regency.
1 INTRODUCTION
Indonesia is a developing country with the
agricultural sector as a source of livelihood for the
majority of its population. Most of the land use in
the Indonesian territory is used as agricultural land
and almost 50 percent of the total workforce still
depends on their life necessities in the agricultural
sector. This situation requires government policies in
the agricultural sector to be adjusted to the
conditions and developments that occur in the field
in overcoming various problems related to the
welfare of the nation, Tambunan in Yamin (2005).
The agricultural sector has an important role in
Indonesian economy, because the agricultural sector
serves as the basis or foundation of economic
development. The agricultural sector is one of the
leading sectors in the economy and has a role as a
buffer for national development, so the government
programs in agricultural development are directed at
increasing income and living standards such as
expanding employment, business opportunities and
markets for various products produced. Furthermore,
with the existence of more advanced and efficient
agricultural development, it is expected to be able to
increase the diversity of yields, improve the quality
and degree of production processing can support
regional development.
The agricultural sector as one of the economic
sectors is a very potential sector in contributing to
the growth and the national economy development,
both in terms of income and employment. The
agricultural sector has an increasingly important role
in the formation of PDRB, including in Serdang
Bedagai Regency. Serdang Bedagai Regency has
high potential agricultural land, especially for the
development of lowland rice crops. Agricultural
development in Serdang Bedagai Regency has an
important and strategic role in national and regional
development. The role of the agricultural sector is
not only for food security, but also contribute to
employment opportunities significantly, sources of
income and the regional economy.
Serdang Bedagai Regency is one of the regencies
in North Sumatra province based on the Law of the
Republic of Indonesia Number 36 of 2003
concerning the establishment of Samosir Regency
524
Hartadi, P., Yusuf, M. and Rahmadana, M.
Analysis of the Competitive Leading Sector in Agricultural Sub Sectors and the Effect on GRDP in Serdang Bedagai Regency.
DOI: 10.5220/0009504705240531
In Proceedings of the 1st Unimed International Conference on Economics Education and Social Science (UNICEES 2018), pages 524-531
ISBN: 978-989-758-432-9
Copyright
c
2020 by SCITEPRESS – Science and Technology Publications, Lda. All rights reserved
and Serdang Bedagai District in North Sumatra
Province, the result from the division of Deli
Serdang Regency. Below is a table of North Sumatra
Gross Regional Domestic Product (GRDP) and
Serdang Bedagai Regency on the basis of 2010
Constant Prices from 2012-2015.
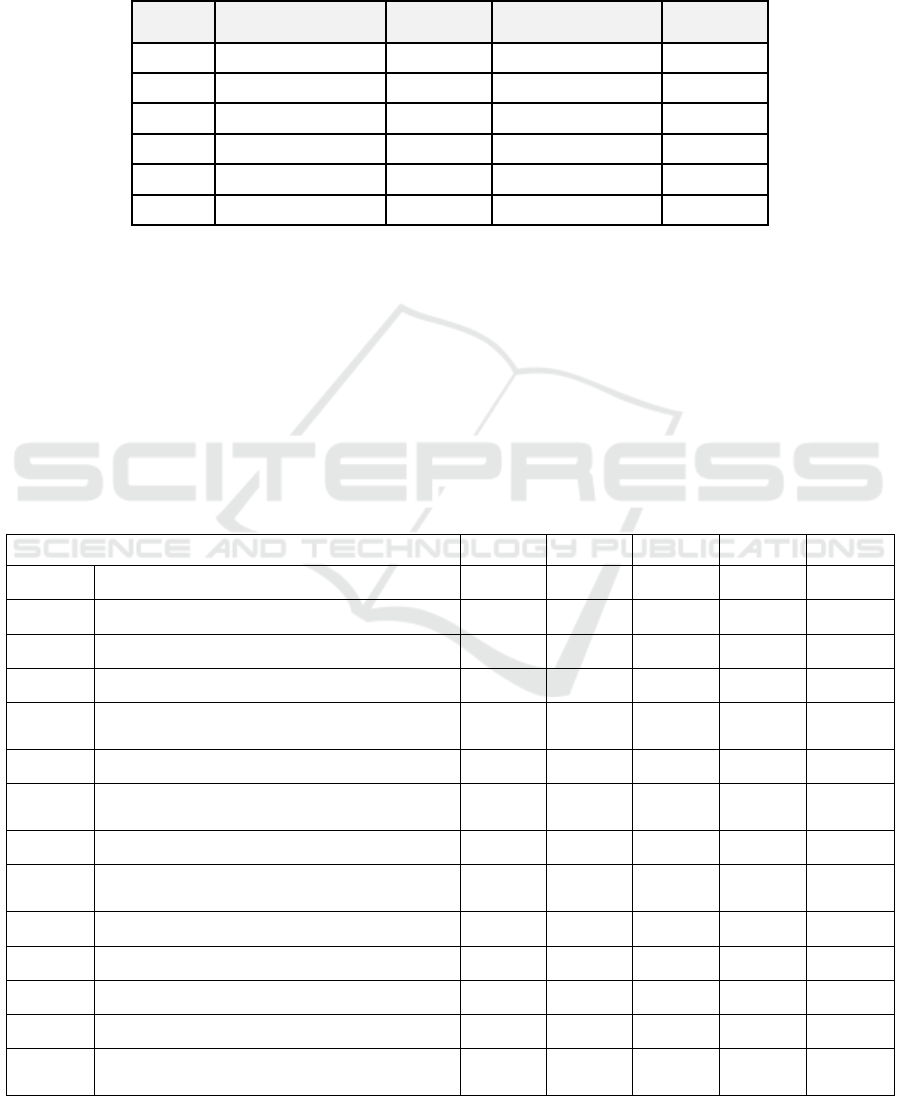
Table 1: North Sumatra Gross Regional Domestic Product (GRDP) and Serdang Bedagai Regency on the basis
of Constant Prices in 2010 (Billion Rupiah), 2011-2016
Year North Sumatera Percent Serdang Bedagai Percent
2011 353,147.6 - 12,780.10 -
2012 375,924.1 6.45 13,558.80 6.09
2013 398,727.1 6.07 14,345.76 5.80
2014 419,573.3 5.23 15,080.38 5.12
2015 440,955.9 5.10 15,841.95 5.05
2016 463,775.5 5.18 16,656.17 5.14
Source : BPS of North Sumatera Province
Provincial and Serdang Bedagai GRDP data have
a positive trend from year to year. According to the
business field, GRDP of Serdang Bedagai Regency
is divided into 17 categories and most of the
categories are divided into subcategories. The
division into subcategories is adjusted to the
Indonesian Standard Business Classification (KLBI)
in 2009. The business field structure of some
communities Serdang Bedagai Regency can be seen
from the magnitude of the role of each business field
in the formation of Serdang Bedagai Regency GRDP
in 2014 produced by the Agriculture, Forestry and
Fisheries business, Processing Industry, Large Trade
and Retail, Car and Motorcycle Repair,
Construction, Business Field of Government
Administration , Defense and Compulsory Social
Security, provision of Accommodation and Drinking
Food, Real Estate and Educational Services. While
the role of Other Business Fields is below one
percent respectively
Table 2: Role of GRDP by Industry (percent), 2010─2014
Business field
2010 2011 2012 2013* 2014**
A Agriculture, Forestry and Fisheries
44,08 43,64 43,23 43,1 41,42
B Mining and Excavation
0,82 0,87 0,89 0,92 0,9
C Management Industry
19,78 19,91 19,66 19 19,47
D Procurement of Electricity and Gas
0,11 0,1 0,09 0,09 0,07
E
Water Supply, Waste, Waste and
Rec
y
clin
g
Mana
g
emen
t
0,01 0,01 0,01 0,01 0,01
F Construction
8,13 8,36 9,01 9,33 9,62
G
Large and Retail Trade; Car and
Motorc
y
cle Reparation 13,95 13,96 13,81 13,84 14,38
H Transportation and Warehousing
0,81 0,81 0,81 0,9 0,94
I
Supply of Accommodation, Food and
Drinks 3 2,9 2,93 2,91 2,99
J Information and Communication
0,63 0,58 0,56 0,54 0,53
K Financial and Insurance Services
0,45 0,47 0,49 0,51 0,52
L Real Estate
2,26 2,38 2,3 2,54 2,62
M,N Company Services
0,46 0,46 0,48 0,5 0,52
O
Pem Administration, Land, Mandatory
Social Securit
y
2,9 2,96 3,07 3,12 3,24
Analysis of the Competitive Leading Sector in Agricultural Sub Sectors and the Effect on GRDP in Serdang Bedagai Regency
525
P Educational Services
1,41 1,37 1,36 1,36 1,39
Q Health Services and Social Activities
0,78 0,79 0,82 0,83 0,86
R,S,T,U Other services
0,42 0,44 0,45 0,49 0,51
Gross Regional Domestic Product 100 100 100 100 100
Source : BPS of North Sumatera Province
Description: *) Temporary Figures **) Very Temporary Figures
To develop the potential for economic growth
which seen from the development of PDRB,
economic development is needed which refers to the
leading sector, besides having an impact on
accelerating economic growth, it will also affect
fundamental changes in the structure of the regional
economy. The benefits of knowing the leading
sector is able to provide an indication for nationally
and regionally economy. The leading sector is
guaranteed to have greater potential to grow faster
than other sectors in a region.
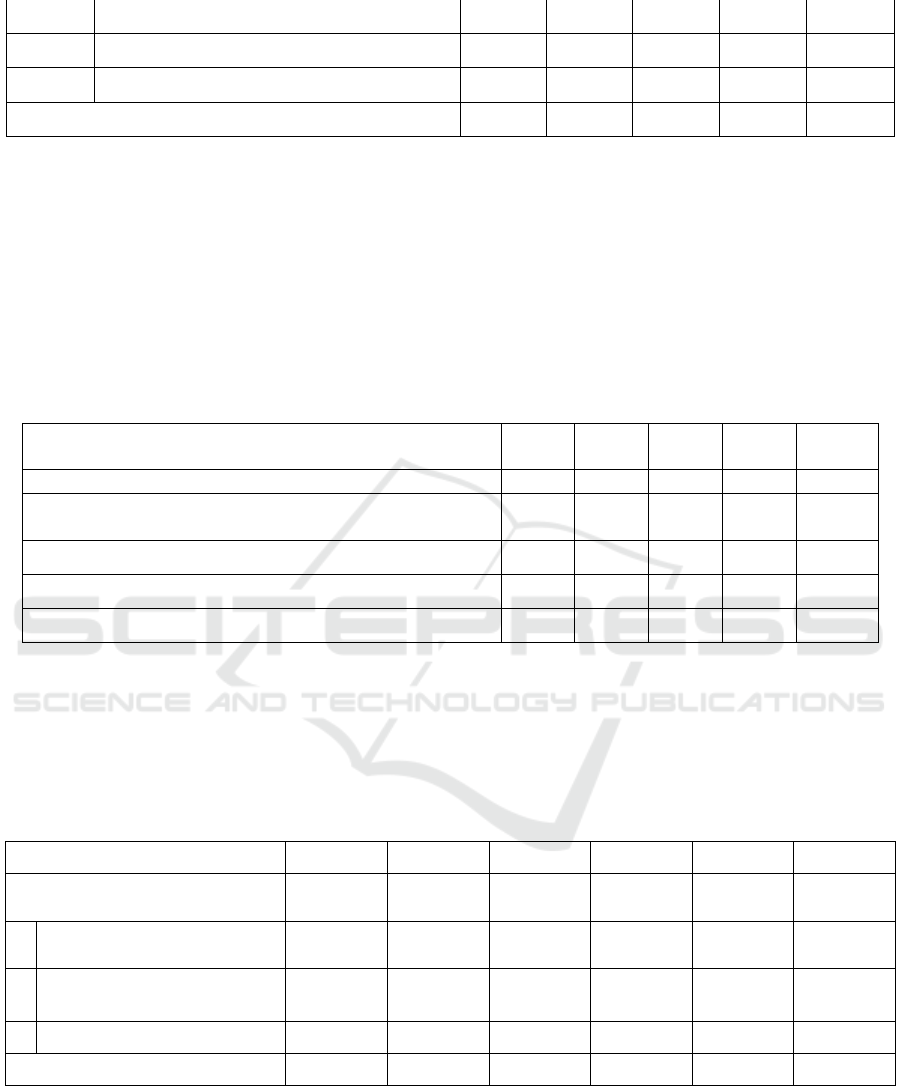
Table 3: Contribution of Agriculture, Forestry and Fisheries Categories to GRDP in Serdang Bedagai Regency
(Percent), 2010-2014
Business field 2010 2011 2012 2013* 2014**
1 2 3 4 5 6
Agriculture, Livestock, Hunting and Agricultural
Services
38,21 37,81 37,37 37,1 35,22
Forestry and Logging 0,25 0,24 0,23 0,22 22
Fisheries 5,62 5,58 5,62 5,78 5,99
Agriculture, Forestry, and Fisheries 44,08 43,64 43,23 43,1 41,42
Source : BPS of North Sumatera Province
Description: *) Temporary Figures **) Very Temporary Figures
In 2014 the categories of Agriculture, Forestry
and Fisheries contributed to the GRDP on the
current prices basis of 41.42 percent. The role of
business sector decreased from 44.08 percent in
2010 to 43.64 percent in 2011, 43.23 percent in 2012
and 43.10 in 2013
Table 4:Series 2010 GRDP on the basis of Constant Prices according to the Business Field in Serdang Bedagai
Regency (Billion Rupiah)
Sector 2011 2012 2013 2014 2015* 2016**
Agriculture, Forestry, and
Fisheries
5052.94 5311.48 5627.86 5910.10 6189.10 6439.70
1
Agriculture, Livestock and
Services
4372.17 4603.86 4893.99 5145.21 5384.70 5592.13
2 Forestry and Logging 30.73 30.71 30.87 31.07 31.32 31.57
3 Fisheries 650.04 676.91 702.99 733.81 773.09 815.99
Total 12,780.10 13,558.80 14,345.76 15,080.38 15,841.95 16,656.17
Source : BPS of North Sumatera Province
Description: 2015* Temporary Figures 2016** Very Temporary Figures
According to North in Sjafrizal (2008) states that
"Economic growth of a region is basically
determined by the amount of competitive advantage
possessed by the region concerned". If a certain area
can encourage the growth of economic sectors that
have competitive advantages as a basis for export
activities, then the economic growth of the region
will increase rapidly. This is the basis for Serdang
Bedagai Regency in increasing regional economic
UNICEES 2018 - Unimed International Conference on Economics Education and Social Science
526

growth so it can grow export activities and compete
with other regions.
2 THEORICAL FRAMEWORK
AND HYPOTHESIS
DEVELOPMENT
Economic development is an effort to increase per
capita income and increase productivity per capita
by adding capital equipment and adding skills or
efforts to add capital equipment and add skills so
that each other brings greater per capita income and
higher per capita productivity (According to
Djojohadikusumo in Martono, 2000)
According to Todaro in Sirojuzilam (2008),
economic development is a multidimensional
process, which involves major changes, both to
changes in economic structure, social change,
reducing or eliminating poverty, reducing inequality
and unemployment in the context of economic
growth.
Economic development shows the changes in
output structure and input allocation to various
sectors of the economy in addition to increasing
output. Generally development always accompanied
by growth, but growth does not necessarily
accompanied by development (Irawan and
Suparmoko, 1992).
Basically, the theory of regional economic
development discuss two things: 1) methods in
analyzing the development of an area and 2) theory
relating to the factors that determine the economic
growth of a region. Arsyad in a journal written by
Suwandi (2016) states that “Formulates the study of
regional development as follows : regional
development equal to natural resources, labor,
investment, entrepreneurship, communication,
industry composition, technology, area, export
markets, the international economic situation, the
capacity of local government, spending central
government and aid development) the development
that is undertaken should be able to explore all the
potential in each region to be processed so that will
be very useful in real terms”.
There are two main concepts in regional
economic development, namely balance
(equilibrium) and regional production factor
mobility. It means the economic system will reach
its natural development point if capital can flow
without restrictions. Therefore, capital will flow
from high wage regions to low wage regions. The
economic growth rate of a region is determined by
the amount of exports both selling products /
services outside the region to other regions within
the country and abroad. Basically all activities both
product producers and service providers that bring
money from outside the region because their
activities are basic activities. Employment and
income in the base sector are functions of exogenous
requests (not dependent on internal strength / local
demand) (Tarigan, 2002).
Regional economic growth analyzes an area as
an open economic system that deals with other
regions through the flow of production factors and
commodity exchange. Economic growth can be
valued as a result of government policies, especially
in economics. Economic growth is the growth rate
formed from various economic sectors indirectly
describing the growth rate that occurs and as an
important indicator for regions to evaluate the
success of development (Sirojuzilam, 2008).
According to Adam Smith, economic growth is
divided into 5 stages start from the hunting period,
raising livestock, planting time, trading period and
industrial period. According to this theory, society
will move from traditional society to modern
society.
According to the theory of comparative
advantage, David Ricardo states that a country must
focus its economic activities on industries that are
superior and most internationally competitive, and
conduct trade activities with other countries to
obtain goods that are not produced nationally.
Gross Regional Domestic Product (PDRB)
according to the Central Bureau of Statistics (2013)
is an indicator to show the economic growth rate of
a region in a sector, so that it can be seen the causes
of economic growth in a region.
The role of the agricultural sector in economic
development is very important because some
members of society in poor countries depend their
lives on the sector. If the planners seriously pay
attention to the welfare of their people, then the only
way is by improving the welfare of most members of
their community living in the agricultural sector.
This method can be achieved by increasing the
production of food crops and their trading plants
and, or by increasing the prices they receive for the
products they produce (Arsyad, 1992).
According to (Todaro, 2003), traditionally the
role of agriculture in economic development is
considered passive and only as a support. Based on
the historical experience of western countries,
economic development seems to require a rapid
structural transformation of economy, which
originally prioritizes agricultural activities into more
complex societies where there are more modern
industrial and service fields. Thus, the main role of
agriculture is to provide sufficient labor and food at
low prices to develop dynamic industries as an
Analysis of the Competitive Leading Sector in Agricultural Sub Sectors and the Effect on GRDP in Serdang Bedagai Regency
527
important sector in all economic development
strategies.
In the future, development of Serdang Bedagai
Regency will be carried out by considering leading
sectors or bases which will be used as priority scale.
For this reason, it is necessary to conduct more
comprehensive study of potential sectors in Serdang
Bedagai Regency that have advantages both in terms
of agriculture and its contribution to the aggregate
economic growth in Serdang Bedagai Regency.
3 RESEARCH METHOD
This research was conduct in Serdang Bedagai
Regency which become one of regencies in North
Sumatera. This research is aimed to the leading
commodities in agricultural sector in Serdang
Bedagai Regency and the effect on economic growth
of Serdang Bedagai Regency. The data in this
reasearch were obtained from The Central Bureau
of Statistics (BPS) of North Sumatera Province and
Serdang Bedagai Regency.
Based on the results of calculation of Location
Quotient (LQ), it can be seen the activities
concentration in an area as follows:
1. If the value of LQ > 1, it means the growth rate
of sector I in the research area is greater with the
same growth rate sector in the economy of
reference area. Thus sector I is a leading sector in
the study area as well as an economic base sector
for further development.
2. If the value of LQ < 1, it means the growth rate
of sector I in the research area is smaller with the
same growth rate sector in the economy of
reference area. Thus sector I is not a leading
sector in the study area and is not an economic
base sector and is not prospective to be
developed further.
3. If the value of LQ = 1, it means the growth rate
of sector I in the research area is the same as
growth rate sector in the economy of reference
area.
Then from the LQ values obtained, it is analyzed
and can be seen whether the base commodities in
agricultural sub sector affect the growth of the
GRDP of Serdang Bedagai Regency.
4 RESULT AND DISCUSSION
The GRDP of North Sumatra Province Agriculture,
Forestry and Fisheries Sector 2011 to 2016
(observation year) is as follows:
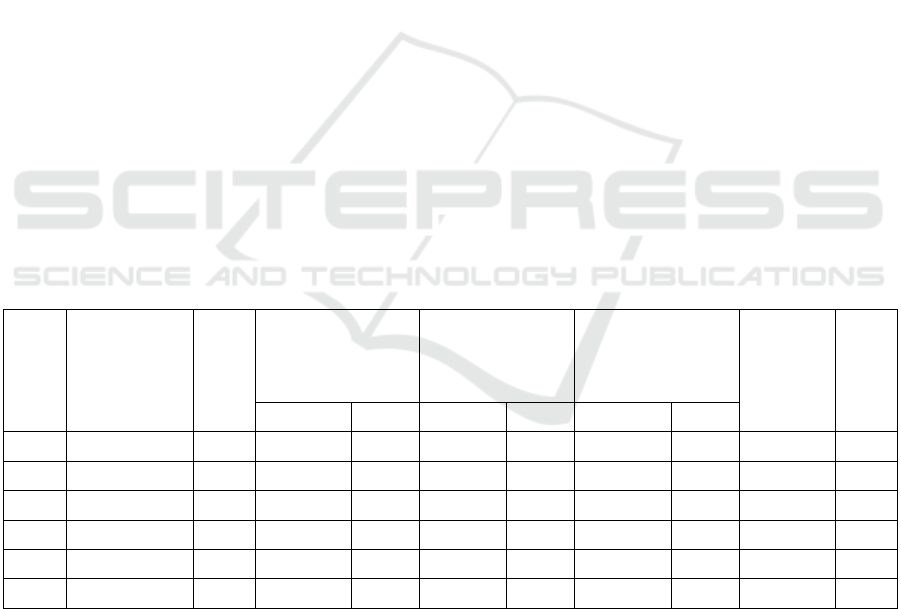
Table 5: Series 2010 of GRDP Based on Constant Prices According to the Business Field of North Sumatra
Province (Billion Rupiah), from 2011 to 2016 (Observation Year)
Year
Agriculture,
Forestry,
and
Fisheries
Sector
%
Sub Sector :
Agriculture,
Livestock, and
Services
Sub Sector :
Forestry and
Logging
Sub Sector :
Fisheries
Total of
GRDP
%
Data % Data % Data %
2011 90592.55 - 79385.54 - 3531.06 - 7675.95 - 353147.6 -
2012 95405.42 5.31 83663.65 5.39 3663.51 3.75 8078.25 5.24 375924.1 6.45
2013 99894.57 4.71 87560.02 4.66 3823.99 4.38 8510.56 5.35 398727.1 6.07
2014 104262.8 4.37 91363.87 4.34 3926.11 2.67 8972.85 5.43 419573.3 5.23
2015 110066 5.57 96506.08 5.63 4078.86 3.89 9481.06 5.66 440955.9 5.10
2016 115179.7 4.65 101220.1 4.88 3934.32 -3.54 10025.28 5.74 463775.5 5.18
Source: BPS North Sumatra Data, 2018 (processed).
Based on the table above, it is known that all
sectors, sub sectors and GRDP in North Sumatra
Province had a positive trend by the increasing from
year to year. It shows the economic development of
the community, especially in agriculture, forestry
and fisheries sectors as a whole in North Sumatra
Province.
Serdang Bedagai Regency GRDP data on
Agriculture Sector from 2011 to 2016 (observation
year) is as follows:
UNICEES 2018 - Unimed International Conference on Economics Education and Social Science
528
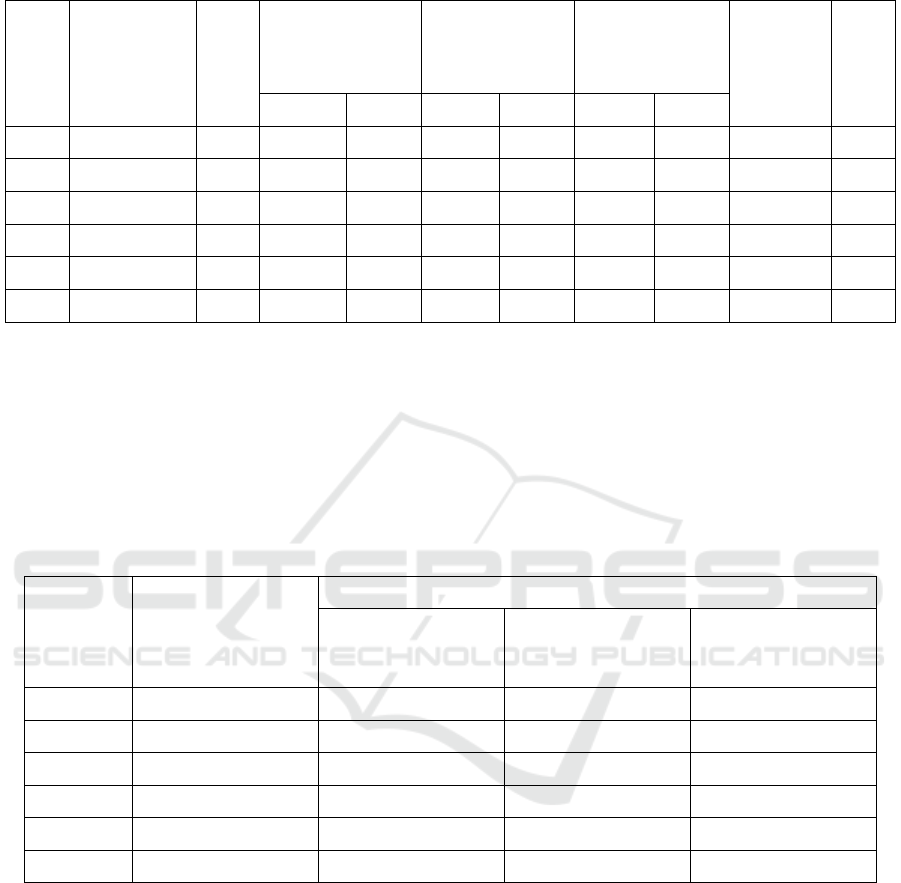
Table 6: Series 2010 of GRDP on the basis of Constant Prices according to the Business Field of Serdang
Bedagai Regency (Billion Rupiah) from 2011 to 2016 (Observation Year)
Year
Agriculture,
Forestry,
and
Fisheries
Sector
%
Sub Sector :
Agriculture,
Livestock, and
Services
Sub Sector :
Forestry and
Logging
Sub Sector :
Fisheries
Total of
GRDP
%
Data % Data % Data %
2011 5052.94 - 4372.17 - 30.73 - 650.04 - 12,780.10 -
2012 5311.48 5.12 4603.86 5.30 30.71 -0.07 676.91 4.13 13,558.80 6.09
2013 5627.86 5.96 4893.99 6.30 30.87 0.52 702.99 3.85 14,345.76 5.80
2014 5910.1 5.02 5145.21 5.13 31.07 0.65 733.81 4.38 15,080.38 5.12
2015 6189.1 4.72 5384.7 4.65 31.32 0.80 773.09 5.35 15,841.95 5.05
2016 6439.7 4.05 5592.13 3.85 31.57 0.80 815.99 5.55 16,656.17 5.14
Source: BPS North Sumatra Data, 2018 (processed).
Based on the table above, it is known that all
sectors, sub sectors and GRDP in North Sumatra
Province also had a positive trend by the increasing
from year to year. It shows the economic
development of the community, especially in
agriculture, forestry and fisheries sectors as a whole
in North Sumatra Province. But the question is
whether the agricultural sector is a leading base
sector in Serdang Bedagai Regency which needs to
be analyzed by Location Quotient (LQ).
The results of LQ formulation in agriculture,
forestry and fisheries sectors and sub sectors of
Serdang Bedagai Regency are as follows
Table 7: Sector LQ and Agriculture, Forestry and Fisheries Sub Sector of Serdang Bedagai Regency, from
2011 to 2016 (Observation Year)
Year
Agriculture,
Forestry, and
Fisheries Sector
Sub Sector
Agriculture,
Livestock, and
Services
Forestry and
Logging
Fisheries
2011 1.717 1.704 0.242 2.531
2012 1.712 1.705 0.235 2.519
2013 1.712 1.709 0.228 2.525
2014 1.707 1.703 0.224 2.53
2015 1.712 1.709 0.217 2.53
2016 1.704 1.689 0.227 2.583
Source: Data processed, 2018
Based on the table above, it is explained that
agriculture, forestry and fisheries sector in Serdang
Bedagai Regency is a base sector or leading sector
with a consistent value of LQ > 1 from 2011 to
2017. It explains that agriculture, forestry and
fisheries sectors have a large contribution to the
economic growth in Serdang Bedagai Regency. The
increasing of LQ value in agricultural sector is
inseparable because the economy of Serdang
Bedagai Regency has extensive and fertile natural
resources and also the people can utilize the existing
natural wealth.
The agriculture, forestry and fisheries sectors
indicate that Serdang Bedagai Regency is able to
fulfill its own needs in the fields of agriculture,
forestry and fisheries. It is even possible to export
economic activity out of areas and able to produce
goods and services that can be sold outside the
region to increase the revenue in Serdang Regency
Begadai. This is inseparable from the topographical
conditions of the Serdang Regency Begadai with a
variety of land forms and capable of producing
various agricultural, forestry and fisheries
commodities.
Analysis of the Competitive Leading Sector in Agricultural Sub Sectors and the Effect on GRDP in Serdang Bedagai Regency
529

However, if examined in detail from the state of
LQ in agriculture, forestry and fisheries sector in
Serdang Bedagai Regency, the conclusions can be
made on the advantages as follow:
a. The agriculture, livestock and services
sub-sector has LQ > 1 which is consistent with the
observation year (2011 to 2016). It explains that the
agriculture, forestry and fisheries sector, the
agriculture, livestock and services sub sector is a
base or leading sub sector in Serdang Bedagai
Regency.
b. The agriculture, livestock and services
sub-sector has LQ < 1 which is consistent with the
observation year (2011 to 2016). It explains that the
agriculture, forestry and fisheries sector, the
agriculture, livestock and services sub sector is not a
base leading sub sector in Serdang Bedagai
Regency.
c. The fisheries sub-sector has LQ> 1 even
the LQ value> 2 which is consistent with the
observation year (2011 to 2016). It explains that the
agriculture, forestry and fisheries sector, the
agriculture, livestock and services sub sector is a
base or leading sub sector in Serdang Bedagai
Regency. It that the fisheries sub-sector is the most
superior in Serdang Bedagai Regency.
Furthermore, the results of LQ analysis of each
of subs ectors and associated with economic growth
in Serdang Bedagai Regency in a simple regression
analysis by the following result:
Table 8: The Results from Model Function Estimation fo Agriculture, Forestry and Fisheries Sub Sector
Against Economic Growth in Serdang Bedagai Regency
Free Variable Coefficient Sdr Error T-tes Prob. Description
C 1,645 0,288 5,721 0 Significant
Agricultural Sub
Secto
r
0,697 0,163 4,286 0,001 Signifikan
R Square 0,535
Adjusted R Square 0,505
Source: Data processed, 2018
Based on the table above, it is known that the
leading sub sectors of agriculture, forestry ancynd
fisheries have a positive and significant influence on
economic growth in Serdang Regency by using
formula below:
Log(PDRB) = 1,645 + 0,697 (Agricultural Sub
Sector) + e
The explanation based on above formula are as
follow:
a. Log (GRDP) = 1,645, means that if the LQ sub-
sector of agriculture, forestry and fisheries has 0
value, then the magnitude of economic growth
is 1,645.
b. Agricultural Sub-Sector = 0.697, means that if
the LQ in agriculture, forestry and fisheries sub-
sector increases by 1%, then economic growth
increases by 0.697 percent.
Furthermore, in the research model, the value of
R squared is 0.535. It shows that the agriculture,
forestry and fisheries sub sector variables are able to
explain the model of economic growth by 53.5
percent in Serdang Bedagai Regency. And the
remaining is 46.5 percent influenced by other
variables which not examined in this study.
In an effort to increase the level of economic
growth in Serdang Bedagai, the government through
the Regional Planning Agency can make efforts to
increase the LQ value of the Agriculture, Forestry
and Fisheries Sector. This is deemed necessary
because the increasing LQ value of the Agriculture,
Forestry and Fisheries Sector can increase the
economic growth of Serdang Bedagai Regency.
5 CONCLUSIONS
Based on the results and discussion of research can
be concluded as follows:
1. The agriculture, livestock and fisheries sector
is the leading sector basis in Serdang Bedagai
Regency.
2. Agriculture, livestock and service; and the
fisheries sub sector is a leading sub sector of
the agriculture, livestock and fisheries sector in
Serdang Bedagai Regency.
LQ variable in the agriculture, livestock and
fisheries sub sector has a positive and significant
influence on economic growth in Serdang Bedagai
Regency.
UNICEES 2018 - Unimed International Conference on Economics Education and Social Science
530

REFERENCES
Arsyad, Lincolin. (2001). Pengantar Perencanaan dan
Pembangunan Ekonomi Daerah. BPFE UGM.
Yogyakarta.
----. Ekonomi Pembangunan. Yogyakarta: Bagian
Penerbitan STIE YKPN
Irawan, Prasetya, dan M. Suparmoko. (1992). Ekonomika
Pembangunan. BPFE UGM, Yogyakarta.
Sirojuzilam, (2008), “Disparitas Ekonomi dan
Perencanaan Regional, Ketimpangan Ekonomi
Wilayah Barat dan Wilayah Timur Provinsi
Sumatera Utara”, Pustaka Bangsa Press.
Sjafrizal. (2008). Ekonomi Regional : Teori dan Aplikasi.
Jakarta : Niaga Swadaya.
Suparmoko. (2002). Ekonomi Publik untuk Keuangan dan
Pembangunan Daerah. Edisi Pertama. Yogyakarta:
Andi
Suwandi. (2016). Structure and Economic Development
Pattern in Jayapura through other Cities and Towns
in Papua. European Journal of Social Sciences. Vol.
52, No. 1, Hal. 5-13. ISSN : 1450-2267.
Todaro, Michael P. (2003). Pembangunan Ekonomi di
Dunia Ketiga. Erlangga. Jakarta.
Analysis of the Competitive Leading Sector in Agricultural Sub Sectors and the Effect on GRDP in Serdang Bedagai Regency
531
