
The Influence of Person Organization Fit (POFit), and Developing
Expectancy on Organizational Citizenship Behaviour (OCB) and
Employee Peformance of Local Water Companies in South
Kalimantan Province
Fanlia Prima Jaya, Sulaiman, Muhammad Rudiansyah and Devi Rusvitawati
Departement of Management,Sekolah Tinggi Ilmu Manajemen Indonesia (STIMI) Banjarmasin, Kuripan, Banjarmasin,
Indonesia
Keywords: POFit, Developing Expectancy, OCB, Employee Peformance.
Abstract: The study was conducted to explore the relationship of Person Organization Fit (POFit), and Developing
Expectancy on Orgaizational Citizenship Behaviour (OCB) and Employee Peformance on Local Water
Companies in South Kalimantan Province. The populatian of this study is 1277 employees of Local Water
Companies in Regencies and Cities of South Kalimantan Province. In order to determine the sample, this
study used Harun Al Rasyid Formula. The questionnaires were distributed to 168 sample respondents. The
data were analyzed by using AMOS Software Version 20.0 and equation of SEM model. The result showed
that Developing Expectancy has no influence on OCB. However each variabel POFit and Developing
Expectancy has a significant influence on Employee Peformance. OCB has a significant influence on
Employee Peformance.
1 INTRODUCTION
The quality of employees is one of the keys in
determining the development of an organization, both
institutions and companies. It is the driving force of
an organization. To achieve organizational
objectives, professional employees are required.
Therefore, an organization can experience growth and
sustainability depending on the performance of its
employees. Employee’s Performance is the
responsibility of every company. It ranges from
recruitment to employee’s satisfaction while doing
the job. When they feel comfortable with their work
without excessive burden, it will give satisfaction.
The satisfaction encourages a good performance for
the company through their increased performance. So
the providing services to consumers will be better.
Consequently, it will create a good impact for
improving the company’s performance.
Theoretically, there are some concepts affecting
the employee’s performance such as; Person
Organization Fit, (Kristof, 1996; Netemeyer et al.,
1999, Valentine et al., 2002; Vancouver et al., 1994)
and Developing Expectancy, (Wund And Stern in
Walgito (2005:224), Charles R. Synder (1994), and
Victor H. Vroom (1964) Furthermore, based on
empirical studies on The Influence of Organizational
Citizenship behavior (OCB) on employee’s
performance as intervening variables, Dennis Organ
(1997), Barnard (in Jahangir, Akbar, Haq, 2004),
Podsakoff, et al. (2009)
Based on the Background above, the problems
proposed are as follows:
Does Person Organization Fit (POFit) have
significant influence on Organizational Citizenship
Behaviour (OCB) of local Water Companies in South
Kalimantan Province?
Does Developing Expectancy have significant
influence on Organizational Citizenship Behaviour
(OCB) of local Water Companies in South
Kalimantan Province?
Does Person Organization Fit (POFit) have
significant influence on Employee Peformance of
local Water Companies in South Kalimantan
Province?Does Developing Expectancy have
significant influence on Employee Peformance of
local Water Companies in South Kalimantan
Province?
Does Organizational Citizenship Behaviour
(OCB) have significant influence on Employee
Jaya, F., , S., Rudiansyah, M. and Rusvitawati, D.
The Influence of Person Organization Fit (POFit), and Developing Expectancy on Organizational Citizenship Behaviour (OCB) and Employee Peformance of Local Water Companies in South
Kalimantan Province.
DOI: 10.5220/0009023200002297
In Proceedings of the Borneo International Conference on Education and Social Sciences (BICESS 2018), pages 501-509
ISBN: 978-989-758-470-1
Copyright
c
2022 by SCITEPRESS – Science and Technology Publications, Lda. All rights reserved
501

Peformance of local Water Companies in South
Kalimantan Province?
2 LITERATURE REVIEW
2.1 Person Organization Fit (POFit)
Person Organization Fit (P-O Fit) is broadly defined
as the compatibility between organizational values
and individual values, (Kristof, 1996; Netemeyer et
al., 1999; Vancouver et al., 1994). It is the
appropriateness between individual personality and
organizational characteristics (Bowen et al, 1997). It
is a multidimensional building consisting of three
types: values, personality, and work environment,
Handler (2004). The suitability between employees
and organizations is strongly emphasized in PO Fit
(Barrick,et.al.2005). Robert L. Mathis and John H.
Jackson (2004: 191) define Person Organization Fit
as the congruence between individuals and
organizational factors. It means that Individual
suitability with the organization is an adjustment
between the individual with the factors of the
company's organization. A selection method takes
into account the suitability between the individual and
the valuesof the organization. It is a technique that
places the selection process as a means to interact
between the organization and the individual. Person
Job Fit and Person Organization Fit are taken into
account and defined simply rather than the traditional
selection model. According to Bowen et.al (1997: 48)
the selection indicators of Person Organization Fit are
as follows: suitability of knowledge of prospective
employees with organizational values, conformity of
candidate’s skills with organizational values,
conformity of candidate’s capability with
organizational values, suitability of candidate needs
with environmental values of organization,
conformity between personal values of prospective
employees and organizational values.
2.2 Developing Expectancy
Wundt and Stren in Walgito (2005) according to
Wundt there are three kinds of dimensions of feelings
prossessed by a person, the first dimension is the
feeling of pleasure or displeasure experienced by the
individual, second dimension is a exited feeling and
innert feeling and third dimension is a expectancy
feeling and release feeling. And stern distinguish
feelings in three groups to as feeling now, feelings are
coming, feeling of the past. Charles R Syander (1994)
view this theory on the influence of positive thought,
he thinks Expectancy is the whole of the ability of the
individual to generate the path to achieve the desired
goal, along with the motivation to use the pathways.
And Victor H Vroom (1964) in his Expectancy theory
trying to explain what drives individuals to make
decisions. First every individual believes that he
behaves in certain way, then he will gain certain
things (Outcome Expectancy), second each result has
a value or appeal to a particular person (Valence), and
third each result relates to a perception of how
difficult it is to achieve that result (Effort Expectancy
2.3 Organizational Citizenship
Behaviour (OCB)
Dennis Organ (1997) first proposed the concept of
OCB. He defines it as individual behavior that is
discretionary or explicitly recognized by the formal
reward system. It prompts the effective functioning of
the organization. By discretionary, the behavior is not
an enforceable requirement of the role or job
description. It is the obvious specifiable terms of the
person's employment contract with the organization.
The behavior is rather a matter of personal choice that
its omission is not generally understood as
punishable. OCB is an individual voluntary behavior
beyond a job description that is explicitly recognized
by a formal reward system. It can improve
effectiveness of an organization. Barnard (in
Jahangir, Akbar, Haq, 2004) stated a similar concept
of OCB as the willingness of individuals to contribute
cooperative efforts to attain the organizational goals
effectively. Podsakoff, et al. (2009) states OCB
affects not only for the organization but also for
individuals. employees displaying OCBs will tend to
get better performance ratings from their leaders than
those who do not feature OCB. The OCBs employees
will be preferred and considered more favorable to
the organization. The leaders are aware that OCB
plays an important role in the success of an
organization. As a form of an employee's
commitment, it will assess the performance of
employees. Furthermore, a better employee
performance appraisal is often associated with
rewards, promotions, or bonuses. OCB has shown
some positive impact on employee performance and
ultimately leads to organizational effectiveness.
Based on the opinions of Dennis Organ (1997) and
Podsakoff, et.al. (2009), it can be stated that
Organizational Citizenship Behavior (OCB) has 8
dimensions or indicators as follows: Altruism,
Courtesy, Sportsmanship, Civic Virtue,
Conscientiousness, Organizational compliance,
Organizational loyalty, Self development.
BICESS 2018 - Borneo International Conference On Education And Social
502
2.4 Employee Performance
Employee performance is work result of employees
both in quality and quantity in achieving the job
requirements provided. It is based on predetermined
work standards (Simamora, 2007: 500). It ,according
to Robbins, S.P. (2007: 145), is a measure of
effectiveness in achieving the goal. It is the ratio of
the effective output and the input required to achieve
the goal. So if a person has been accepted and placed
in a particular work unit he must be managed to show
his good performance. The leader must be responsible
for his performance. Meanwhile, according to Dessler
(2006: 87) stated that it is the comparison between the
actual achievement and the expected performance of
employees. The expected work performance is a
standard achievement arranged as a reference in
accordance with its position compared with the
standards made. In addition it can also show the
employee’s performance against the other employees.
Mathis and Jackson (2006) state that there are several
dimensions of performance, they are: Quantity,
Quality, Timeliness, Attendance, Ability to work
together. These dimensions, according to Gomes,
F.C., et.al. (2001) expand the dimensions of
employee’s performance based on: work quantity,
work quality, Job Knowledge, Creativeness.
Meanwhile, according to Bernarddin and Russel (in
Ruky, 2006: 15) performance is defined as the record
of outcomes produced on a specified job function
during the period. Bernarddin and Russell (1995)
proposed six primary criteria that can be used to
measure performance: Quality, Quantity, Timeliness,
Cost effectiveness, Need for supervision,
Interpersonal Impact. Soedjono (2005) mentions 6
criteria that can be used to measure the performance
of employees: Quality, Quantity, Timeliness,
Effectiveness, Self-reliance, and Work commitment.
Not all performance measurement criteria are used to
appraise l in an employee’s performance. It should be
adjusted to the type of work assessed.
The opinions of experts as an indicator of
employee’s performance in this research (Mathis and
Jackson (2006), Gomes, FC, et.al. (2001), Bernarddin
and Russel (1995), and Soedjono (2005) are
synergized. The indicators of employee’s
performance appraisal in the research are: work
quantity, work quality, timeliness, attendance, ability
to cooperation, job knowledge, creativeness, cost
effectiveness, need supervision, interpersonal impact,
outonomous, work commitment, and trust.
3 METHODOLOGY
3.1 Section Titles
According to Mohammad Nazir (2002:99) research
design is all the necessary processes in planning and
implementation research. In this design an image or
diagram is need to provide early clues to the clarity
of further research and to facilitate further data
analysis. This research is used to explore the
influence of latent variables : Person Organization
Fit, and Developing Expectancy on Organizational
Citizenship Behaviour and employess’s Peformance
of local water Companies in South Kalimantan
Province. This study identifies the causal relationship
between variables with explanatory survey method.
The definition of this survey method is limited to the
definition of the survey, where information is
collected form some populations as Burhan Bungin
(2009:112). It states that generally the definition of
the survey is limited to the definition of the sample,
in which information is collected from some
populations. The purpose of the survey are explaining
and studying the phenomenon with the relationship
of research variabels
3.2 Population and Sampling
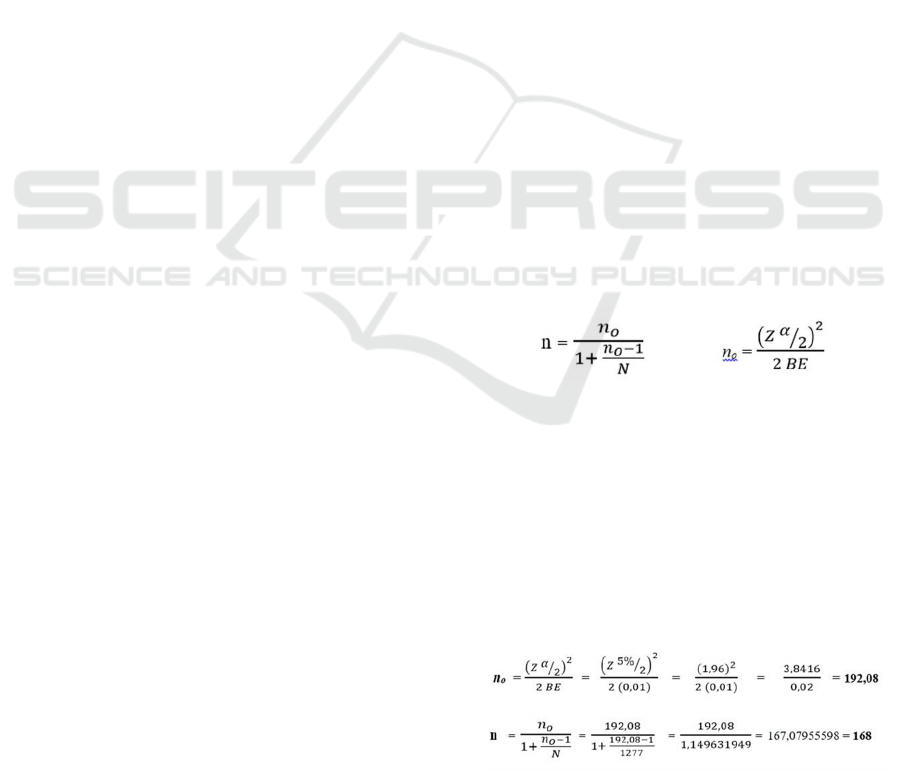
The Population of this study is 1277 employees of
local water companies in south Kalimantan Province.
According to Harun Alrasyid Formula (1991:36)
Note :
N = number of Emplyee
Population n = sample size of
respondent
α = Risk (5%)
BE = Bound of Eror
Based on the Harun Alrasyid Formula, the size of
the respondent’s sample in this study is as follows :
Based on Harun Alrasyid Formula Calculation,
the size of the sample is at least 168 respondents.
The Influence of Person Organization Fit (POFit), and Developing Expectancy on Organizational Citizenship Behaviour (OCB) and
Employee Peformance of Local Water Companies in South Kalimantan Province
503
Furthermore, according to Ferdinand (2006) to
conduct analysis by using Structural Equation
Modeling (SEM), the respondent sample used must
meet the requirement form 100 to 200 respondents.
Thus the number of samples of 168 respondents has
met the SEM criteria.
The data used in this research are valid and
reliable. The type of data used is quantitative data that
measures the influence person organization fit and
Developing Expectancy on Organizational
Citizenship Behaviour, and employee’s performance
based on the size scale, the type of data used is
ordinal, interval, and ratio. Besides they contain the
elements of naming and sequence, they also have
significant and comparable interval properties. Data
sources in this research are primary data and
secondary data. Primary data are obtained directly
from the respondents through the questionnaire.
Meanwhile the secondary data are obtained from
other parties who have collected and published the
data first.
This study aims to explore and analyze the causal
relationship between exogenous and endogenous
variables both intervening and dependent endogen. It
also aims to check the validity and reliability of the
research instrument as a whole. Therefore, Structural
Equation-Model (SEM) analysis technique using
AMOS program package (Analysis of Moment
Structure) version 22.0 is used
3.3 Validity Test
Ghozali (2011) states that validity means the accuracy
of a measuring instrument in performing its function.
It has high validity if it performs its measuring
function well, or gives a measured result. According
to the purpose of the measurement, a valid measuring
instrument is not only able to disclose data accurately
but also provide a careful picture of the data. Being
careful means that the measurement is able to provide
a picture of the smallest differences of each subject.
Loading factor that has fulfilled the convergent
validity is when ≥ 0,5 (Ghozali, 2011).
3.4 Reliability Test
Realibility Test Besides validity, a measuring
instrument must also be reliable. It is reliable if it
gives consistent results. It can give relatively no
different results when the same subject is re-
measured. Reliability refers to the internal
consistency and stability of the value of a particular
measurement scale. It concentrates on the problem of
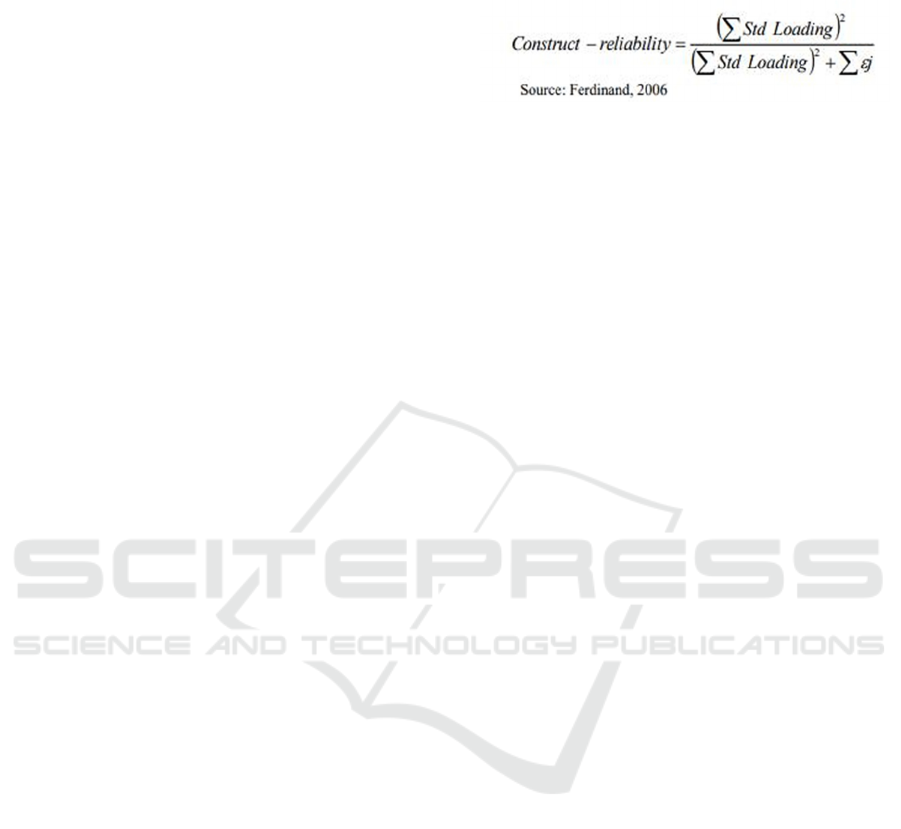
measurement accuracy and results. The approach
used to assess the magnitude of composite reliability
and variance - extracted from each construct is the
formulation as follows:
From the above formula, the Standard Loading is
obtained directly from standardized loading for
indicator (from AMOS calculation). €j is the
measurement error of each indicator. The score of this
extracted variance is recommended at a level of at
least 0.50 (Ferdinand, 2006). The limit score used to
assess an acceptable level of reliability is 0.60
(Nunully in Arikunto, 2003). If the research is
exploratory then the score below 0.60 is still
acceptable along with the empirical reasons seen in
the exploration process.
3.5 Hypothesis Testing
The research is about the Influence of Person
organization fit and Development Expectancy on
Organizational Citizenship Behaviour, and
employee’s Performance of Local Water Companies
(PDAM) in South Kalimantan Province. In
conducting hypothesis testing, the data obtained are
then processed in accordance with the needs of the
analysis. For the purposes of discussion, data
processed and presented are based on the principles
of descriptive statistics. Meanwhile for the purposes
of hypothesis analysis and testing it uses inferential
statistics. To test the hypothesis it uses multivariate
analysis with Structural Equation Model (SEM) by
using program of AMOS version 22.0. Test is done to
identify whether the proposed hypothesis can be
accepted by comparing probability score (p) with
significant level of α which is determined equal to
0,05. If the probability scores (P) is smaller than α
(0.05), then the hypothesis is acceptable. Vice versa,
if the probability score (p) is greater than the score of
α (0.05), then the hypothesis is not accepted.
However, prior to hypothesis testing, confirmatory
factor analysis is firstly done to see the dimensions
that can be used to form factors or constructs.
3.6 SEM Model Analysis
Statistical analysis of inferential data using the
Structural Equation Model (SEM) technique allows a
researcher to examine several dependent variables
with some independent variables (Ferdinand, 2006).
Thus the indixes that can be used to test the feasibility
of a model can be summarized in the following table.
BICESS 2018 - Borneo International Conference On Education And Social
504

Table 1. Index Goodness of Fit
N
o
Goodness o
f
Fi
t
Cut Off Value
Index
1.
Chi-square
≤ X
2
table
2. Probabilit
y
≥ 0.05
3. CMIN/DF
≤ 2.00
4.
CFI
≥ 0.95
5.
RMSEA
≤ 0.08
6. GFI
≥ 0.90
7. AGFI
≥ 0.90
8.
TLI
≥ 0.95
Hypothesis testing is conducted by testing the
significance of regression based on F test at α = 0.05
on each coefficient equation, either directly or
partially. After testing the basic assumptions of SEM
and the test of conformity and statistical tests, the next
step is to modify the model that does not meet the
requirements of the tests done. After the model is
estimated, the residual must be small or close to zero.
The frequency distribution of the residual
covariance must be symmetric (Tabachnick and
Fidell, 2007). Hair et al. (1998) provides a guide to
consider whether modifications should be made to a
model or not by looking at a number of residuals
produced by the model. If the residual amount is
greater than 5% of all residual covariance, then
modification needs to be considered. If the residual
score is too large (> 2.58), then another way of
modifying is to consider adding a new path to the
estimated model.
4 RESULT AND DISCUSSION
4.1 Instrument Validity Test
Validity test instrument aims at discovering the level
of validity or degree of accuracy of the instrument
used in data collection. An instrument is valid if it is
able to measure what is desired, and can reveal the
data of the variables studied appropriately. The high
degree of validity indicates the extent to which the
data collected does not deviate from the description
of the variable in question. The validity of an item /
instrument indicator can be determined by comparing
the Pearson Product Moment correlation index on a
significance level of 95% degree of confidence with
a critical value r-table at the significance level of α =
5% on its degrees of freedom = n- (k + 1) = 105- (4 +
1) = 100 is 0.196
The Test Result of Validity and Reliability of the
Instrument can be Explained Below :
The result of Product Moment Correlation test on
variable Person Organization Fit (X
1) shows a
significant correlation indicated by the score table of
Pearson Product Moment correlation index value
which is greater than r-table so that instrument to all
indicators forming variable Person Organization Fit
(X
1) is valid to test the hypothesis. The result of
Product Moment Correlation test on variable
Developing Expectancy (X
2) shows a significant
correlation indicated by the score table of Pearson
Product Moment correlation index value which is
greater than r-table so that instrument to all indicators
forming variable Developing Expectancy (X
2) is valid
to test the hypothesis. The result of Product Moment
Correlation Test on Organizational Citizenship
Behavior (Z) variable correlated significantly with
the score table indicated by the Pearson Product
Moment correlation index value, which is greater
than the r-table so that the instrument against all the
indicators forming the Organizational Citizenship
Behavior (Z) variable is valid to test the hypothesis.
The result of the test of the product moment
correlation on employees’ performance variable (Y)
shows a significant correlation. This is indicated by
the Pearson Product Moment score table correlation
index value that is greater than the r-table so that the
instrument of all indicators forming Employee
Performance (Y) is valid and can be used to test the
hypothesis.
4.2 Instrument Reliability Test
The aim of reliability test is to discover the
consistency of measuring instruments used. The
questionnaire as a measuring tool is consistent when
it gives the consistent results for repeatedly
measuring. Nunully in Arikunto (2003) states that an
indicator is considered reliable if the Cronbach alpha
value is > 0.60. The result of instrument reliability can
be seen as follows:
Table 2. The Result of Questionnaire Reliability
Variable
Reliability
Description
POFit
0,912
Reliable
Developing Expectanc
y
0,817
Reliable
OCB
0.930
Reliable
Employee Performance
0.959
Reliable
Table 2 shows that all variables tested are reliable
because each variable has the value that is greater
than 0.60. The conclusion is that the reliability value
The Influence of Person Organization Fit (POFit), and Developing Expectancy on Organizational Citizenship Behaviour (OCB) and
Employee Peformance of Local Water Companies in South Kalimantan Province
505
is categorized very high because it is in the range
above 0.80.
4.3 The Test of Confirmatory Factor
Analysis (CFA)
This section presents the results of preliminary
analysis before testing the full model of structural
equations (SEM). The latent variables in the research
model will be examined by discussing the level of
reliability in building the variables through the
Confirmatory Factor Analysis (CFA) model.
Confirmatory Factor Analysis (CFA) Test and
Convergent Validity Test are conducted to confirm
every indicator that has been made based on previous
research and existing theories is valid to explain the
construct of research variables consisting of Person
Organization Fit and Developing Expectancy,
Organizational Citizenship Behavior, and Employee
Performance. Confirmatory Factor Analysis (CFA)
test results meet criteria if Critical Ratio (CR) is >
1.96 with its Probability is 0.5.
The following is the result of the Confirmatory
Factor Analysis (CFA) test of the significance of each
loading value of the former indicator of Person
Organization Fit (X
1) construct.
Table 3. CFA Person Organization Fit (X1)
Indicator SLE
C
R
P
Descri
p
tion
Knowledge (X
1.1
) 0.721 fix fix
Valid
Skill (X
1.2
)
0.703
8.258 ***
Valid
Abilities (X
1.3
)
0.711
8.518 ***
Valid
Personal Needs (X
1.4
)
0.642
7.758 ***
Valid
Personal Value (X
1.5
)
0.690
8.235 ***
Valid
Table 3 above shows that the loading value factor
of Knowledge (X
1.1) is 0.721 greater than 0.5
meaning that the valid indicator can be applied to
measure the person organization fit construct.
Similarly, the loading value factor of skill (X
1.2) is
0.703, the loading value factor of abilities (X1.3) is
0.711, loading value factor of Personal Needs (X1.4)
is 0.642, and the loading value factor of personal
value (X
1.5) is 0.690. It is shown that all indicators
have the value loading factor greater than 0.5 which
means they are valid and can be applied to measure
the constructs of the person organization fit.
The following is the result of the Confirmatory
Factor Analysis (CFA) test of the significance of
each loading value of the former indicator of
Developing Expectancy (X
2) construct
Table 4. CFA Developing Expectancy (X2)
Indicator SLE
C
R
P Descri
p
tion
Feeling (X
2.1
) 0.639 fix fix Valid
PositiveThinking(X
2.2
) 0.701
7.721 ***
Valid
Motivation (X
2.3
) 0.641
7.206 ***
Valid
Table 4 above shows that the loading value factor
of Feeling (X2.1) is 0.639 greater than 0.5 meaning
that the valid indicator can be applied to measure the
Developing Expectancy construct. Similarly, the
loading value factor of Positive Thingking (X
2.2) is
0.701, the loading value factor of Motivation (X2.3) is
0.641. It is shown that all indicators have the value
loading factor greater than 0.5 which means they are
valid and can be applied to measure the constructs of
the Developing Expectancy.
This is the result of the validity test of the
significance of each loading value of each former
indicator of Organizational Citizenship Behaviour
Construct (Z).
Table 5. CFA Organizational Citizenship Behaviour (Z)
Indicator
SLE CR P Description
Altruism
(
Z1
)
0.629 7.071 ***
Valid
Courtes
y
(
Z2
)
0.639 7.213 ***
Valid
S
p
ortmanshi
p
(
Z3
)
0.641 7.206 ***
Valid
Civic Virtue
(
Z4
)
0.661 7.285 ***
Valid
Conscientiousness
(
Z5
)
0.720 7.844 ***
Valid
Or
g
an Com
p
liance
(
Z6
)
0.701 7.711 ***
Valid
Or
g
an Lo
y
alt
y
(
Z7
)
0.667 7.395 ***
Valid
Self Develo
p
ment
(
Z8
)
0.656
fix
fix
Valid
Table 5 above shows that the loading factor value
of Altruism (Z
1) is 0.629 greater than 0.5 which
means that the valid indicator can be used to measure
the construct of Organizational Citizenship
Behavior. The value of loading factor of Courtesy
(Z
2.) is 0.629, the loading factor value of
Sportmanship (Z
3) is 0.639, the loading factor value
of Civic Virtue (Z
4) is 0.661, the loading factor value
of Conscientiousness (Z
5) is 0.720, the loading factor
value of Organizational Compliance (Z
6) is 0.701, the
loading factor value of Organizational Loyalty (Z
7) is
0.667 , and the loading factor value of Self
Development (Z
8) is 0.656. All indicators have the
loading factor values which are greater than 0.5.This
means that all the indicators are valid and can be
applied to measure the construct of Organizational
Citizenship Behavior.
Below is the result of the validity test of the
significance of each loading value of each former
indicator of the employees’ performance (Y).
BICESS 2018 - Borneo International Conference On Education And Social
506
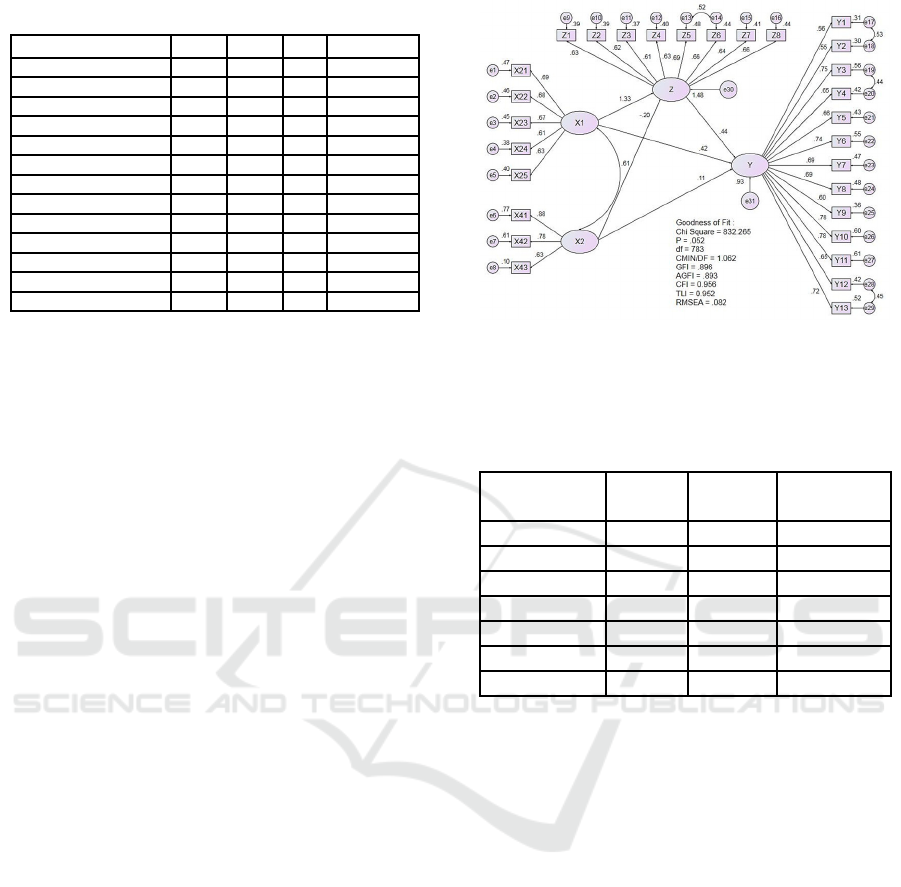
Table 6. CFA Employee Performance
Indicator SLE
CR P
Description
Quantity of Wor
k
0.598 Fix Fix
Valid
Quality of Wor
k
0.614
8.565 ***
Valid
Time Lines 0.763
6.307 ***
Valid
Attendance 0.671
5.758 ***
Valid
Ability to cooperat. 0.745
6.188 ***
Valid
Job Knowledge 0.747
6.171 ***
Valid
Creativeness
0.693
5.864 ***
Valid
Cost Effectiveness 0.680
5.799 ***
Valid
N
eed Supervision 0.623
5.390 ***
Valid
Interpersonal Imp. 0.767
6.232 ***
Valid
Outonomus 0.795
6.410 ***
Valid
Work Commitmen
t
0.698
5.870 ***
Valid
Trus
t
0.747
6.121 ***
Valid
Based on Table 6 above it can be explained that
the loading factor factor Quantity of Work (Y
1
.) is
0.598 greater than 0.5, which means that the indicator
is valid, can be used to measure construct Employee
Performance. Thus the value of loading factor Quality
of Work (Y
2
) is 0.614, Time Lines (Y
3
.) Is 0.763,
Attendance (Y
4
) is 0.671, Ability to Cooperation (Y
5
.)
is 0.745, Job Knowledge (Y
6
) is 0.747, Creativeness
(Y
7
) is 0.693, Cost Effectiveness (Y
8
) is 0.680, Need
Supervision (Y
9
) is 0.623, Interpersonal Impact (Y
10
)
is 0.767, Outonomus (Y
11
) is 0.795, Work
Commitment (Y
12
) is 0.698 and Trust (Y
13
) is 0.747
which all indicators have a loading factor value
greater than 0.5. This means that all indicators
forming employee performance variable is valid and
can be used to measure the employee performance
construct.
4.4 Evaluation on the Criteria of the
Model
The following equation structure model is conducted
to discover the various assumptions required in this
study. It is also conducted to find out if there is the
need of modification of the Full Model. Based on
Table 7, it is known that the seven parameters of
goodness of fit index looks good, so the Model
Structure Equation modification can be seen in figure
1 below.
Figure 1. Structural Equation Model: Person Organization
fit and Develping Expectancy toward the Organizational
Citizenship Behaviour and Employees’ Performance
Table 7. Below shows the result of confirmatory factor
analysis on the value of goodness of fit index
Goodness of Cut off Resul
t
Evaluation
Fit Index Value Anal
y
sis Model
Chisquare ≤ X2tabel832.265 Goo
d
CMIN/DF ≤ 2,00 1.062 Goo
d
GFI ≥ 0,90 0.896 Mar
g
inal
AGFI ≥ 0,90 0.893 Mar
g
inal
CFI ≥ 0,95 0.956 Goo
d
TLI ≥ 0,95 0.952 Goo
d
RMSEA ≤ 0,08 0.082 Mar
g
inal
Based on Table 8 it is known that the four
parameters of the Goodness of Fit index are good,
and three parameters are marginal and therefore the
result of the Equation Structure Model can be used as
a basis for Assumption Testing in Structural Equation
Model (SEM).
4.5 Hypotesis Test of Structural
Equational Model
The following table is the result of the analysis of
hypothesis testing on the structural equation model of
Person Organization Fit and Developing
Expectancy on Organizational Citizenship
Behavior and Employee Performance.
The Influence of Person Organization Fit (POFit), and Developing Expectancy on Organizational Citizenship Behaviour (OCB) and
Employee Peformance of Local Water Companies in South Kalimantan Province
507
Table 8. Result of Hypotesis Test
Variabel Coef CR PValue Descr
POFit OCB 1.326 10.298 *** Si
g
DE OCB -0.197 -2.735 0.006
N
on si
g
POFit EP 0.421 6.388 *** Si
g
DE EP 0.105 1.844 0.065 Si
g
OCB EP 0.438 6.319 *** Si
g
Based on Table 8, the results hypothesis testing
can be explained of as follows:
Hypothesis one (H1) State the Person
Organization Fit affect Significantly on the
Organizational Citizenship Behaviour. The path
coefficient marked positive 1.326 with value of C.R.
10.298 is greater than 1.96, and that probability value
is *** < α equal 5%, meaning that Person
Organization Fit has a significant effect on
Organizational Citizenship Behaviour. Hypothesis
two (H2) Developing Expectancy affects
insignificantly to Organizational Citizenship
Behaviour. The negative path coefecient is –0.197
with value C.R. equal to (-2.735) to be smaller than
1.96, and that probability value equal to 0.006 > α
equal 5% meaning that Developing Expectancy has
no significant effect to Organizational Citizenship
Behaviour. Hypothesis three (H3) State the Person
Organization Fit affect Significantly on the Employee
Performance. The path coefficient marked positive
0.421 with value of C.R. 6.388 is greater than 1.96,
and that probability value is *** < α equal 5%,
meaning that Person Organization Fit has a
significant effect on Employe Performance.
Hypothesis Four (H4) Developing Expectancy affects
significantly to Employee Performance. The positive
path coefecient is 0.105 with value C.R. equal to
(1.844) to be smaller than 1.96, and that probability
value equal to 0.065 < α equal 5% meaning that
Developing Expectancy has significant effect to
Employee Performance. Hypotesis five (H5) states
the Organizational Citizenship Behaviour affect on
Employee Performance. The path coeffiecent marked
positive 0.438 with C.R Value of 6.319 is greater than
1.96 and the probability value is is *** < α equal 5%,
meaning that Organizational Citizenship Behaviour
has a significant effect on Employee Performance.
The Research conducted on the subject of local
water companies employees in south Kalimantan
province show that Developing Expectancy which is
has no significant effect on Organizational
Citizenship Behaviour, but significant effect on
Employee Peformance. The finding show that
feeling, Positif Thingking, and motivation is not have
effect on Organizational Citizenship Behaviour
because Organizational Citizenship Behaviour in
local water companies employees in south
Kalimantan province is different they have other
expectancy on this job.
6 CONCLUSION
The perception of Person Organization Fit has a
positively significant effect on the Organizational
Citizenship Behavior, as it is shown from the test
result. If the perception of Person Organization Fit on
the Organizational Citizenship Behavior is well
applied to local water companies employee in south
Kalimantan, then the organizational citizenship
behavior will be better or fit. The Perception
Developing Expectancy to Organizational
Citizenship Behaviour of local water companies
employee in south Kalimantan is very low. As the
result, it can be stated the Developing Expectancy is
not significant and does not affect the organizational
Citizenship Behaviour on local water companies
employee in south Kalimantan. The perception of
Person Organization Fit has a positively significant
effect on Employee Performance, because it has been
verified. If the perception of Person Organization Fit
on Employee Performance is applied well to local
water companies employee in south Kalimantan, then
the performance of the employees will be better. The
perception of Developing Expectancy has a positively
significant effect on Employee Performance, because
it has been verified. If the perception of Developing
Expectancy on Employee Performance is applied
well to local water companies employee in south
Kalimantan, then the performance of the employees
will be better. The perception of Organizational
Citizenship Behavior significantly influences the
performance of local water companies employee in
south Kalimantan Province. Because it has been
verified. It means that if the perception of
Organizational Citizenship Behavior is applied
properly, then the performance of employees will be
better.
Some suggestions are recommended to the
owners and the coach. The coach is either the Mayor
or the regent needs to delegate some of his
authorithies on the selection of the requirement and
palacement of employees below the Board of
Directors. The employess need the Developing
Expectancy in this companies to make the
Performance will be better, and the leaders of local
BICESS 2018 - Borneo International Conference On Education And Social
508

water companies employee in south Kalimantan
Province can optimize Person Organization Fit.
REFERENCES
Jahangir, Nadim, Akbar M.M, Haq, Mahmudul. 2004.
Organizational Citizenship Behavior : Its Nature and
Antecedents. BRAC University Journal, Vol. 1, No. 2,
75-85
Barrick, R. Murray and Mount, K. Michael. (2005). Yes,
Personality Matters: Moving On To More Important
Matters. Human performance, 18(4), 359- 372.
Bernarddin, H.John, dan Joyce E.A.Russel. 1995. Human
Resource Management : An Experential Approach.
Singapore: Mc. Graw Hill, Inc.
Ruky, A. 2006. Sumber Daya Manusia Berkualitas
Mengubah Visi Menjadi Realitas. Cetakan Kedua.
Jakarta: PT. Gramedia Pustaka Utama.
Bowen, DE., Ledford, GE and Nathan,BR., 1997. Hiring
for The Organization, Not The Job, Academy of
Management Executive, Vol. 5., No. 5.
Bungin, Burhan, 2009. Metode Penelitian Kuantitatif,
Kencana Prenada Media Group, Jakarta.
Snyder, C.R. (1994). The Psychology of Hope: You can get
there from here. New York: The Free Press.
Organ, Dennis,W., 1997. Organizational Citizenship
Behavior: The Good Soldier Syndrome. Lexington,
MA: Lexington Books.
Dessler, Gary, 2006. Human Resource Management
(Manajemen Sumber Daya Manusia), Edisi ke 9 Jilid 2,
Edisi Bahasa Indonesia, Indeks, Jakarta.
Ferdinand, Augusty, 2006. Metode Penelitian Manajemen:
Pedoman Penelitian untuk Skripsi, Tesis dan Disertasi
Ilmu Manajemen, Semarang: Badan Penerbit
Universitas Diponegoro.
Ghozali, Imam, 2011. Aplikasi Analisis Multivariate
Dengan Program SPSS, Semarang, UNDIP.
Gomes, Luis R. Meija ; David Balkin ; Robert L Candy,
2001. Managing Human Resources , Edition 3, Prentice
Hall International., Inc. New York.
Hair, Joseph F., Raph E Anderson, Ronal L. Tatam, and
William C. Black, 1998. Multivariate Analysis, Fifth
Edition, Prentice Hall International Inc.
Handler, Charles, 2004. The Value of Person Organization
Fit ere Networking, Prentice Hall International., Inc.
New York.
Al Rasyid, Harun, 1991. Tekhnik Sampling, Penyelesaian
Soal Tekhnik Sampling, Program Studi Pascasarjana
Universitas Padjajaran, Bandung
Kristof, A.L., (1996). Person Organization Fit: an
integrative review of its conceptualizations,
measurement, and implication. Personnel Psychology
49. 1-49.
Mathis, R.L., & J.H. Jackson, 2006. Human Resource
Management, Terjem. Diana Angelicia, Edisi 10,
Thomson, Salemba Empat, Jakarta.
Nazir, Mohammad, 2002. Metode Penelitian, Cetakan
Kelima, Ghalia, Jakarta.
Netemeyer, R.G.,Boles, S.B., McKee, D.O., 1999. An
Investigation into The Antecedents or Organizational
Citizenship Behaviors in a Personal Selling Conteext,
Journal of Marketing., Vol. 61 : 85-98
Arikunto, Suharsimi, 2003. Prosedur Penelitian Suatu
Pendekatan Praktek, Edisi Revisi V, Rineka Cipta,
Jakarta
Podsakoff, Philip M., MacKenzie, S.B., Paine, J.B., dan
Bachrach, D.G., 2009. Organizational Citizenship
Behavior: a Critical Review of Theoretical Empirical
Literature and Suggestions for Future Research. Journal
of Management, 26 (3): 513-563
Robbins, Stephen P., 2007. Perilaku Organisasi, Buku I,
Edisi 12, Salemba Empat, Jakarta.
Mathis, Robert L dan Jackson, John H, 2004. Manajemen
Sumber Daya Manusia, Buku ke dua. Salemba Empat.
Jakarta
Simamora, Henry, 2004, Manajemen Sumber Daya
Manusia, Edisi Ketiga, Cetakan Pertama, Bagian
Penerbitan STIE YKPN, Yogyakarta.
Soedjono. 2005. Pengaruh Budaya Organisasi terhadap
Kinerja Organisasi dan kepuasan Kerja Karyawan
pada Terminal Penumpang Umum di Surabaya. Jurnal
Manajemen dan kewirausahaan Vol. 7 No. 1. STIESIA
Surabaya.
Tabachnick, B. G., dan Fidell, L.S. 2007. Using
Multivariate Statistics. Ed.5. Boston: Perason
Valentine, S., Godkin, L., Lucero, M., 2002. Ethical
Context, Organizational Commitment, and Person-
Organization Fit. Journal of Bussiness Ethics, 41: 349-
360
Vancouver,J.B., & Schmitt, N.W., (1994), An Exploratory
Examination of Person Organization Fit: Organization
Goal Congruence. Personnel Psychology.
Vroom, Victor H. 1964. Work and Motivation. New York:
John Wiley & Sons.
Walgito, Bimo, (2005), Pengantar Psikologi Umum,
Yogyakarta: Penerbit ANDI, Tahun 2005
The Influence of Person Organization Fit (POFit), and Developing Expectancy on Organizational Citizenship Behaviour (OCB) and
Employee Peformance of Local Water Companies in South Kalimantan Province
509
