Early Detection of Hungry Sensation for Efficiency of Healthy Food
Preparation
Bambang Triatma, Sus Widayani, Nasfati Iktarastiwi, Febry Fitri Astuti, and Tamara Ar-rum Sari
Home Economic Department, Technical Faculty, Semarang State University, Semarang, Indonesia
Keywords: hungry sensation, hunger feeling, early detection of hungry sensation.
Abstract: Job pressures often make people not feel hungry even though the physical condition is actually hungry.
This problem makes scheduling meals times very needed, that is why early detection of hunger is needed.
Metabolism in the human body is shown by the reaction between glucose and oxygen. The reaction
produces carbon dioxide gas, water, and energy. Carbon dioxide coming out of the human breath is taken as
a sample and immediately reacted with pure water. This reaction will increase the acidity of pure water.
The higher the CO
2
content thas is included, the higher the acidity of the water. High CO
2
from the breath
indicates that the metabolic rate is high. On the contrary, the high CO
2
is indicated by the low pH value.
Therefore, when pH is at that peak, it shows that the metabolic rate is at its lowest. Achieving the lowest
point of metabolic rate becomes an indicator that that's where humans begin to feel hungry. Research found
that the highest point of pH was reached at 90th minute after eating (predictions from the 90th minute to the
120th minute). Than we conclude that that the starting point of hunger was detected in the 90th minute after
meals.
1 INTRODUCTION
Preparing food for the people needs to be done with
the right time so that when the food is ready to be
served, the person who wants to consume is also
right to be hungry. sick due to late eating. Problems
that occur in society are the time points of ripe food
often not at the same time as the starting point of
hunger, due to the ignorance of the food preparation
about when the consumer starts to get hungry. The
event will waste food preparation management
funds. The risk of inefficiency can be minimized
using early detection of hunger.
The problem of this research is that human speed
metabolizes nutrients starting from digesting food,
absorbing, and utilizing nutrients varying from one
another. The average and standard deviation of
metabolic rate needs to be measured between a
group of the same age and sex. Nutritional
metabolism in a nutshell is a reaction: C
6
H
12
O
6
+ 6
O
2
6 CO
2
+ 6 H
2
O + 675 kcal of energy as
written by Winarno (1995). The speed of nutritional
metabolism occurs in a fluctuating manner, when the
supply of glucosate is high, the reaction tends to be
fast, otherwise it is low in glucose, the reaction
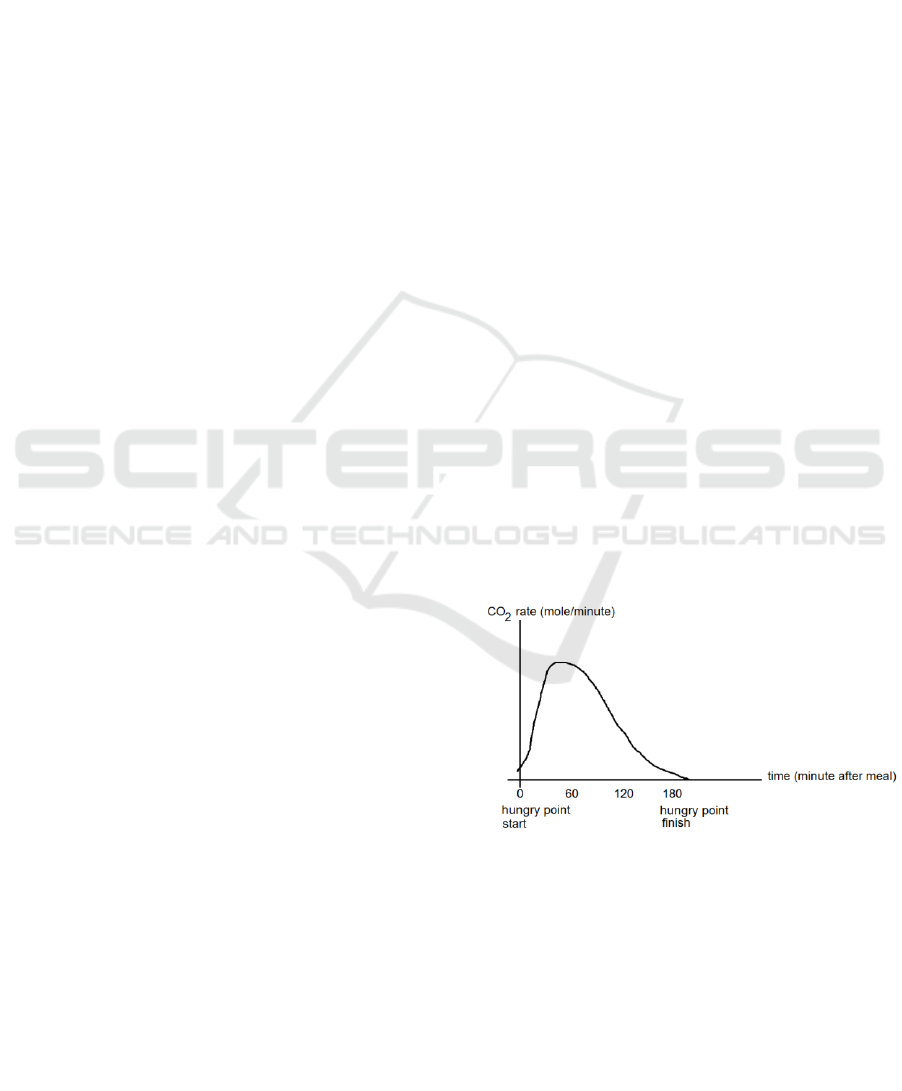
slows down. The rate of metabolism after meals, if
associated with increasing time, will form a chart
from low, rise to the top, reach the top, and begin to
decline. The chart pattern that is formed (Fig. 1.) can
be used to predict when a person starts to get hungry
again.
Figure 1: Theoritical correlation between time and CO
2
rate.
Therefore this research will answer the problem: 1.
How is the pattern of nutritional metabolism rate
(equivalent to CO
2
production of mole / minute / kg
of body weight) along with the increase in time after
eating (post feeding). 2. Is there a real correlation
between high / low metabolic rate and feeling of
fullness / hunger.
Triatma, B., Widayani, S., Iktarastiwi, N., Astuti, F. and Sari, T.
Early Detection of Hungry Sensation for Efficiency of Healthy Food Preparation.
DOI: 10.5220/0009012404210424
In Proceedings of the 7th Engineering International Conference on Education, Concept and Application on Green Technology (EIC 2018), pages 421-424
ISBN: 978-989-758-411-4
Copyright
c
2020 by SCITEPRESS – Science and Technology Publications, Lda. All rights reserved
421

2 PURPOSE AND
CONTRIBUTION
The study aims to: 1. Get a picture of the rate of
nutritional metabolism as time increases after eating,
2. Testing is there an associative relationship
between high / low metabolic rate and feeling of
fullness / hunger.
Research contribution is create an associative
relationship between high / low metabolic rate and
feeling of fullness / hunger, and how the trend
changes over time, then this study becomes the basis
for finding early hunger detection devices based on
one's breath, which CO
2
can be absorbed using in
the breath. special paper that has been moistened
with Ca(OH)
2
, the decrease in pH that occurs can be
converted into digital form containing predictions
about how many more minutes a person will begin
to get hungry again.
3 LITERATURE
Metabolism is a series of solutions (analysis) and the
re-establishment (synthesis) of nutrients in the
human body. Analysis reactions break down glucose
molecules into water and carbon dioxide gas as
follows:
C
6
H
12
O
6
+ 6 O
2
6 CO
2
+ 6 H
2
O which also
produces energy of 675 kcal per mole of C
6
H
12
O
6
.
This energy is then stored in the form of chemical
bonds between Adenine (A) and phosphate (P)
groups to form Adenine mono phosphate (AMP).
Next E + P + AMP -> ADP (Adenosine in
Phosphate). Next E + P + ADP -> ATP (Adenosine
Tri Phosphate). When energy is reused, ATP is
broken down again into ADP + P + energy, and so
on ADP -> AMP + P, then AMP -> A + P + energy.
The biochemical changes occur in the body cells,
while the changes have an impact on the body is the
production of CO2 and H2O gas which is discharged
through the airways (Williams and Caliendo, 1984).
Measurement of nutritional substance during
metabolism according to Whitney and Rolfes (2006)
consist of synthesis and analysis reaction occured in
the body. The synthesis is for example glucose +
glucose + energy into glycogen. There is also the
synthesis of triglycerides from glycerol + fatty acids
+ energy. Other syntheses such as amino acids +
amino acids + energy into proteins Analysis reaction
is the opposite of synthesis. Both reactions are called
metabolism, which requires energy equilibrium.
Energy in body cells is produced in components
called mitochondria which are kitchen energy. When
the body is over-energized, the excess is stored in
the liver in the form of glycogen and partly as fat
tissue under the skin. Excess protein will be
removed in the form of urine through urine. When 2-
3 hours after eating, the body becomes deficient in
energy, the body breaks down stored glycogen in the
liver and fat under the skin, burns it into energy. As
an excess of burning glycogen, CO
2
and H
2
O are
released through the airways. Production rate CO
2
per minute per kg of body weight is an indicator of
the speed of nutritional metabolism. The amount of
CO
2
can be determined by capturing it using lime
water solution of Ca(OH)
2
by reaction: CO
2
+
Ca(OH)
2
CaCO
3
+ H
2
O.
Under conditions of severe energy shortage,
which is 24 hours after energy starvation, the body
begins to break down proteins into amino acids to
get energy for the activities of the brain and central
nervous system. Whitney and Rolfes (2006) also say
that when hungry, the body slows energy use and fat
loss. Hunger conditions also trigger slowing of heart
rate, respiration rate, and slowing down the rate of
metabolism. So at the time after the last meal (post
feeding) the metabolic rate will be slower.
Measurement of the rate of metabolic deceleration
has the potential to be one indicator of hunger. In
conditions of hunger, body temperature also
decreases, in addition to less sharp vision.
Center for Sense of Loneliness / Hungry.
Stark, Reichenbach, and Andrews (2015) say that
homeostatic maintenance of energy requires
integration with a component in the center of the
brain, called hypothalamic. Hypotalamic is
responsible for receiving feedback when the body
lacks glucose, amino acids, and metabolic hormones
such as insulin, leptin and ghrelin. So hypothalamic
receives information if the body is starting to starve
for energy sources. Hypothalamic ability to maintain
energy balance is due to carnitine metabolism.
Thanks to this hypothalamic ability, the body can
receive messages when the body is full or hungry.
4 METHOD
The research was conducted between September
2017 until September 2018, located in the Home
Economic Department under Technical Faculty
(TF), Semarang State University (SSU). This study
took humans (Home Economic students of TF-SSU)
as sample volunteers. The form of research is a quasi
experiment, while the data taken in the form of
breathing CO
2
production rate after 0 minutes, 60
EIC 2018 - The 7th Engineering International Conference (EIC), Engineering International Conference on Education, Concept and
Application on Green Technology
422
minutes, 120 minutes and 180 minutes since eating
equal 300 kcal. Volunteers who were taken as many
as 16 people aged 20 years were female, with the
same nutritional status (body mass index). Data was
taken by: volunteers were asked to exhale for 3
seconds at a specified time, hold it in an airtight
plastic wrapper. The CO
2
content is then measured
by dissolving it into a solution of Ca (OH)
2
0.5
Molarity in order to form the precipitating CaCO
3
salt, as presented below: CO2 + Ca (OH)
2
CaCO
3
+ H
2
O, then the remaining Ca (OH)
2
titrated using
HCl to find out the amount of Ca (OH)
2
remaining.
The data is then presented in graphical form as Fig.
1.
The data were then analyzed for changes from
the 0
th
minute, 60
th
minute, 120
th
and 180
th
minutes.
The chart formed is an illustration of the rate of
nutritional metabolism as time increases after meals.
Volunteers were also asked to feel hungry / not at
the same time as CO
2
breath measurements. The
frequency of occurrence of hunger and high and low
levels of CO
2
breath is a test of the presence /
absence of associative relationships between
metabolic rate and feeling of fullness / hunger. The
analysis is carried out by contingency testing.
5 RESULT AND DISCUSSION
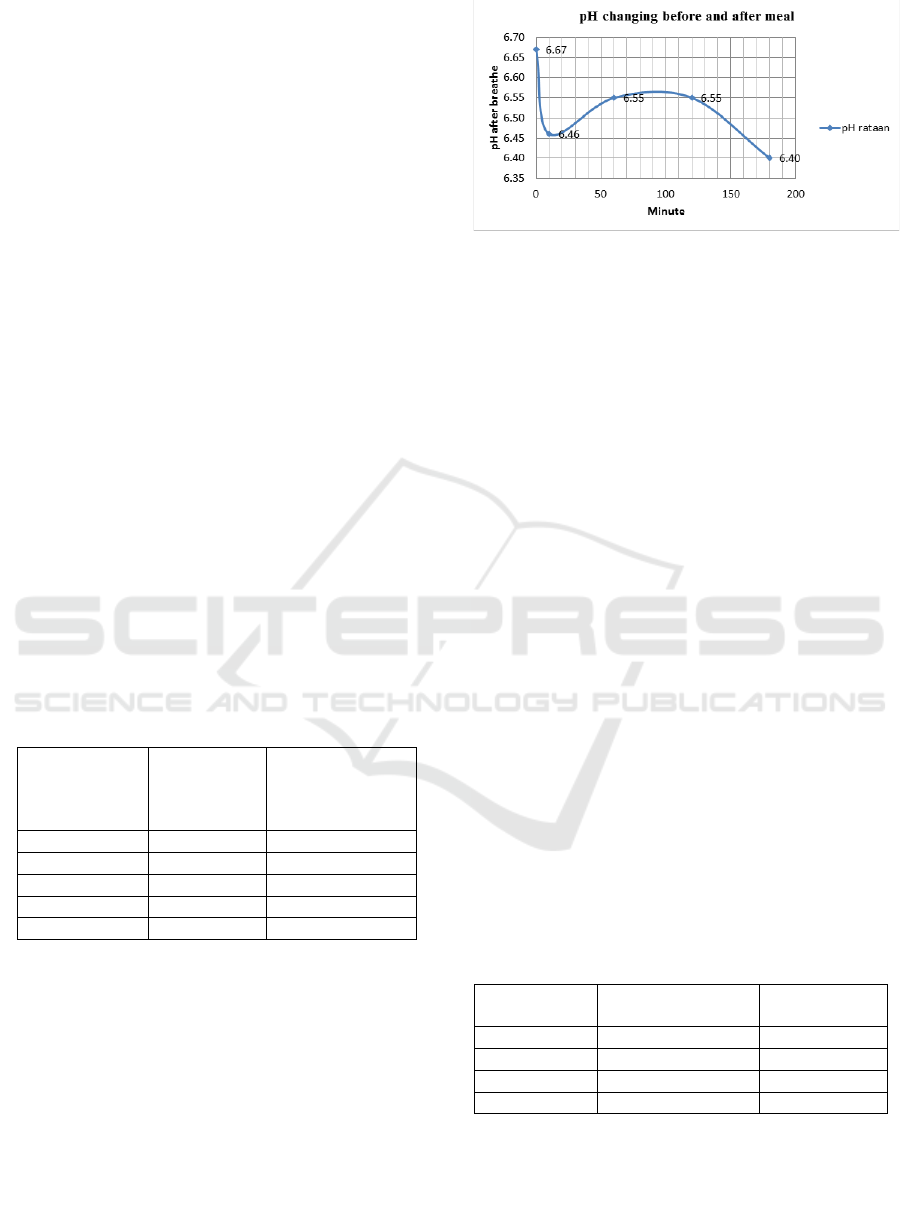
The study produced the data shown in Table 1.
Table 1: Mean and standard deviation of breathe solution
pH.
Time
(minute
before/after)
meal
Mean and
standard
deviation
Number of
samples
0 before
6.67 ± 0.12
12
0 after
6.46 ± 0.25
12
60 after
6.55 ± 0.28
12
120 after
6.55 ± 0.21
12
180 after
6.40 ± 0.29
12
The pH of pure water is 7.0. If the exhaust air is
blown into pure water from the breath, then CO
2
from the breath will compound with H
2
O, thus
forming H
2
CO
3
carbonic acid. Then H
2
CO
3
gives an
acidic atmosphere because it easily breaks down into
two H
+
ions and one CO
3
2-
ion. This additional H
+
ion will decrease the pH value from 7.0 to the scale
below it. Decreasing the pH value indicates an
increase in the level of H
+
ions in the system. The
correlation between time and pH provided in Fig. 2.
Figure 2: Real correlation between time and pH of breathe
solution.
At 0 seconds before eating up to 0 seconds after
eating an increase in H + ions is 1.33 x 10 -7 mole /
liter from an initial level of 2.14 x 10 -7 mole / liter
increasing to 3.47 x 10 -7 mole / liter . The incident
occurred in the 10-minute meal period. From the 0th
second after eating to the 60th second after eating, a
decrease in H + ion levels was 6.45 x 10⁻⁷ mole /
liter, from 3.47 x 10 -7 mole / liter to 2.82 x 10⁻⁷
mole / liter. Then from the 60th minute to the 120th
minute there was no change in the level of H + ions,
which remained at 2.82 x 10 -7 mole / liter. At this
stagnant phase, a hungry point is reached. From the
120th minute to the 180th there was another increase
in the H + ion level of 1.16 x 10 -7 mole / liter,
which is from the beginning of 2.82 x 10 -7 mole /
liter, rising to 3.98 x 10 -7 mole /liter.
The real pH of pure water before blowing the
breath is standardized to neutral pH 7.0. Suppose the
real pH = 7.3 then there is a correction number of
(7.3 - 7.0) = 0.3. This figure of 0.3 is then used to
correct the real pH of pure water after blowing the
breath. For example, the real pH after blowing the
breath = 6.4, then 6.4 minus 0.3 to 6.1 is the real
corrected pH as shown in Table 2.The correlation
between time and H
+
concentration of breathe
solution provided in Fig. 3.
Table 2: Difference in the level of H+ ions after blowing
for 6 seconds.
Time (minute
after) meal
Mean and standard
deviation
Number of
samples
0
(1.4 ± 1.3) x 10
-7
12
60
1.2x10
-7
± 9.2x10
-8
12
120
1.0x10
-7
± 5.6x10
-8
12
180
1.5x10
-7
± 9.3x10
-8
12
Early Detection of Hungry Sensation for Efficiency of Healthy Food Preparation
423
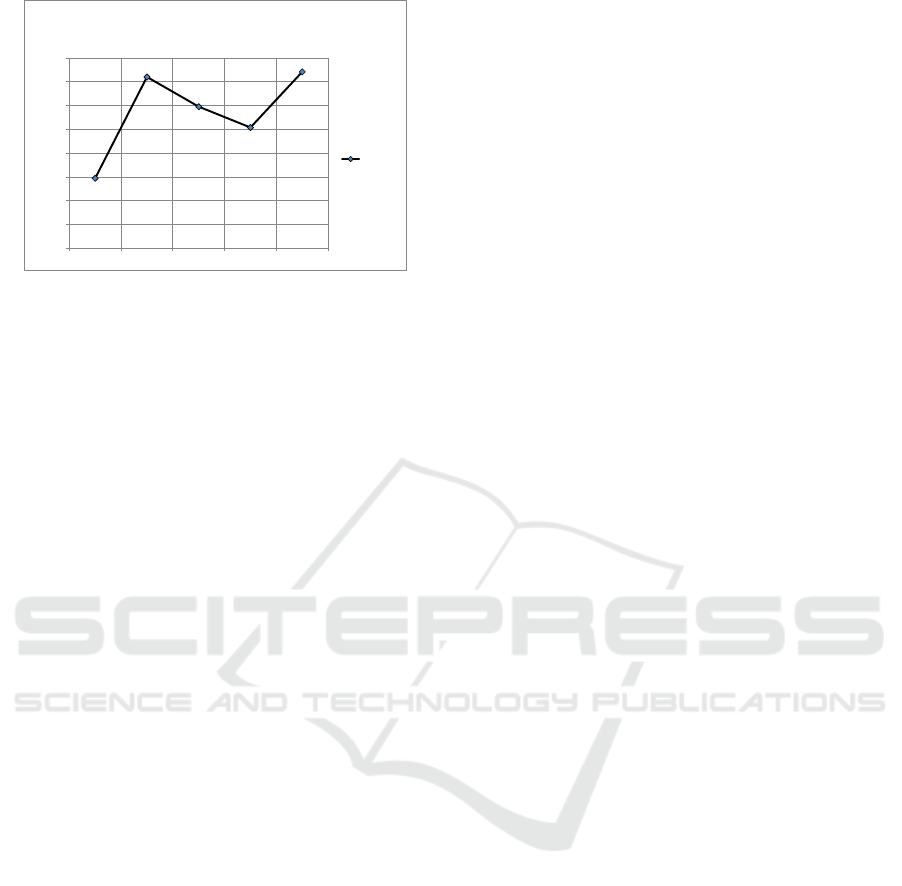
Figure 3: Real correlation between time and ion H
+
concentration of breathe solution.
6 CONCLUSION
It is suspected that the critical starting point is
reached at 120 minutes after eating. There are close
correlation between time after meal and metabolism
rate of human.
REFERENCES
Chaia, J., Diaoa, Q., Wang, H., Tu, T., Tao, X., & Zhang,
N. 2015. “Effects of weaning age on growth, nutrient
digestibility and metabolism, and serum parameters in
Hu lambs”. Chinese Association of Animal Science
and Veterinary. Vol. 1, Issue 4, pp. 344-348.
Gyamfi, D., & Danquah, K., O., 2016. “Chapter 1 –
Nutrients and Liver Metabolism”. Molecular Aspects
of Alcohol and Nutrition: A Volume in the Molecular
Nutrition Series 2016, pp. 3–15.
Hardinsyah & Drajat Martianto, 1989. Menaksir
Kecukupan Energi dan Protein serta Penilaian Mutu
Konsumsi Pangan. Jurusan GMSK, Faperta, IPB,
Bogor.
Jung, E. H. Childers, K., W., & Kim, H., S. 2015.
“Factors influencing the perceived credibility of diet-
nutrition information web sites”. Computers in Human
Behavior, Vol. 58, pp. 37-47
Stark, R., Reichenbach, A., & Andrews, Z., B., 2015.
“Hypothalamic carnitine metabolism integrates
nutrient and hormonal feedback to regulate energy
homeostasis”. Molecular and Cellular Endocrinology.
Vol. 418, Part 1, pp. 9–16
Stark, Reichenbach, & Andrews, 2015. Hungry for
Mechanism in Hippo Signaling, Cell. Vol. 151, Issue
6, pp. 1143-1145.
Whitney, E. & S.A. Rolfes, 2006. Understanding
Nutrition. 11
th
.ed. Thompson. Wadsworth.
Williams, Eleanor R., & M.A. Caliendo, 1984. Nutrition:
Principles, Issues and Applications. McGraw-Hill
Book Co., New York – Toronto.
[WNPG] Widyakarya Nasional Pangan dan Gizi. 2004.
Angka Kecukupan Energi dan Gizi yang Dianjurkan
bagi Orang Indonesia.
5.89063E-08
1.43912E-07
1.19021E-07
1.01488E-07
1.48299E-07
0
2E-08
4E-08
6E-08
8E-08
0.0000001
1.2E-07
1.4E-07
1.6E-07
0 10 60 120 180
Ion H+ changing as an indicator for CO2
production rate after having meal
mole/liter
EIC 2018 - The 7th Engineering International Conference (EIC), Engineering International Conference on Education, Concept and
Application on Green Technology
424
