
Slenderness Criterion for Isolated Confined Compression Member
based on EC2
Tee Horng Hean, Kousay Al-Sanjery and Jeffrey Choong Luin Chiang
Civil Engineering and Architect, Segi University, Malaysia
Keywords: Spiral, Confinement, Column, Slenderness, Eurocode.
Abstract: Clause 5.8.3.1. of the Eurocode 2 (EC2) recommends a slenderness limit (λ
lim
) for compressive members
where second order effects can be ignored. This equation shall be used to study the effects of lateral
reinforcements in the compressive member. The effects of spiral-shaped steel confinements on the reinforced
concrete columns of 9 numbers of 125mm×125mm×500mm reinforced concrete columns, all exceeding λ
lim
were investigated with one control column i.e. without any reinforcements, another four were confined with
single spiral of 50mm pitch and the last four were confined with double spiral of 100mm pitch. This result in
having the same volume of confinements introduced for all the confined concrete columns. The confinement
used for the concrete were mild steel rebars of 6mm diameter. It was found that with the introduction of
spiral-shaped steel confinements, the ultimate failure load of these columns exceeded the control sample and
hence there is a possibility of increasing the λ
lim
factor of EC2 by considering concrete confinements.
1 INTRODUCTION
For circular shaped reinforced concrete (RC)
columns, it is common for some countries to adopt
continuous spiral links. When closely spaced spiral
links are adopted, it can be considered as
confinements for concrete. Confinements enhance
reinforced concrete structural elements in
compression reducing the Poisson’s effect. The Code
of Practice, ACI 318-14 (ACI Committee 318, 2014)
recommends the provision of spiral reinforcements’
volume to approximately the strength of the column
cover / shell.
There had been researches carried out on confined
concrete elements which are normally short or also
known as stocky. For RC columns, researches
commonly carried out include adopting materials
such as fibre reinforced plastic / polymer (FRP),
carbon fibre reinforced polymer (CFRP), glass fibre
reinforced polymer (GFRP) and concrete-filled steel
tubes. There had not been many researches carried
out on the effects of confinements using ordinary
steel reinforcement bars on slender reinforced
concrete columns. More common would be
researches carried out to strengthen slender
reinforced concrete columns.
In Eurocode 2 (EC2) Clause 5.8.3.1 Slenderness
criterion for isolated members, it is recommended
that when the slenderness, λ is less than λ
lim
any
second order effects can be ignored. This research is
to investigate the effects of introducing confinements
in the form of spiral shaped mild steel in reinforced
concrete columns that exceeded the slenderness
criterion as per EC2 (Mosley et al., 2007; Bhatt et al.,
2014).
2 LITERATURE REVIEW
As early as mid-1890s, reinforcement in the form of
helical / spirals were adopted in concrete elements
and it was found that these elements have better
resistance compared to concrete with longitudinal
bars and lateral ties (Cusack, 1981). It is well noted
that increased compressive strength for confined
concrete would be expected since hooping actions
prevent the swelling of concrete and thereby able to
resist higher pressure (Considere, 1908). Stress-
strain relationship for plain concrete had been
developed by researchers Carreira and Chu (Carreira
and Chu, 1985) while Mander, Priestley and Park
developed the stress-strain relationship of confined
concrere in compression (Mander et al., 1988).
Horng Hean, T., Al-Sanjery, K. and Choong Luin Chiang, J.
Slenderness Criterion for Isolated Confined Compression Member based on EC2.
DOI: 10.5220/0009007701510157
In Proceedings of the 7th Engineering International Conference on Education, Concept and Application on Green Technology (EIC 2018), pages 151-157
ISBN: 978-989-758-411-4
Copyright
c
2020 by SCITEPRESS – Science and Technology Publications, Lda. All rights reserved
151
Table 1: Samples and corresponding variables used for EC2 Clause 5.8.3.1.
No. of
Rebars
Area of Long.
Rebar (mm
2
)
B N
ED
(kN)
as per EC2
(f
ck
(unconfined)
Actual λ
used
as per EC2
(f
ck
(confined)
0 0 0 1 180.731 10.626 13.86 10.626
3 84.82 0.0665 1.0644 180.963 11.304 13.86 11.059
4 113.10 0.0887 1.0851 180.967 11.523 13.86 11.2
5 141.37 0.1109 1.1053 180.972 11.738 13.86 11.34
Yong, Nour and Nawy carried out experiments on
24 square columns with the dimensions of 150mm ×
150mm × 457mm and compressive strengths of
between 83.6 to 93.5N/mm2 and rectilinearly
confined with lateral ties spacing varied from 25mm
to 75mm. In general, the concrete columns were
ductile with the introduction of the links. The peak
stress and strain for both high and normal strength
concrete and especially the ductility increased when
more lateral steel were provided but however this was
not in proportionally. However, it was found that
lateral steel confinement was not as effective in low
and normal strength concrete. The authors
formulated an empirical model for stress-strain
relationship. (Yong et al., 1988).
Mangat & Azari investigated columns of
150mm×150mm×750mm with link pitches of
125mm, 187mm and 375mm with steel fibres
between 0 and 3%. The theoretical ultimate strength
of the column was calculated based on the expression
P
U
= 0.85×σ
cy
×A
c
+ σ
y
×A
S
which is proportional to
the concrete characteristic strength, area of concrete,
steel characteristic strength and area of steel, without
taking into consideration of the partial safety factor
for materials. Their research results indicated that
their theoretical and experimental ultimate load only
varied between 0 to 9%. They concluded that the
strength of the compression members is unaffected by
the link spacing or steel fibre volume (Mangat and
Motamedi Azari, 1985)
Experiments on high strength concrete columns
confined with single spirals and also two opposing
spirals were conducted to study the axial behaviour of
such elements. Monotonic axial loads were applied
to the specimens. Twenty one 350mm diameter ×
1000mm tall high strength concrete circular columns
with different number of longitudinal rebars and four
different confinement ratios were tested. It was found
that the specimen with 12 longitudinal diameter
16mm rebars possessed an ultimate load of 5257kN
while the specimen with 8 longitudinal diameter
16mm rebars possessed an ultimate load of 5305kN.
The researchers concluded that the variation in the
longitudinal rebars had not establish a trend on the
effects in the confined compressive strength and
strain capacity (West et al., 2016; Marvel et al.,
2014). The purpose of having two opposing spirals
was to facilitate easy concreting whereby if
conventional single steel confinements were adopted,
two opposing spirals would create the same results
even if its pitch is twice that of the conventional one
since the confinement volume to concrete core
volume would be the same (Hindi, 2013).
BS 8110 (BSI, 1997) does not include confined
concrete whereas the current code of practice, EC2
included equations for increased characteristic
strength and strains (British Standards Institution,
2008). The strength of slender reinforced concrete
columns under uniaxial load had been evaluated
numerically using the simple transformed section
concept (Chuang and Kong, 1998). In this present
research, the capacity of columns exceeding the
slenderness limit as per EC2 had been evaluated using
the EC2’s expression for confined concrete strength.
3 RESEARCH METHODOLOGY
The λ
lim
as per EC2 Clause 5.8.3.1 is
20/
√
and for this experiment, A and C had
been taken as 0.7.
Table 1 shows the values of the variables adopted.
Samples with confinements were used and all
exceeded the
as shown in Table 1 in order to
study the effects of exceeding
.
A total of 12 prism samples were prepared and
tested under axial compression. The concrete mix
was designed to have a mean 28-day compressive
strength of 25N/mm
2
. The cement, sand, aggregate
proportion was 1:1:2 and the water cement ratio was
0.5. The influence of specimen slenderness was
investigated by preparing specimens with slenderness
ratios as per EC2 of 3.46, 9.24, 11.55 and 13.86 where
the last slenderness ratio exceeded the limit i.e. λ
lim
.
If the older code of practice, i.e. BS 8110 were
adopted, the corresponding height to least column
dimension would be 1, 2.67, 3.33 and 4 respectively
and since these are less than 10, it would had been
classified as short based on Clause 3.8.1.3 of BS
8110. The details of the test specimens are as shown
EIC 2018 - The 7th Engineering International Conference (EIC), Engineering International Conference on Education, Concept and
Application on Green Technology
152
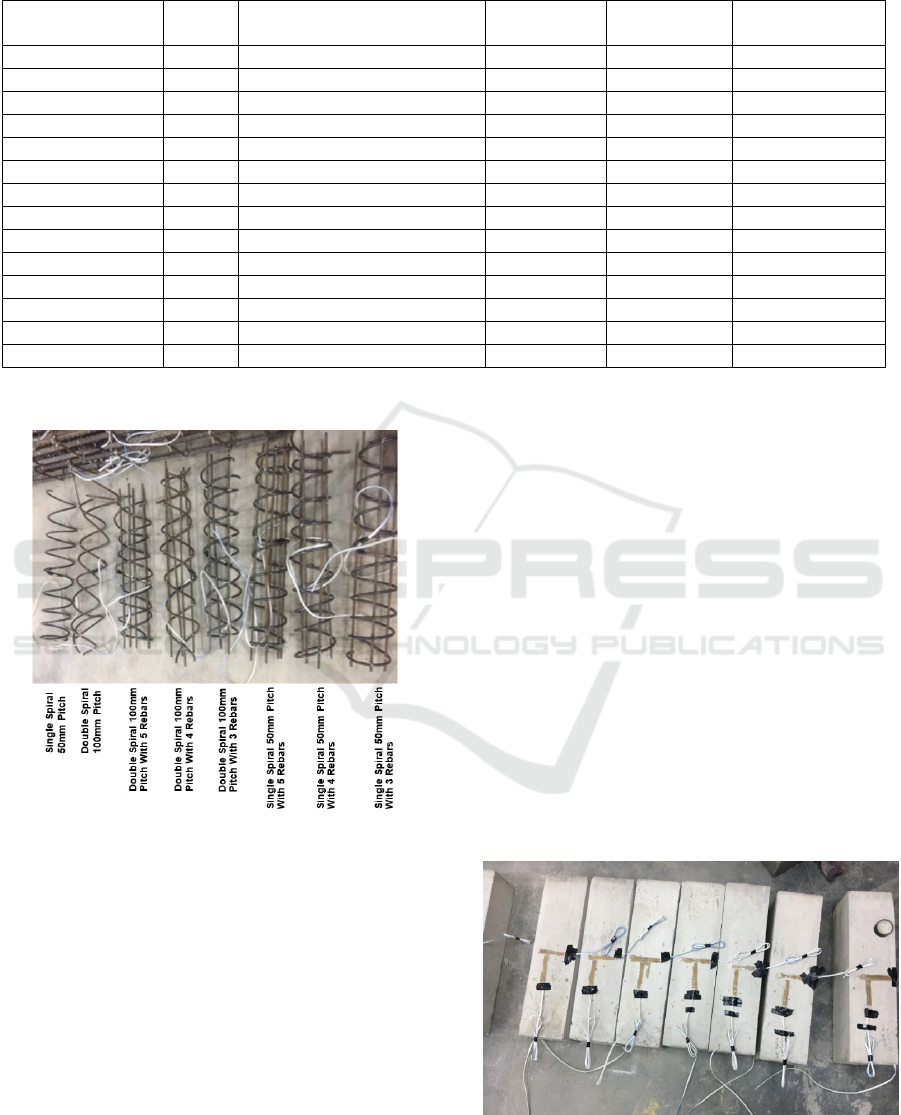
Table 2: Specimen Properties.
Specimen (mm) Spiral Longitudinal Diameter 6 Rebar Slenderness
Ratio
Confinement
Pitch (mm)
L / Smallest
Dimension
C1 (150×150×150) None 0 3.46 1
C2 (150×150×400) None 0 9.24 2.67
C3 (150×150×500) None 0 11.55 3.33
C4 (125×125×500) None 0 13.86 4
C0R-SS Single 0 13.86 50 4
C3R-SS Single 3 13.86 50 4
C4R-SS Single 4 13.86 50 4
C5R-SS Single 5 13.86 50 4
C0R-DS Double 0 13.86 100 4
C3R-DS Double 3 13.86 100 4
C4R-DS Double 4 13.86 100 4
C5R-DS Double 5 13.86 100 4
Figure 1: Single and Double Spiral Confinements Used.
in Table 2 where C1 to C4 are pure concrete control
specimens but with different dimensions in order to
have different slenderness ratios. The dimensions of
C1 is 150mm × 150mm × 150mm, C2 is 150mm ×
150mm × 400mm, C3 is 150mm × 150mm × 500mm
and C4 is 125mm × 125mm × 500mm. The
slenderness ratios of these are 3.46, 9.24, 11.55 and
13.86 respectively. The specimens with the suffix SS
represents samples with single spiral confinements
while the specimens with the suffix DS represents
samples with double spiral confinements. The
samples denoted with C and followed by a number
and R indicates that there is additional longitudinal
reinforcement bars as per the number. Diameter 6mm
reinforcement bars with nominal yield stress of
250N/mm
2
were used to form both the single and
double spiral confinements. The pitch of the single
spiral confinements was 50mm whereas for the
double spiral confinements, the pitch was 100mm. All
the spirals had an outer diameter of 75mm and all
samples had a concrete cover of 25mm. These
confinements and main rebar configurations are as
shown in Figure 1.
All samples except for C1 to C3 were installed
with electronic foil strain gauges in the longitudinal
and lateral directions as shown in Figure 2. All the
samples were tested with an Automatic Compression
Testing Machine with a maximum loading capacity
of 600kN and loading was applied with a rate of
0.1kN/s. The readings of the applied load and also
the strains were recorded with a data logger. The
setup of the experiment is as shown in the Figure 3.
Figure 2: Installation of Strain Gauges on Concrete
Specimens.
Slenderness Criterion for Isolated Confined Compression Member based on EC2
153
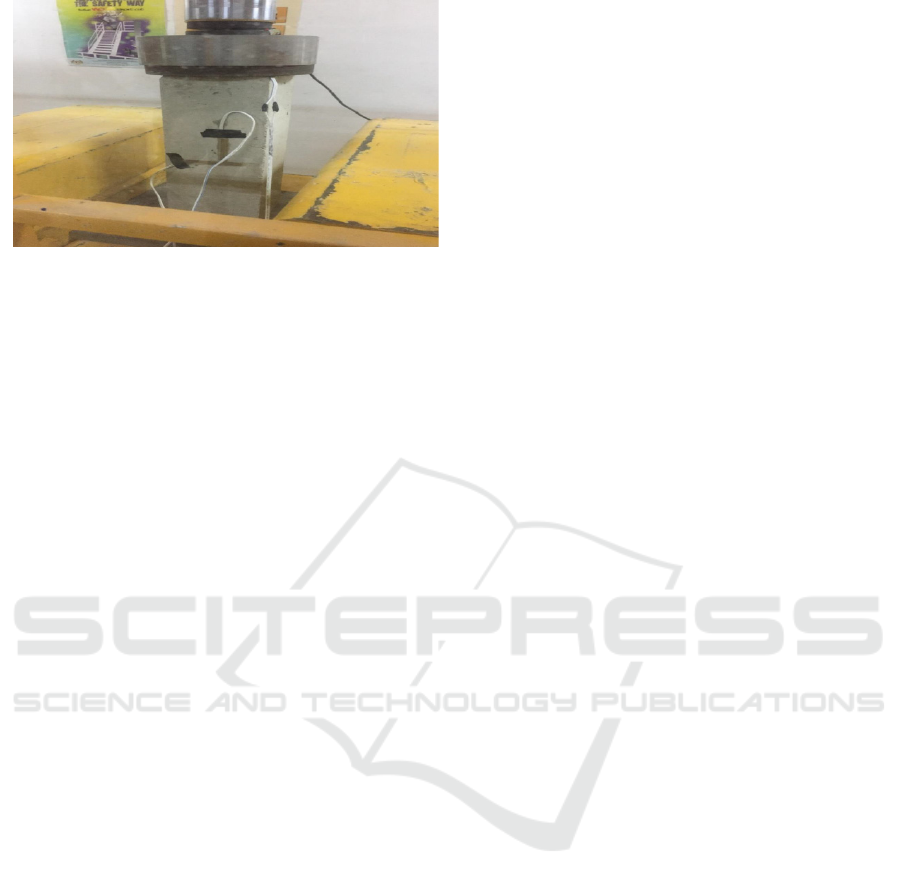
Figure 3: Experimental Setup.
4 ANALYSIS AND DISCUSSION
For Table 3, column (1) indicates the Specimen, (2)
the characteristic cylindrical strength, (3) the
characteristic confined concrete strength based on
EC2, (4) the experimental failure load, (5) the
theoretical failure load based on unconfined concrete
strength, (6) the theoretical failure load based on
confined concrete strength with the assumption that
the column is short and (7) the slenderness ratio.
4.1 Ultimate Load
The ultimate load of a compressive member is highly
dependent on the slenderness ratio that is the ultimate
load is inversely proportional to the slenderness ratio.
C1 for instance which was used as cube test, had a
slenderness ratio of 3.46 and could achieve an
ultimate load of 573.75kN while C2 with a
slenderness ratio of 9.24 achieved an ultimate load of
280.13kN. C3 had a slenderness ratio of 11.55 while
C4 had a slenderness ratio of 13.86. Both C3 and C4
achieved very similar ultimate loads that is 263.20kN
and 273.60kN respectively.
The control specimens C2 to C4 which were plain
concrete with slenderness ratios of between 9.24 and
13.86. Samples with slenderness ratio approximately
above 9 and below 14 had its ultimate load reduced to
approximately 50% compared to samples with
slenderness ratio of approximately 3.46.
For the group of samples with single confinement
having a pitch of 50mm, it was found that all
specimens exceeded the control specimen’s ultimate
load (C4) except for specimen C4RSS which was
0.74% lower than the control specimen which should
not be. C0RSS i.e. the specimen with no rebars,
managed to achieve an ultimate load of 392.2kN.
C3RSS, C4RSS and C5RSS reached the ultimate load
of 320.7kN, 271.6kN and 388.6kN respectively.
For the group of samples with double confinement
with a pitch of 100mm, it was found that all
specimens exceeded the control specimen’s ultimate
load. C0RDS, C3RDS, C4RDS and C5RDS achieved
an ultimate load of 323.2kN, 345.9kN, 443kN and
342.9kN respectively.
Column 5 of Table 3 adopted the characteristic
cylindrical strength of concrete i.e. without taking
into account of the confinement effects. Therefore, if
a comparison of the experimental ultimate load with
column 5 were to be made, it would be seen that the
values of theoretical load in column 5 will
underestimate the actual failure load. On the other
hand, if Clause 3.1.9 of EC2 (Confined Concrete)
were to be adopted, the ratio of the experimental
ultimate load (column 4) to the theoretical ultimate
load (column 6) varies from 5% below the theoretical
value to 30% above the theoretical value (see column
10). However, it should be noted that the formulas
adopted in Table 3 are based on short columns but in
actual fact the columns exceeded the slenderness ratio
limit as per EC2 yet was able to perform similar to a
short column.
The theoretical ultimate strength from the
provision of longitudinal rebars would increase as
more longitudinal rebars are introduced. It would had
been expected that with the increase in the number of
rebars for samples C0RSS, C3RSS, C4RSS and
C5RSS, a corresponding higher experimental
ultimate load would be obtained. However, for
C5RSS, it possessed a lower ultimate load compared
to the sample with no reinforcement bars i.e. C0RSS.
Similarly, it would had been expected that C5RDS
possesses a higher ultimate load compared to the
sample C3RDS and C4RDS. However, both C3RDS
and C4RDS exceed C5RDS’s ultimate load.
This is similar to the experiment carried by
Johnathan West, Ahmed Ibrahim and Riyadh Hindi,
Analytical compressive stress-strain model for high
strength concrete confined with cross spiral whereby
for their single spiral specimen with 12 longitudinal
diameter 16mm rebars had a lower ultimate load
compared to the sample with 8 longitudinal rebars.
4.2 Axial and Lateral Strain vs. Stress
The following show the axial and lateral strain vs.
stress curve of all the of the control sample C4,
C0RSS, C3RSS, C5RSS, C0RDS, C3RDS and
C5RDS. All strain units are multiplied by ×10
-6
. The
strain gauge reading of C4 indicated that the
longitudinal strain as positive i.e. tension and the
lateral strain as negative i.e. compression. It is likely
that the applied load had not been perfectly
concentric.
EIC 2018 - The 7th Engineering International Conference (EIC), Engineering International Conference on Education, Concept and
Application on Green Technology
154
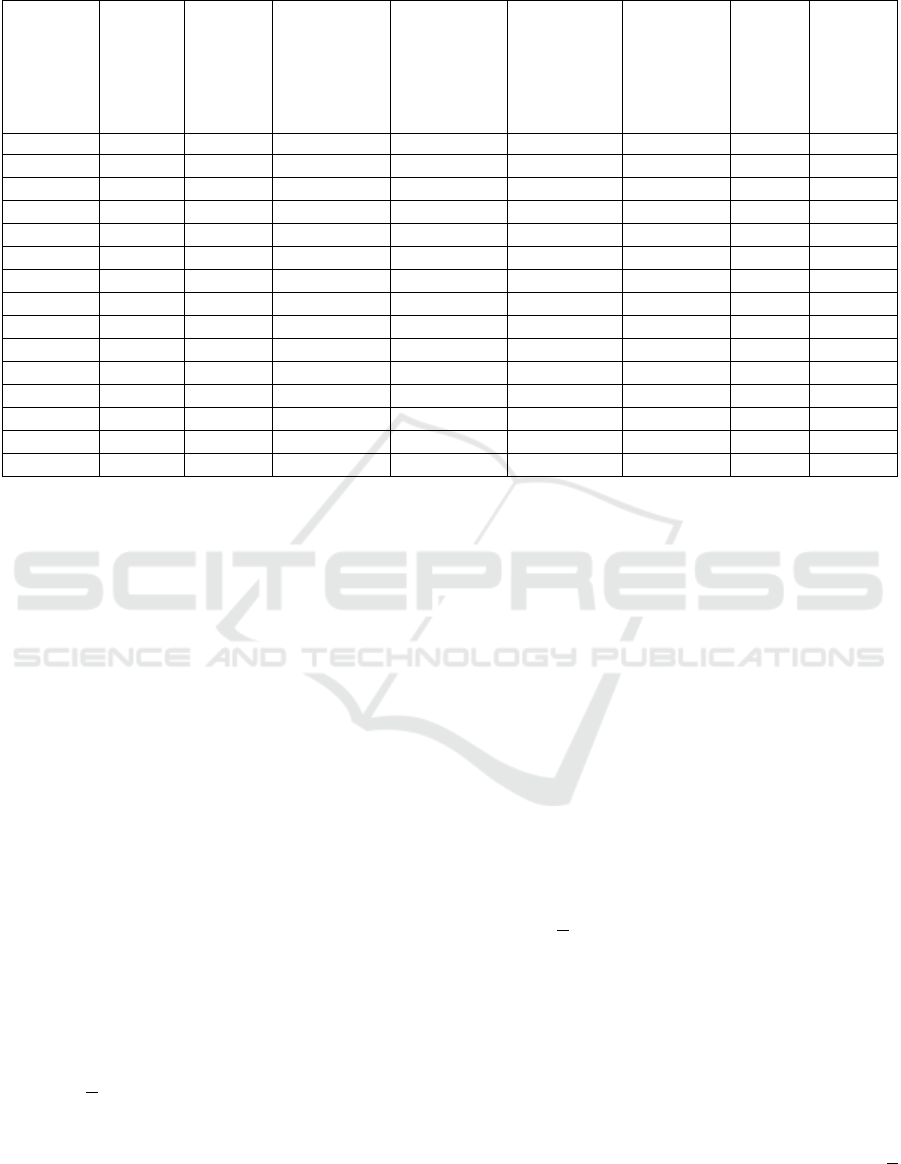
Table 3: Test results of column specimens.
Specimen
f
ck
(N/mm
2
)
f
ck, conf
(N/mm
2
)
Experimental
Theoretical
P
U
=
0.85f
ck
A
c
+
f
y
A
s
Theoretical
P
U
= 0.85
f
ck,conf
A
conf
+
0.85f
ck
(A
gross
- A
conf
)
+
f
y
A
s
Slenderness
Ratio
(4) / (6) Poisson's
Ratio (at
60%
Ultimate
Load)
(1) (2) (3) (4) (5) (6) (7) (8) (9)
C1 20.4 573.75 - - 3.46
C2 20.4 280.13 390.15 - 9.24
C3 20.4 263.20 390.15 - 11.55
C4 20.4 273.60 270.94 270.94 13.86 0.14
C0RSS 20.4 32.37 392.2 270.94 315.89 13.86 1.24 0.24
C3RSS 20.4 32.37 320.7 292.14 337.09 13.86 0.95 0.16
C4RSS 20.4 32.37 271.6 299.21 344.16 13.86 0.78 -
C5RSS 20.4 32.37 388.6 306.28 351.23 13.86 1.11 0.16
C0RDS 20.4 32.37 323.2 270.94 315.89 13.86 1.02 0.13
C3RDS 20.4 32.37 345.9 292.14 337.09 13.86 1.03 0.07
C4RDS 20.4 32.37 443 299.21 344.16 13.86 1.30 0.83
C5RDS 20.4 32.37 342.9 306.28 351.23 13.86 0.98 0.25
From the graph of C4RSS it was noticed that
when the specimen experienced a stress of
approximately 11N/mm2, the reading then reduced to
about 8.5N/mn2. Also, the specimen C4RDS had
both longitudinal and lateral strains as tension. These
graphs were not included.
For rest of the curve, it can be seen that a V-shape
curve is formed. In general, it can be seen that the
horizontal distance from the peak of the axial strain
curve to the vertical axis is larger than the horizontal
distance from the peak of the lateral strain curve to
the vertical axis. Column 8 of Table 3 show the
Poisson’s Ratio of the control and the samples.
4.3 Slenderness Limit λ
lim
and Actual
Slenderness λ
Even though the samples with confinements had exceeded
the slenderness limit as per EC2, their theoretical loads
had been calculated as shown in Column (5) of Table 3
and ignoring the partial factors of safety (1.5). The
compressive design strength, N
ud
= 0.85×f
ck
×A
c
+A
s
×f
yk
.
If no longitudinal reinforcements were adopted, the
equation now becomes N
ud
= 0.85×f
ck
×A
c
= 270.94 kN for
specimen C4. If the similar ultimate load is obtained
based on BS 8110, it would be N
ud
= 0.67×f
cu
×A
c
=
266.96 kN. Columns C2, C3 and C4 achieved failure
loads of 280.13, 263.20 and 273.60kN respectively which
was ±3.3% of the control’s ultimate load. C3 and C4
possess the slenderness ratios of 11.55 and 13.86
respectively which exceeded their slenderness limits of
10.626. Sample C2 possess a slenderness ratio of 9.24
which is below the slenderness limit. However, the
experimental ultimate loads of C2, C3 and C4 were very
close suggesting that even though the slenderness limit is
10.626, it could actually be increased to 13.86.
Furthermore, it could be seen in
Table 3 that if confined concrete strength together
with the assumption of a short column, the
experimental values were close to the theoretical
values suggesting that the actual slenderness ratio of
13.86 would be safe to be considered as short column.
The average
for the 3 rebars, 4 rebars and 5
rebars is 11.52. Based on the equation
20/
√
, the product of the variables ABC gives
0.532 (B was taken as an average). Since the samples
exceeded the control C4’s ultimate load, the factor 20
in the equation can be increased to 24 or
24/
√
when closely spaced confinements of
50mm were adopted.
When concrete confinements in the form of single
spiral with a pitch of 50mm were introduced to a 125
× 125 × 500 concrete sample C0RSS with no
longitudinal rebars, the failure load achieved
392.2kN. This is more than the expected failure load
of a short column i.e. 270.94kN. In other words, with
the introduction of concrete confinements, it is can be
acceptable to relax the λ
lim
as per clause 5.8.3.1 of
EC2. Similarly, the same limit
24/
√
Slenderness Criterion for Isolated Confined Compression Member based on EC2
155
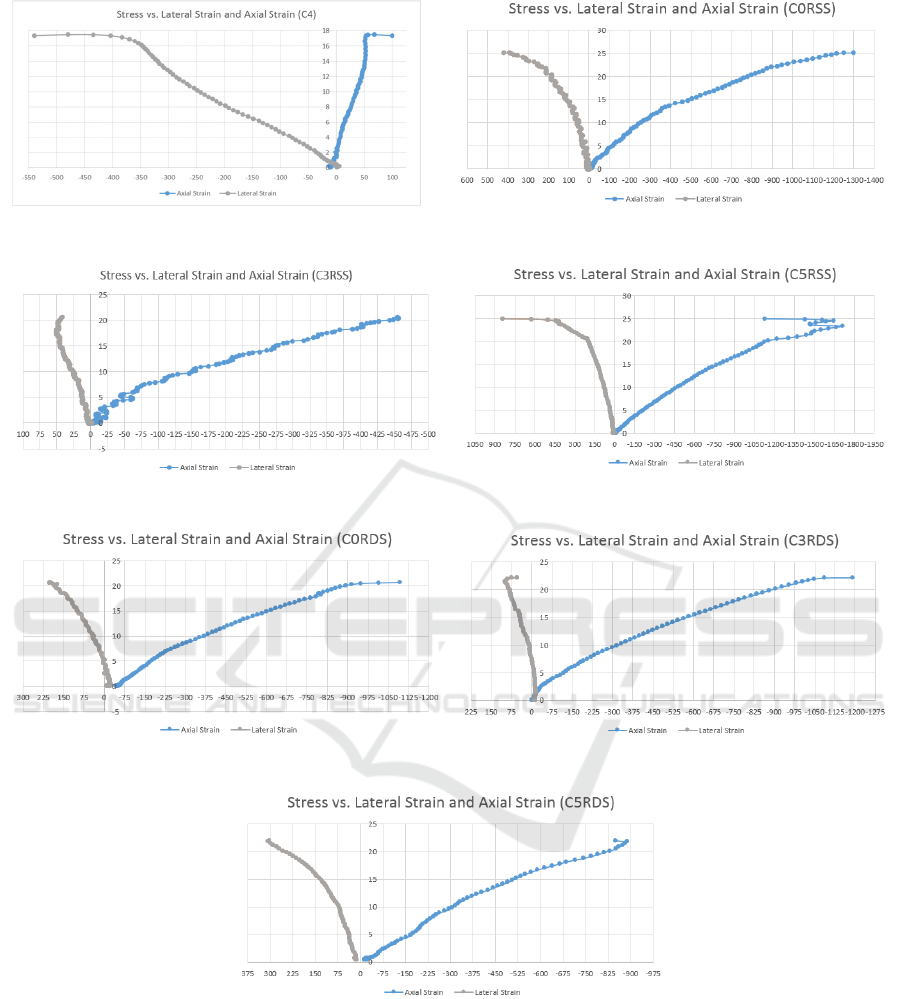
Figure 4: Stress vs. Lateral and Axial Strain for C4. Figure 5: Stress vs. Lateral and Axial Strain for C0RSS.
Figure 6: Stress vs. Lateral and Axial Strain for C3RSS. Figure 7: Stress vs. Lateral and Axial Strain for C5RSS.
Figure 8: Stress vs. Lateral and Axial Strain for C0RDS. Figure 9: Stress vs. Lateral and Axial Strain for C3RDS.
Figure 10: Stress vs. Lateral and Axial Strain for C5RDS.
can be applied for the samples with double
confinements with a pitch of 100mm or with the
equivalent confinement volume.
Clause 3.8.1.3 of BS 8110 adopted a ratio of
height to smallest unbraced column dimension and if
this ratio is below 10, then the column would be
assumed short. The same criteria applies with the
older Code of Practice i.e. CP114. The sample C4
have a height / least dimension ratio of 4 and hence is
classified as short based on the older codes of practice
i.e. BS 8110 and CP114. The failure load of C4 based
on short column assumption is also still valid since
the experimental and theoretical values are the
±2.66kN. However for samples C2 and C3, the
EIC 2018 - The 7th Engineering International Conference (EIC), Engineering International Conference on Education, Concept and
Application on Green Technology
156

theoretical exceeded the experimental values by
110.02kN and 126.95kN respectively which is not
favourable.
4.4 Confined Compressive Strength
with Slenderness Ratio of 13.86
All the samples with confinements exceeded the
limit,
as recommended by Clause 5.8.3.1 of EC2
and comparing the control sample C4 with the rest of
the samples, all samples except for C4RSS exceeded
the control column C4 by between 17% to 43% for
the single spiral confinement and 18% to 62% for the
double confinement. On average, the experimental
values exceed the control by 25% for the single spiral
confinement and 33% for the double confinement.
5 CONCLUSION
The introduction of confinements especially closely
spaced confinements such as confinements at 25mm
centres will enhance the ultimate strength of the
concrete column even though columns with their
slenderness ratios exceeding the limit as
recommended by EC2. It is proposed that the
slenderness limit
20/
√
be increased to
24/
√
.
NOMENCLATURE
1/10.2
√
12
1.7
= the effective creep ratio and if this is not known
then A is assumed as 0.7.
= the ratio of products A
s
f
yd
to A
c
f
cd
.
n = the ratio of N
Ed
to A
c
f
cd .
N
ED
= design axial load which was taken based on the
amount of longitudinal reinforcement bars and also
concrete cross section
ACKNOWLEDGEMENTS
The authors would like to express appreciation to
final year project students Alex Bwalya, Ibrahim
Alibrahim and Hael Matouk for their hard work and
discipline during the project.
REFERENCES
ACI Committee 318, 2014. ACI 318-14 Building Code
Requirements for Structural Concrete and
Commentary, American Concrete Institute.
Bhatt, P., Mac Ginley, T.J. & Choo, B. S., 2014. Reinforced
concrete design to Eurocodes.
British Standards Institution, 2008. Eurocode 2: design of
concrete structures: British standard. , (June).
BSI, 1997. Structural use of concrete — Part 1: Code of
practice for design and construction.
Carreira, D.J. & Chu, K.-H., 1985. “Stress-Strain
Relationship for Plain Concrete in Compression”, ACI
Journal, Vol. 82, No. 6, pp.797–804.
Chuang, P.-H. & Kong, S.-K., 1998. “Strength of Slender
Reinforced Concrete Columns”, Journal of Structural
Engineering, Vol. 124, No. 9, pp.992–998.
Considere, A., 1908. Experimental Researches on
Reinforced Concrete Second, McGraw Publishing
Company, New York.
Cusack, P., 1981. Reinforced Concrete in Britain: 1897 -
1908. University of Edinburgh.
Hindi, R., 2013. Behavior of Concrete Columns Confined
With Cross Spirals Under Different Loads. ASCE,
pp.1662–1672.
Mander, J., Priestley, M. & Park, R., 1988. “Theorectical
stress-strain model for confined concrete”, Journal of
Structural Engineering, Vol. 114, No. 8, pp.1804–26.
Mangat, P.S. & Motamedi Azari, M., 1985. “Influence of
steel fibre and stirrup reinforcement on the properties of
concrete in compression members”, International
Journal of Cement Composites and Lightweight
Concrete, Vol. 7, No. 3, pp.183–192.
Marvel, L., Doty, N., Lindquist, W. & Hindi, R., 2014.
“Axial behavior of high-strength concrete confined
with multiple spirals”, Engineering Structures, Vol. 60,
pp. 68–80.
Mosley, B., Bungey, J. & Hulse, R., 2007. Reinforced
Concrete Design to Eurocode 2.
West, J., Ibrahim, A. & Hindi, R., 2016. “Analytical
compressive stress-strain model for high-strength
concrete confined with cross-spirals”, Engineering
Structures, Vol. 113, pp. 362–370.
Yong, Y.-K., Nour, M.G. & Nawy, E.G., 1988. “Behavior
of Laterally Confined High-Strength Concrete under
Axial Loads”, Journal of Structural Engineering, Vol.
114, No. 2, pp.332–351.
Slenderness Criterion for Isolated Confined Compression Member based on EC2
157
