
Geotechnical Assessment for Truss Bridge using Fuzzy-based Soft
Computing: Case Study - Kedaung Bridge, Tangerang, Banten
Indonesia
Pringga Satria Panji and Tommy Ilyas
Deparment of Civil Engineering, Faculty of Engineering, Universitas Indonesia, Depok, Indonesia
Keywords: Assessment, Kedaung bridge, Fuzzy, Hazard, Slope stability, soil investigation
Abstract: Kedaung Bridge is a truss bridge that connect two sub-districts in Tangerang. This bridge pass over Cisadane
River. Although the bridge is newly opened, any hazard may be occurred during operating periods.
Substructure of bridge itself is prone to hazards such as ground displacement, slope instability and seismic-
related hazard. Typical traffic data and soil investigation data will be used to analyze ground displacement
and slope instability where the bridge located. Local geological and seismic data will be used to assess
seismic-related hazard. A risk assessment for substructure shall be conducted. Fuzzy Analytical Hierarchy
Process (FAHP) will be used to analyses various geotechnical aspects. Hazard identification, risk rating, risk
analysis, and risk assessment are steps conducted in FAHP method. The ranking model can be used for quick
sensitivity assessment of the effect of various site condition. Classification and rating of risk can be done with
proposed method. Classification of risk will be based on soil type and geological condition. This assessment
can be a tool or recommendation for local government where the bridge located. Priority list will be created
using this method and enable decision makers to decide on either carrying out further detailed evaluation or
consider any other actions for the bridge.
1 INTRODUCTION
In a road network system, bridges play an important
role as a complementary road infrastructure. Bridges
can be the backbone of infrastructure that links one
region to another (Andric & Lu, 2015). Bridges can
connect road that is separated by rivers, lakes,
ravines, valleys, straits, highways and railways. In its
development, the bridge undergoes the evolution
from wooden and simple stone bridges to bridges
with more complex structural systems and advanced
materials. The advanced materials used in more
complex bridge structure (such as concrete, steel and
cables) that continue to develop will encourage the
construction of bridges with more complex
technology than ever before.
In Indonesia, Directorate General of Highways of
Ministry of Public Works and Housing (Dirjen Bina
Marga Kementerian PU-PERA) is responsible for
bridge management through archipelago. The
Directorate General of Highways uses the Bridge
Management System (BMS) for more systematic
monitoring and planning of the bridge. The BMS
developed and owned by the Directorate General of
Highways serves as a tool for the process of storing
bridge-related data; such as design work,
construction, rehabilitation and monitoring of bridge
condition. For the purposes of the bridge survey,
Indonesia’s Directorate General of Highways has a
Working Unit of Planning and Supervision of
National Roads and located in each province.
According to data collected from the Ministry of
Public Works and Housing Statistics Information
Book (Buku Informasi Statistik Kementerian
PUPERA) year 2015, the total number of bridges in
Indonesia recorded by the Ministry per year 2014 are
14710 bridges with various conditions. The details of
the bridge conditions recorded are 6609 bridges
(45%) in good condition, 3137 bridges (21.3%) with
medium condition, 3253 bridges (22.1%) at lighty-
damaged condition, 1360 bridges (9.2%) in heavily-
damaged condition, 314 bridges (2.1%) with critical
condition and 37 bridges (0.3%) already collapse /
break-up.
From the data above, the condition of the bridge
in Indonesia is composed of various conditions,
130
Satria Panji, P. and Ilyas, T.
Geotechnical Assessment for Truss Bridge using Fuzzy-based Soft Computing: Case Study - Kedaung Bridge, Tangerang, Banten Indonesia.
DOI: 10.5220/0009007401300139
In Proceedings of the 7th Engineering International Conference on Education, Concept and Application on Green Technology (EIC 2018), pages 130-139
ISBN: 978-989-758-411-4
Copyright
c
2020 by SCITEPRESS – Science and Technology Publications, Lda. All rights reserved

ranging from good conditions until the condition of
collapsed or broke. The bridges listed above are
bridges that have been designed and built by the
Directorate General of Highways. Those bridges have
various shaping materials with varying length and
spans.
Kedaung Bridge is considered as newly built
bridge by local government of Tangerang that
connect two sub-district in Tangerang. It crosses
Cisadane River. The bridge consists of two main lane
and can handle until mid-size truck. Local
government is the entity that hold responsibility for
Kedaung Bridge (under supervision of Indonesia
Directorate General of Highways of Ministry of
Public Works and Housing).
Assessment process of Kedaung Bridgge is to
determine the current state of the bridge can be done
by collecting various related data and then those data
can be analyzed and generate a value that will be able
to assist in the decision-making process. Related
research on the structure of the bridge (such as deck,
frame and bridge pier or pier) has relatively much
research on it. Research on the assessment of the sub-
structure of bridge is not as much as upper-structure
of bridges. Damage to upper and lower structures of
jembaatan will result in disruption of the service life
of the bridge.
2 EVALUATION AND ANALYSIS
To evaluate sub-structure condition of a bridges,
several methods can be conducted. Then, after
evaluation process, assessment process shall be done.
In this paper, assessment process is done by Fuzzy
Analytical Hierarchy Process (Fuzzy AHP). Fuzy
AHP is based on fuzzy set that is developed by Lotfi
Zadeh in 1965. The result of Fuzzy AHP is rating of
each criterion. Rating that is respected to value of
each criteria is the result of assessment process. Based
on the rating, decision making can be done with those
rating.
In this paper, evaluation criteria will be described
based on text book. Slope stability, seismic hazard
analysis, liquefaction study and Fuzzy AHP will be
described in the following subsection.
2.1 Soil Parameter Interpretation
According to Duncan and Wright (2005), the process
of slope stability evaluation needs to be done to
determine the safety factor of a slope. Clear and
comprehensive evaluation results should also be done
for the following reasons:
Evaluation results should be checked by a few
engineers and experts from relevant
institutions. Multiple examinations are
intended to minimize errors that may occur
during the evaluation process and to gain a
different perspective on a problem.
Evaluation results must be clear and
understandable by the client
Responsibility for engineering evaluation
results is usually given to engineers at an
institution or company. The engineer must
understand the results of the evaluation and
understand the basis of the decisions taken in
the analysis and evaluation.
Evaluation results should be well documented.
Good documentation will make it easier if the
data at any time required in the future.
It is inevitable that each slope location evaluated
has different characteristics from one another. In
Java, soil conditions in each province will be
different. Geological detail plays an important role in
slope stability, and for that, geological information of
a region is very important (Duncan & Wright, 2005).
Then, the next step in the evaluation of the stability of
the slope is the evolution of the soil property.
Evaluation of soil properties will be closely related to
geotechnical investigations. Geotechnical
investigation work will include field and laboratory
work. The properties obtained are quite diverse,
among others are: property of soil shear strength, soil
stiffness, soil physical characteristics and others. In
slope stability, shear strength parameters and soil
density are prioritized.
Soil investigation work has been conducted at
project site of Kedaung Bridge. Soil investigation
works consist of field work (boring) and laboratory
work. Boring work has been conducted in 2 points of
reference. One point is located in one side of
approach section and the other is located in another
side of approach section. Boring work is done until
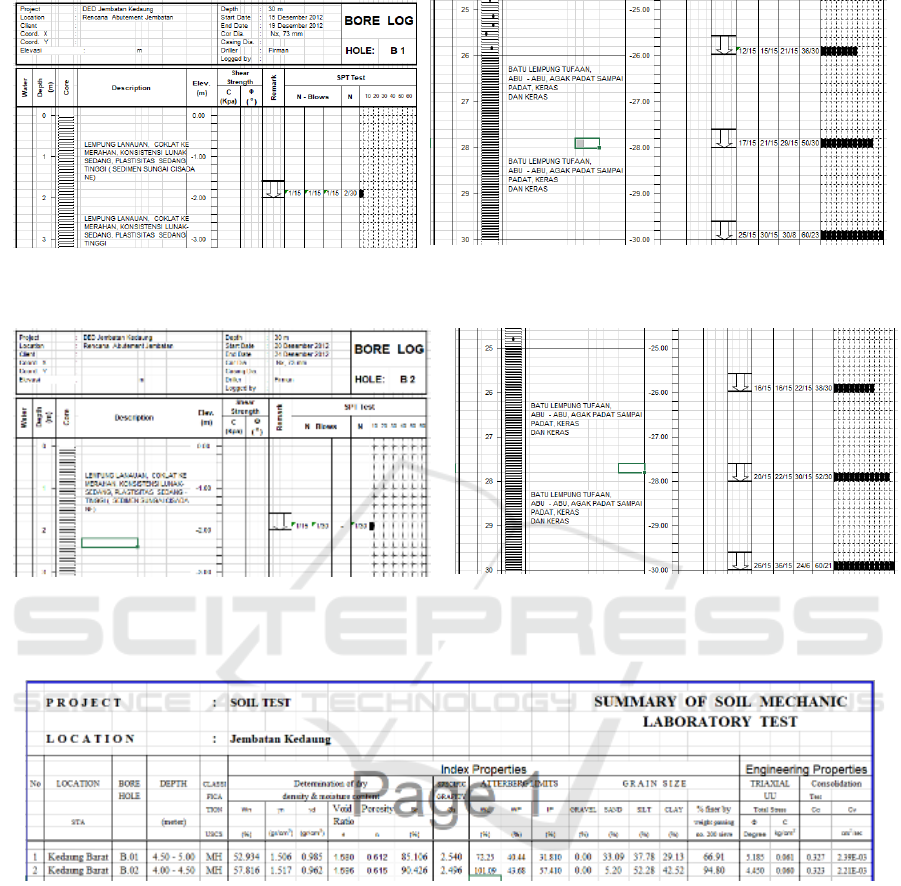
30 meters depth. Boring log report and soil mechanic
summary report are shown in Figures 1 – 3.
Upper section of soil is dominated by clay until 25
to 26 meter depth and after that section, tuff /
cemented clay mixed with rock is dominated.
Borehole 1 and bor-hole 2 is done at minimum
required depth (30 meter).
At least one undisturbed sample (UDS) in each
borehole are taken for laboratory work. Several
testing have been conducted in laboratory work.
Atterberg limit test, consolidation test, soil density
test, grainsize distribution test, water content test and
triaxial test are testing item treated for each UDS.
Geotechnical Assessment for Truss Bridge using Fuzzy-based Soft Computing: Case Study - Kedaung Bridge, Tangerang, Banten Indonesia
131
(a)
(b)
Figure 1: (a) Upper section of boring log B1 report, (b) Lower section of boring log B1 report.
(a)
(b)
Figure 2: (a) Upper section of boring log B2 report, (b) Lower section of boring log B2 report.
Figure 3: Summary of soil mechanic laboratory test for whole bor-hole.
2.2 Slope Stability Evaluation
Basically, calculation or analysis of slope stability
can be done manually or using geotechnical software.
Manual computations are calculated using several
methods such as Bishop, Taylor, Spencer, Fellenius,
Morganstern and other methods. The whole method
of manual calculation is based on the concept of
equilibrium limit. Then, if using the software, the
geotechnical software widely used and will be used in
this research is Plaxis and Geoslope. The concept of
calculation on Plaxis is based on the finite element
method (FEM), while the concept of calculation on
Geoslope is based on the concept of equilibrium limit.
In this case, soil stability is conducted using
Geoslope software. Input data for Geoslope are
consist of geometry of slope analyzed, soil property
data. loading data at the top of slope (bridge self
weight and traffic load) and environmental data (such
as seismic load).
Three main analysis in Geoslope for this case are
long-term, short-term and seismic condition. Long-
term condition is conducted and deal with daily load
such as traffic load in normal condition. Short-term
EIC 2018 - The 7th Engineering International Conference (EIC), Engineering International Conference on Education, Concept and
Application on Green Technology
132
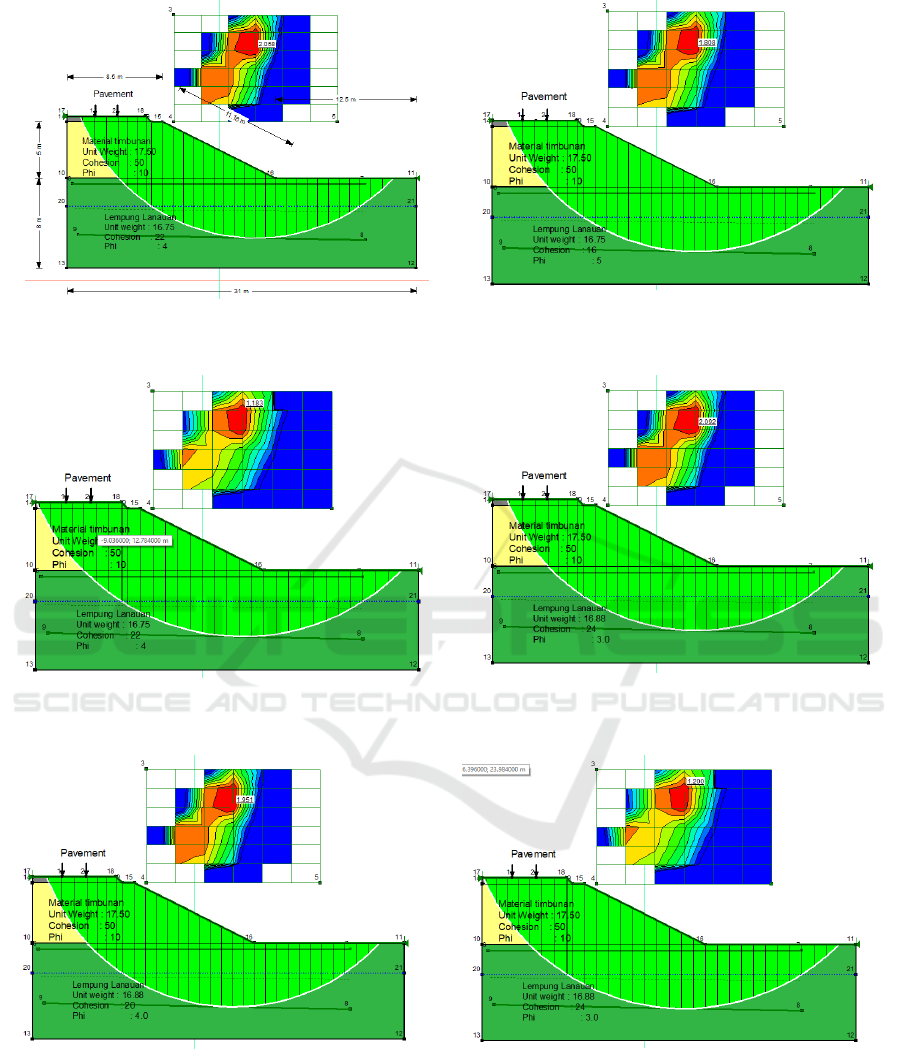
Figure 4: Geoslope output for long-term condition in bor-
hole 1 location, critical SF = 2.058.
Figure 5: Geoslope output for short-term condition in bor-
hole 1 location, critical SF = 1.808.
Figure 6: Geoslope output for seismic condition in bor-hole
1 location, critical SF = 1.183.
Figure 7: Geoslope output for long-term condition in bor-
hole 2 location, critical SF = 2.092.
Figure 8: Geoslope output for short-term condition in bor-
hole 2 location, critical SF = 1.951.
Figure 9: Geoslope output for seismic condition in bor-hole
1 location, critical SF = 1.200
condition is deal with short and considerably quick
load when traffic jam and big vehicle get jammed and
stroked for one time at both lane along the bridge.
While, seismic condition is deal with seismic load. In
the lifetime of bridge, the bridge itself can be faced
with earthquake, thus, the slope under abutment of
bridge has to be analyzed in seismic condition as well.
Geotechnical Assessment for Truss Bridge using Fuzzy-based Soft Computing: Case Study - Kedaung Bridge, Tangerang, Banten Indonesia
133
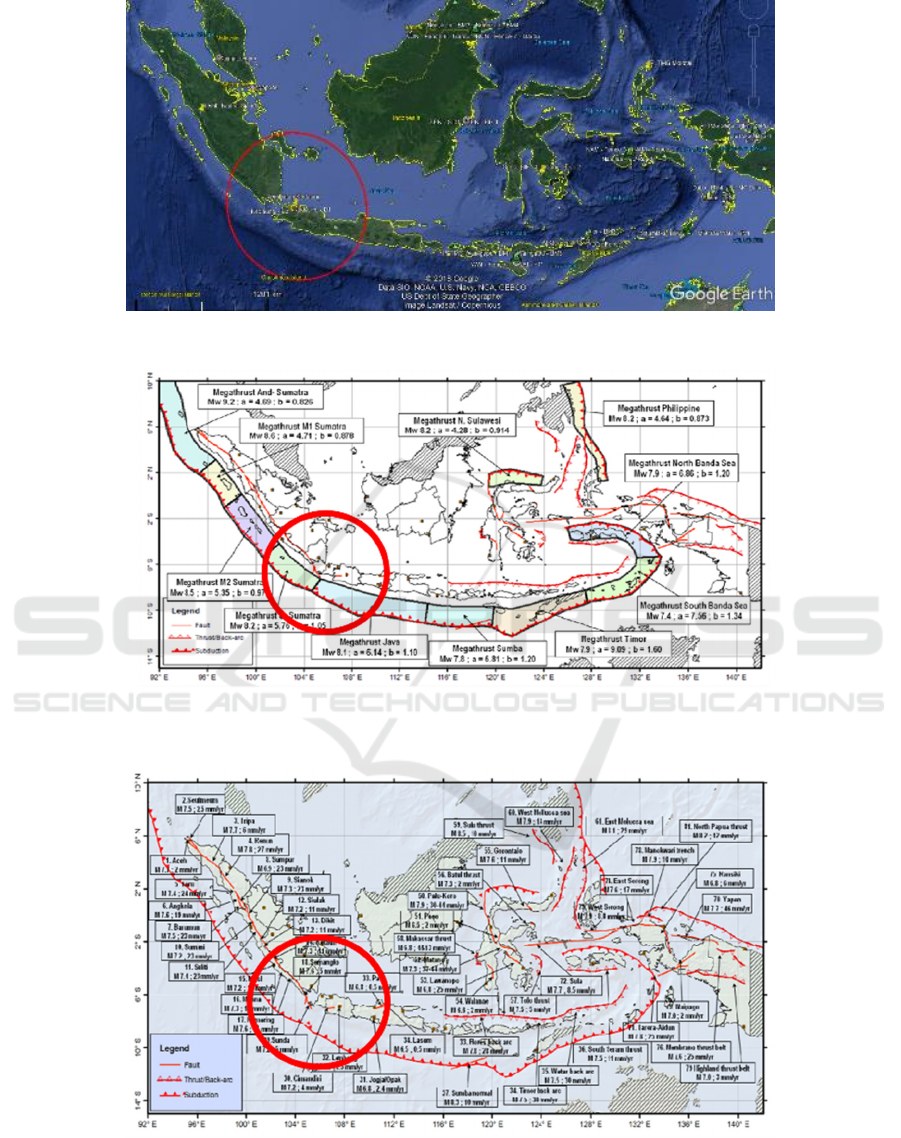
Figure 10: GoogleEarth™ imaginary with red circle in 500 km radius.
Figure 11: Maximum magnitude from subduction or megathrust seismic source (Study Report Summary of Indonesia’s
Seismic Map Revision Team, 2010).
Figure 12: Maximum magnitudo and slip rate from fault seismic source (Study Report Summary of Indonesia’s Seismic
Map Revision Team, 2010).
EIC 2018 - The 7th Engineering International Conference (EIC), Engineering International Conference on Education, Concept and
Application on Green Technology
134

The output for slope stability analysis in Geoslope
is safety factor (SF) value. Safety factor value is
reflected the condition of the slope. Based on SNI
8460-2017 (Geotechnical Design Guidelines),
several value of safety factor has been considered for
every uncertainty. Conservative design of slope is one
main focus in SNI 8460-2017. After all required data
has been input in Geoslope, the software will analyse
the data and safety factor value will be clearly visible
for several condition. The geoslope outputs are shown
in Figures 4 – 9.
2.3 Seismic Hazard Identification
Tangerang is located in Java Island and this area is
surrounded by several active and unstable tectonic
plates. The southern plates is part of ring of fire.
Radius taken for seismic hazard identification is 500
km. Seismic source can be located and identified
inside the circle.
Detailed area information are as follow, it was
located at Tangerang, Banten, Indonesia with the
coordinate of E. 678 541.88 (use UTM coordinates
system), N. 9 322 379.92, Zone: 48 M with radius of
500 km. The detailed location are shown in Figures
10 – 12.
From seismic source map as shown in Figures 10
– 12 (megathrust and fault), there are several seismic
source inside red circle where Kedaung Bridge
located. The summary of potential seismic source
inside red circle can be seen in Tables 1 and 2.
Table 1: Potential megathrust seismic zone.
No Subduction Zone Max Rec’d Mag.
1 Megathrust Jawa M = 8.2
2 Megathrust Sumatra M = 8.1
Table 2: Potential fault zone.
Fault Max Rec’d
Mag.
ID Name
14 Ketaun M = 7.3
15 Musi M = 7.2
16 Manna M = 7.3
17 Kumering M = 7.6
18 Semangko M = 7.2
19 Sunda M = 7.6
31 Opak (Jogja) M = 7.8
32 Lembang M = 7.6
33 Pati M = 7.8
34 Lasem M = 7.5
Maximum magnitude from data as shown in
Tables 1 and 2 is Mw = 8.2 SR. This value is historical
seismic ever recorded in the zone. This magnitude
value can trigger liquefaction event in the area with
high sand content.
2.4 Liquefaction Evaluation
Liquefaction of soil can be happened due to loss of
strength in saturated and cohesion less soil. In this
phenomena, pore water pressure will be increasing
significantly, hence, effective stress of affected soil
will be reduced. Rapid dynamic loading is main
suspect of liquefaction phenomena. Earthquake and
other rapid dynamic loading can trigger the increment
of pore water pressure. In Indonesia, several
liquefaction phenomena has been recorded. Most of
them happened after earthquake event.
Method of liquefaction evaluation used is SPT
(soil penetration test) based evaluation that is
developed by United States’ NCEER (National
Center for Earthquake Engineering Research) in
December 1997. T.L.Youd and I.M. Idriss are editors
of NCEER. This method is using CRR (cyclic
resistance ratio). Minimum magnitude of earthquake
to trigger liquefaction based on this method is 7.5 SR
(scale of Richer). In the other hand, this method has
limitation. This method is applicable for (N1)60 < 30;
for (N1)60 ≥ 30, fine sand content is too dense to
liquefied and this type of soil is classified as non-
liquefiable soil (Ikhsan, 2011).
Researcher has analysed liquefaction in spreadsheet
program and has considered limitation above. For
(N1)60 ≥ 30, Researcher input maximum allowable
value of 30. For instance, if (N1)60 = 45, Researcher
only input maximum allowable value. In spreadsheet,
the value becomes 30. This limitation has shown logic
value of FS (factor of safety). Researcher only plot
result of depth vs. FS for each borehole. The
evaluation results are shown in Figures 13 – 16.
Red box in Figure 14 and Figure 16 indicate soil
layer that has FS < 1. This value indicate potential
liquefaction in those layer. To classify the risk, the
next chapter will explain and classify how above FS
value has potential liquefaction. Any risk considered
in above parameter will be explained below using
Fuzzy based method.
3 NATIONAL INDONESIA
CODE/STANDARD (SNI) AS
INFERENCE SYSTEM
Indonesia has released standard code for geotechnical
design called SNI 8460:2017 Persyaratan
Perancangan Geoteknik (Geotechnical Design
Geotechnical Assessment for Truss Bridge using Fuzzy-based Soft Computing: Case Study - Kedaung Bridge, Tangerang, Banten Indonesia
135
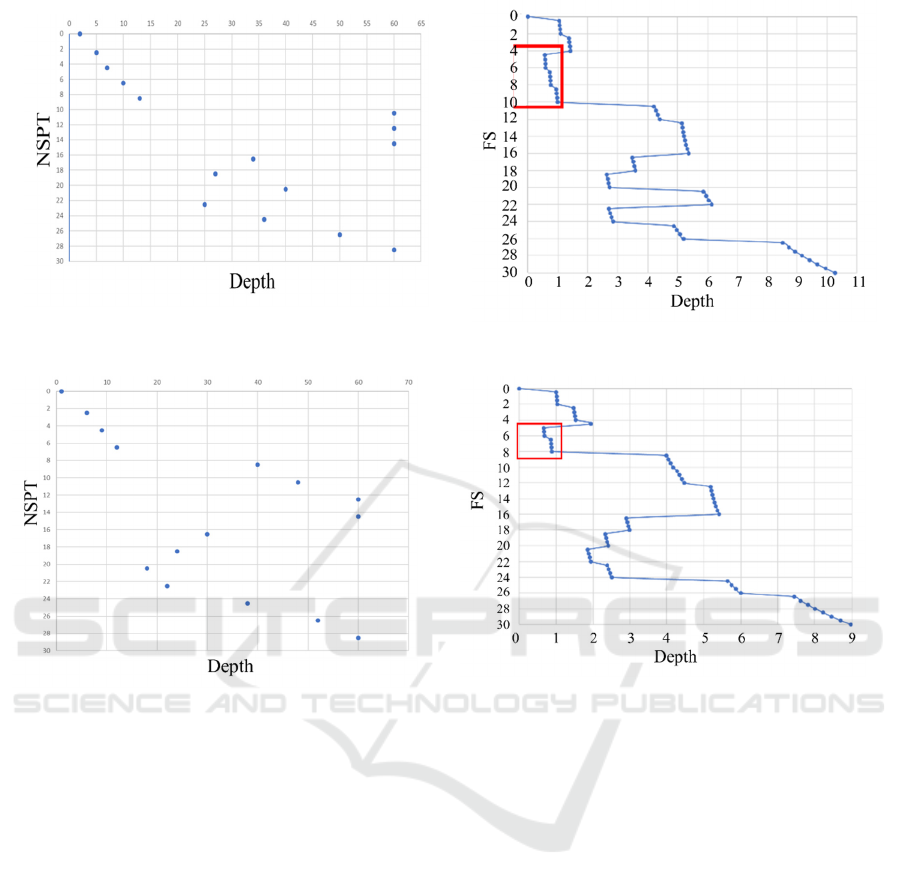
Figure 13: Depth vs NSPT for B1 soil profile. Figure 14: Depth vs FS for B1 soil profile.
Figure 15: Depth vs NSPT for B2 soil profile. Figure 16: Depth vs FS for B2 soil profile.
Guidelines). This code will be used as inference
system for risk analysis using Fuzzy-based method.
This code is used as inference system because it
contains expert overview about geotechnical aspects
or parameter being described above.
This code is published by Badan Standarisasi
Nasional (National Standarization Agency) of
Indonesia. A group of geotechnical expert in
Indonesia is then form a team to set this standard /
code. The team consist of Indonesia Government
(represented by experts from Ministry of General
Works and Housing), civil engineering society
(represented by Himpunan Ahli Teknik Tanah
Indonesia / Indonesian Society for Geotechnical
Engineering and Himpunan Pengenmbangan Jalan
Indonesia / Indonesian Raod Develompent
Association), university (represented by Tama
Jagakarsa University, National Technological
Institute) and private sector (represented by PT
Belaputera Intiland and PT MBT).
3.1 Slope Stability Design Guidelines
(Chapter 7 of SNI 8460:2017)
This code, generally, covers common technical
requirement for artificial slope. And for natural slope,
this require the engineer to check the natural slope
stabilization where there will be development in any
part of slope. The goal of slope stability checking is
to design and review the safest and most economical
slope design. Embankment is well covered by this
code. In this code, several different analysis type shall
be done to have board result of embankment
condition. This code require at least short-term
analyses (when embankment works finished), long-
term analyses (for operational needs), sudden-draw
down analyses (when embankment has high water
table) and seismic analyses. The safety factor for soil
slope and the criteria for seismic design as suggested
by SNI 8460-2017 are shown in Tables 3 and 4
respectively.
EIC 2018 - The 7th Engineering International Conference (EIC), Engineering International Conference on Education, Concept and
Application on Green Technology
136

Table 3: Safety Factor value for soil slope (SNI 8460-2017).
Costs and Consequences from failed slope
Level of uncertainty in the condition analysis
Low
a
High
b
Repair cost are equal to additional cost to
design a more conservative slope
1.25 1.5
Repair cost are greater to additional cost to
design a more conservative slope
2.5 2.0 or more
a
The level of uncertainty in the analysis condition is categorized as low, if geological conditions can
be understood, soil conditions are uniform, soil investigations are consistent, complete and logical to
the conditions in the field.
a
The level of uncertainty in the analysis condition is categorized as high, if geological conditions are
very complex, soil conditions are vary, soil investigations are inconsistent and unreliable.
Tabel 4: Criteria for seismic design based on infrastructure designation (SNI 8460:2017).
Allotment Design age
(Years)
Probability
Exceeded (%)
Return
Period
(Years)
Safety Criterions Reference
Building and
Non Building
50 2 2500 - SNI 1726:2012
Conventional
bridge
75 7 1000 - SNI 2833:201X
Earth retaining
wall, bridge
abutment
75 7 1000 SF > 1.5 (against sliding when
experiencing static load)
WSDOT,
FHWA-NJ-2005-
002
SF > 2 (against overturning
when experiencing static load)
SF > 1.1 (against pseudo static)
Approach
bridge’s
abutment
- - - SF > 1.1 -
Dam 100 1 10000
Safety
Evaluation
Earthquake
(SEE)
Uncontrolled water flow does
not occurs
ICOLD
No. 148-2016
Deformation does not exceed
0.5 of height
Deformation of filters does not
exceed 0.5 from filter thickness
Spillway shall still functional
after earthquake event
100 50 145
Operating
Basis
Earthquake
(OBE)
Minor damage occurs after
earthquake
-
Dam
Supplementary
Building
50 2 2500 - -
Tunnel 100 10 1000 - -
3.2 Seismic Hazard Design Guidelines
(Chapter 12 of SNI 8460: 2017)
Bridge is no different than any other civil structure or
building. It is prone to earthquake event. In SNI
8460:2017, earth retaining wall and bridge abutment
shall resist earthquake force with several minimum
SF value. The criteria for seismic design is shown in
Table 4.
3.3 Liquefaction Design Guideline
In this research, liquefaction analysis is conducted
using Youd-Idriss Method. This method has final
value, the SF value. Like the other parameter, this
Geotechnical Assessment for Truss Bridge using Fuzzy-based Soft Computing: Case Study - Kedaung Bridge, Tangerang, Banten Indonesia
137

value has safe limitation. SF value for liquefaction
analysis is at least 1 for the first 20 meter depth of
granular soil layer with high water table. Triggering
parameter for liquefaction is earthquake with
minimum magnitude of SR (Scale of Richer) = 7.0.
Kedaung Bridge is located in vulnerable tectonic
plate with megathrust and fault seismic sources that
have qualified to trigger liquefaction.
4 RISK ANALYSIS USING FUZZY
–BASED METHOD
Whole parameter and evaluation works above have
conducted, the next step is to weighting the risk based
on Indonesian Standard Codes (SNI / Standar
Nasional Indonesia).
4.1 Fuzzy Logic
Fuzzy logic is a logic to describe imprecision, to
approximate reasoning and to explain uncertainty of
something. Fuzzy logic can be viewed as an attempt
at formalization / mechanization of two remarkable
human capabilities; First, the capability to converse,
to make reason, and to make rational decision in an
environment of imprecision, uncertainty,
incompleteness of information, conflicting
information, partiality of truth and partiality of
possibility; Second, the capability to perform a wide
variety of physical and mental task without any
measurement and any computations (Zadeh, 2008).
Fuzzy logic can describe normal human
languange. This method use neutral way of how
human thinking and reasoning. Fuzzy logic use input
data and process it with some reasoning (we may call
itu as “blackbox”). This blackbox contains a sort of
reasoning. And after the input has been processed, the
output can be obtained.
5 CONCLUSION
This research is still in progress. Especially in the risk
analyses using Fuzzy-based method in civil
engineering world. We still in progress to clarify that
Fuzzy-based methods can be used in Civil
Engineering. In this research, we take advantages of
Fuzzy logic in civil engineering. Kedaung Bridge
abutments have affordable SF value in long-term,
short-term and seismic condition. SF value vary from
1.183 to 2.092.
Tangerang is located in earthquake vurnerable
zone. Maximum historical earthquake magnitude
value in SR is 8.2. It comes from Java Magathrust.
Liquefaction around B1 and B2 location is considered
safe. Liquefaction (with earthquake triggering value,
SR = 8.2) may happen in depth 4 ~ 10 meter of soil
layer.
ACKNOWLEDGEMENTS
This researh is fully supported by PITTA Programs
from University of Indonesia. PITTA is Paduan
Hibah Publikasi Internasional Terindeks untuk Tugas
Akhir Mahasiswa UI (Grants of Indexed International
Publication for Final Project of University of
Indonesia Students).
REFERENCES
An, M., Chen, Y. & Baker, C. J., 2011. “A Fuzzy Reasoning
anf Fuzzy-Analytical Hierarchy Process Based
Approach to the Process of Railway Risk Information:
A Railway Risk Management System”, Information
Sciences, Vol. 181, pp. 3946-3966.
Attaway, S., 2009. MATLAB: A Practical Introduction to
Programming and Problem Solving, Oxford - UK:
Bitterworth – Heinermann - Elsevier Inc.
Andric, J. M. & Lu, D. G., “Risk Assessment of Bridges
Under Multiple Hazards in Operation Period”, Journal
of Safety Science, Vol. 83, pp. 80-92.
Carbonari, S., Morici, M., Dezi, F., Gara, F. & Leoni, G.,
2017. “Soil-Structure Interaction Effect in Single
Bridge Piers Founded on Inclined Pile Groups”, Soil
Dynamics and Earquake Engineering, Vol. 92, pp. 52-
67.
Cook, W., Barr, P. J. & Halling, M. W., 2015. “Bridge
Failure Rate”, Journal of Performance of Constructed
Facility, Vol. 29, pp. 1-8.
Corotis, R. B., 2015. “An Overview of Uncertainty
Concepts Related to Mechanical and Civil
Engineering”, Journal of Risk and Uncertainty in
Engineering System, Vol. 1, pp. 1-12.
Craig, R. F., 2004. Soil Mechanics, 7
th
edition, New York –
USA: Spon Press.
Duncan, J. M. & Stephen, G. W., 2005. Soil Strength and
Slope Stability, New Jersey – USA: John Wiley & Sons
Inc.
Fagundes, D. F., Almeida, M. S. S., Thorel, L. & Blanc, M.,
2017. “Load Transfer Mechanism and Deformation of
Reinforced Piled Embankment”, Geotextiles and
Geomembranes, Vol. 45, pp. 1-10.
Kusumadewi, S., Hartati, S., Harjoko, A. & Wardoyo, R.,
2006, Fuzzy Multi-Attribute Decision Making (Fuzzy
MADM), Yogyakarta – Indonesia: Penerbit Graha Ilmu.
EIC 2018 - The 7th Engineering International Conference (EIC), Engineering International Conference on Education, Concept and
Application on Green Technology
138

Kusumadewi, S., 2002. Analisis & Desain Sistem Fuzzy
Menggunakan Toolbox Matlab, Yogyakarta –
Indonesia: Penerbit Graha Ilmu.
Kusumadewi, S. & Purnomo, H., 2010., Aplikasi Logika
Fuzzy Untuk Pendukung Keputusan, 2
nd
edition,
Yogyakarta – Indonesia: Penerbit Graha Ilmu.
Lee, S., 2015. “Determination of Priority Weight Under
Multi-Attribute Decision-Making Situation: AHP
versus Fuzzy AHP”, Journal of Construction
Engineering and Management, Vol. 141, pp. 1-9.
Marwoto, S., 2014. “Pemodelan Sistem Pendukung
Keputusan Untuk Pemeliharaan Jembatan Beton”,
Jurnal Teknik Sipil, Vol. 2, No. 1, pp. 1-5.
Maula, B. H. & Zhang, L., 2011. “Assessment of
Embankment Factor of Safety Using Two
Commercially Available Programs in Slope Stability
Analysis”, Procedia Engineering, Vol. 14, pp. 559-566.
Nezarat, H., Sereshki, F. & Ataei, M., 2015. “Ranking of
Geological Risks in Mechanized Tunneling by Using
Fuzzy Analytical Hierarchy Process (FAHP)”,
Tunneling and Underground Space Technology, Vol.
50, pp. 358-364.
Ossama Y & Barakat, W., 2013. “Application of Fuzzy
Logic for Risk Assessment using Risk Matrix”,
International Journal of Emerging Technology and
Advanced Engineering, Vol. 3, pp. 49-54.
Patel, D. A., Kikani, K. D. & Jha, K. N., 2016. “Hazard
Assessment Using Consistent Fuzzy Preference
Relation Approach”, Journal of Construction
Engineering and Management, Vol. 142, pp. 1-10.
Senouci, A., El-Abbasy, M. S. & Zayed, T., 2014. “Fuzzy-
Based Model for Predicting Failure of Oil Pipelines”,
Journal of Infrastructure System, Vol. 20, pp. 1-11.
Zadeh, L. A., 2008. “Is There a Need for Fuzzy Logic”,
Journal of Information Sciences, Vol. 178, pp. 2751-
2779.
Zatar, W. A., Harik, I. E., Sutterer, K.G. & Dodds, A. 2008.
“Bridge Embankment. I: Seismic Risk Assessment and
Rating”, Journal of Performance of Constructed
Facility, Vol. 22, pp. 171-180.
Geotechnical Assessment for Truss Bridge using Fuzzy-based Soft Computing: Case Study - Kedaung Bridge, Tangerang, Banten Indonesia
139
