Vertical Electrical Sounding Survey to Determine Groundwater
Potential in Sekaran, Gunungpati, Semarang, Indonesia
Supriyadi
1
, Taufik Nur Fitrianto
1
and Hadi Susanto
1
1
Department of Physics, Universitas Negeri Semarang, Semarang, Indonesia
Keywords: Geoelectrical, resistivity, groundwater
Abstract: A research to figure out the location and extent of groundwater distribution in western Sekaran administrative
village using resistivity method in Schlumberger configuration has been carried out. Data were taken using
S-Field resistivity meter from 5 locations stretching 160 to 300 m each. Those data were then processed using
Microsoft Excel, Progress, and Rockwork. Two types of aquifers were found; unconfined and confined. This
finding agrees with groundwater condition in the research area, according to the Central Java Map of
Groundwater Basin (CAT). This research area belongs to the Ungaran CAT region with two aquifer types of
unconfined and confined. Unconfined aquifer is located 18-28 m deep in the sand and pebble layer, while
confined aquifer is located at more than 77 m depth in the tuffaceous sand layer. In order to see the extent of
groundwater distribution, the data were then modeled in 3D.
1 INTRODUCTION
One of the most urgent issues the world is dealing
with is the ever increasing number of its population
that will directly raise the demand for water (Balia &
Viezzoli, 2015). According to UNEP (United Nations
Environment Program, 2012), more than two billion
people will be in great demand for water by 2050
(Yousif & Sracek, 2016). The problem is that surface
water cannot meet this demand. Hence, more
groundwater supply is required (Expo et al., 2016).
Groundwater is very important as it is the main source
of water for both industrial and domestic needs
(Kazakis et al., 2017) such as water for consumption.
Groundwater can be found in the pores of
sedimentary rocks, in the crevices of hard rocks, and
in karst caves.
This is also in issue Sekaran as there are more
people and hence, the need for water (Jayanti et al.,
2012). Sekaran administrative village is a water
catchment area. However, rapid developments cause
more water to directly flow on the surface that less
water comes down to the catchment are beneath the
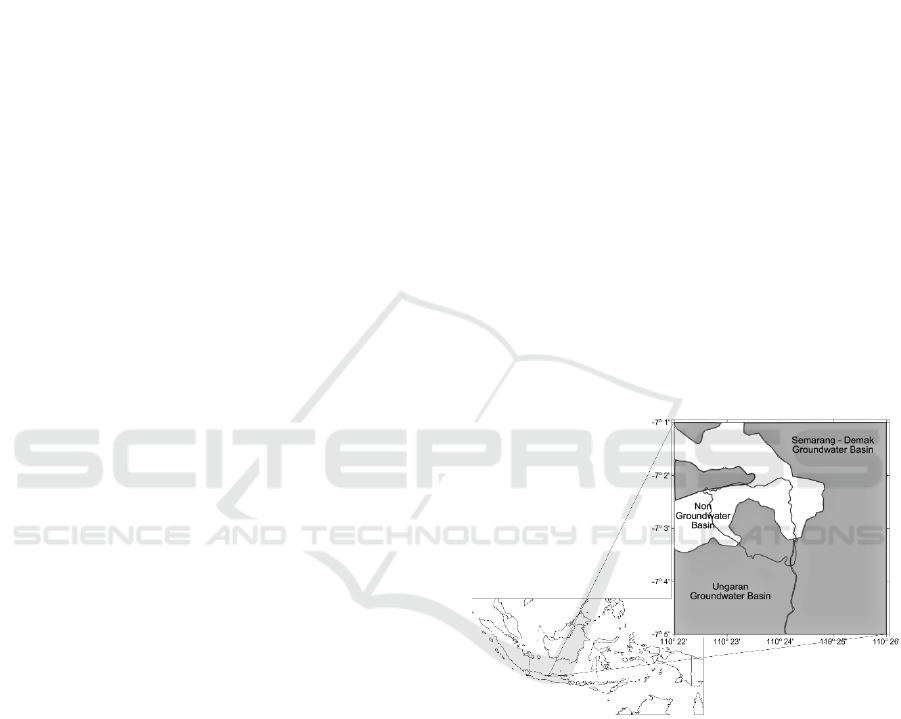
ground (Agustina et al., 2012). Based on Figure 1,
Sekaran administrative village is in the border
between CAT Ungaran and non-CAT areas.
Figure 1: Central Java Groundwater Basin Map (Setiadi,
2003).
Nowadays, the use of geophysical methods to
explore groundwater is on the increase. The use of
vertical electrical sounding to detect groundwater is
very popular due to its simplicity (Abdullahi et al.,
2014) and ease of data interpretation (Adelusi et al.,
2014). Sounding using geophysical methods involves
the measurements of physical characteristics of the
surface of the Earth to gather information about its
underground structure and composition. (Strelec et al.
2017). Geoelectric method is often used to probe
groundwater, location of faults, mineral exploration,
and archeological research (Reynold, 1997).
Resistivity is one of the geoelectric methods in
Supriyadi, ., Nur Fitrianto, T. and Susanto, H.
Vertical Electrical Sounding Survey to Determine Groundwater Potential in Sekaran, Gunungpati, Semarang, Indonesia.
DOI: 10.5220/0009007301250129
In Proceedings of the 7th Engineering International Conference on Education, Concept and Application on Green Technology (EIC 2018), pages 125-129
ISBN: 978-989-758-411-4
Copyright
c
2020 by SCITEPRESS – Science and Technology Publications, Lda. All rights reserved
125
geophysics. This method is very effective for
groundwater exploration, especially to estimate the
thickness of a water body (Khalil and Santos, 2013).
Geoelectric probing is based on the fact that
different materials have different resistivity.
Resistivity is one the rock characteristics. That is its
ability to be passed by electrical current. In this
method, electric current is injected into the Earth via
two current electrodes, and then potential difference
between the two potential electrodes is measured
(Supriyadi et al., 2017).
In Schlumberger configuration, two electrodes are
positioned symmetrically along a straight line as
depicted in Figure 2., the Current Electrodes (AB) are
outside, whereas the Potential Electrodes (MN) are
inside. In order to change the depth range of
measurement, the current electrodes are moved
outside, while the potential electrodes are left where
they are (Obiajulu et al., 2016).
Figure 2: Scheme of electrodes in Schlumberger
configuration (Loke. 1999).
The Earth is assumed to be homogeneously
isotropic. But in reality, it consists of layers with
different resistivity values. Therefore, measured
resistivity values are not only from one layer, but
stem from many different layers. (Syaifuddin et al.
2018). Measured resistivity of medium values can be
calculated using Equation (1) as follows:
I
V
K
(1)
With the value of geometric factor (K) that can be
calculated using Equation (2) as follows:
MN
MNAB
K
22
22
(2)
2 METHOD
Data were taken manually using type S-Field
resistivity meter in the western part of Sekaran
administrative village from 21 - 24 April 2017.
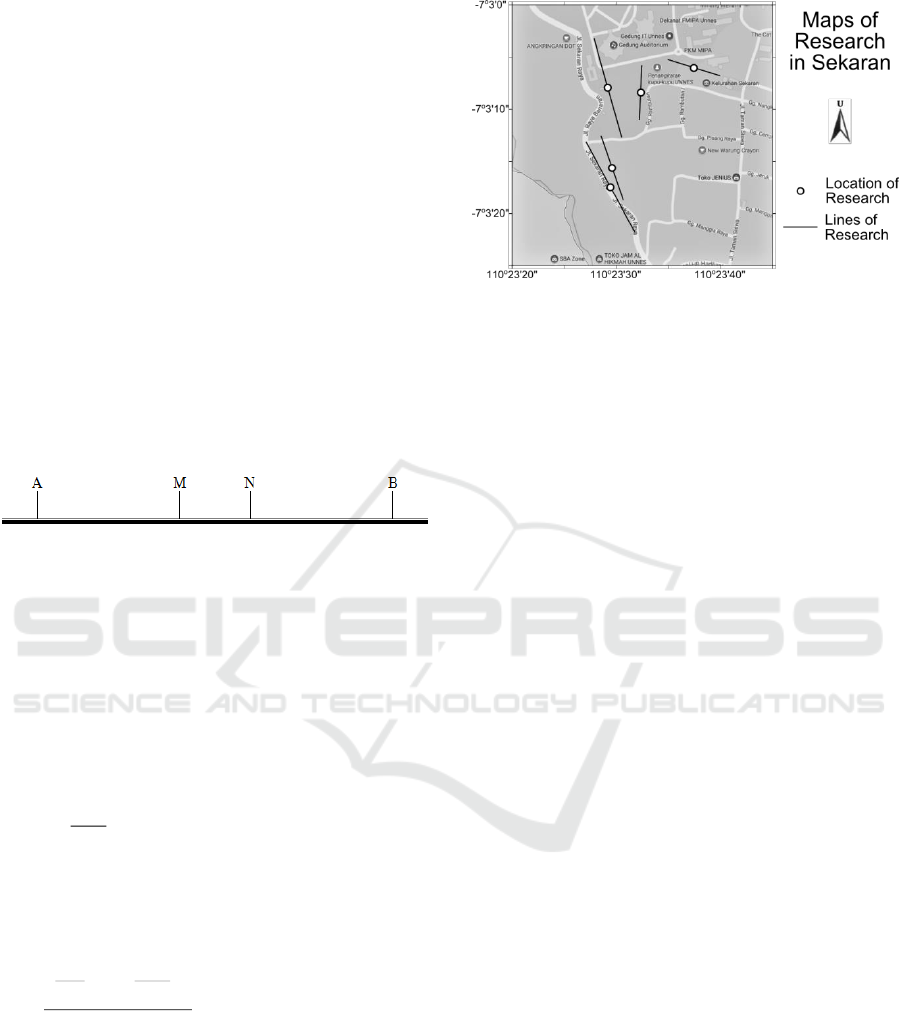
Research location and the lines are given in Figure 3.
Figure 3: Map of research location and lines.
Measurement of VES geoelectric data made use
of the Schlumberger configuration. Measurements
were carried out in five different locations spanning
160 - 300 m each. Data were measured manually in
line with the Schlumberger configuration. Data taken
include self-potential (SP), current (I
AB
) and potential
difference (V
MN
). Data of measurement positions and
line directions were also taken.
Those data were then processed using Microsoft
Excel to obtain apparent resistivity. The software
Progress was then used to gain 1D image of the data.
Differences in resistivity values were then used for
identification, along with basic knowledge of
resistivity aspects such as geological conditions, as to
interpret the subsurface condition of the surface area.
Once interpretation was conducted successfully, data
were then further processed using Rockwork to get
the subsurface 3D image.
3 RESULT AND DISCUSSION
Plotting of research location shows that the
research was carried out on top of the Kaligetas
formation. This formation consists of volcanic
breccia, lava flow, tuff rock, tuffaceous sandstone,
and clay. Breccia and lava flow with intermittent lava
and fine to coarse tuff rocks. Underneath this
formation is clay and tuffaceous sandstone. There are
also weathered volcanic rocks that often come in
massive bulks (Thanden et al., 1996).
Field data processing and matching with the
regional geological condition of Sekaran
administrative village show that the subsurface
condition of Sekaran is as can be seen in Table 1 and
Figure 4. Two types of aquifers were detected;
unconfined and confined. The unconfined aquifer is
located between 17.75 m to 41.41 m deep with layer
thickness of between 6.26 m to 19.48 m. Meanwhile,
EIC 2018 - The 7th Engineering International Conference (EIC), Engineering International Conference on Education, Concept and
Application on Green Technology
126
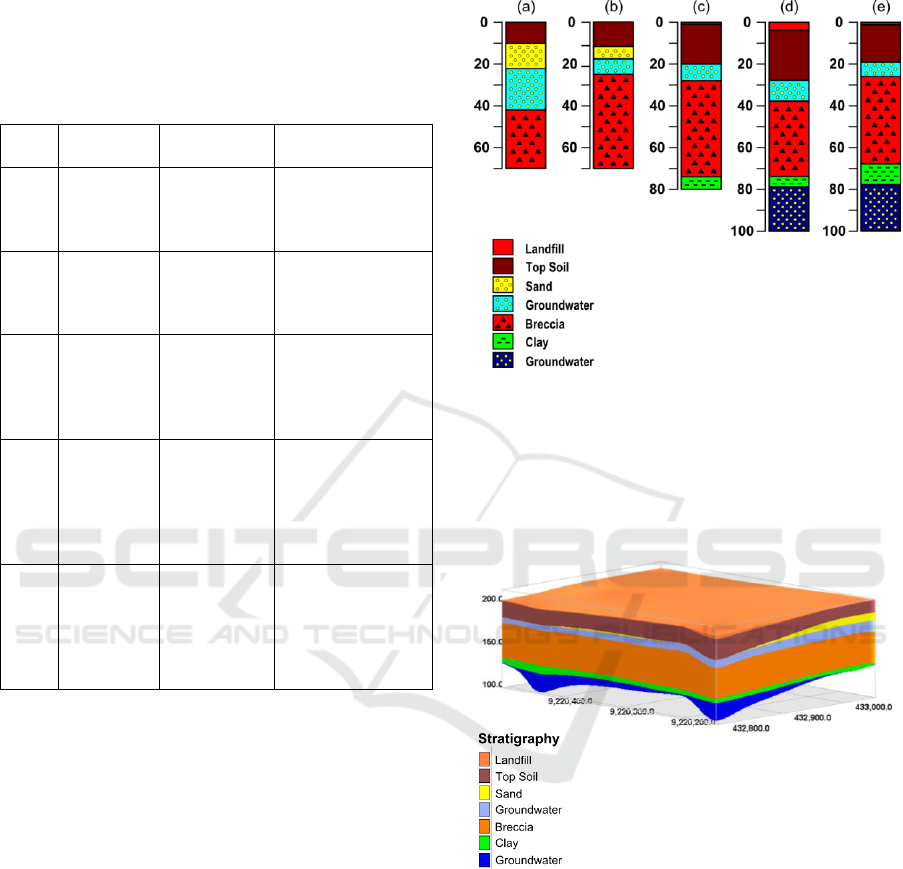
the confined aquifer is at a depth of more than 76.6
m. This particular layer is categorized as confined as
on top of it is a layer of clay. Those results reveal that
VES geoelectric method is very good for the
detection of groundwater potential and its thickness.
Table 1: Depths, Resistivity Values, and Type of Rock
Layers.
No.
Depth
(meter)
Resistivity
(Ohm m)
Type
1
0.00
16.71
Top Soil
10.02
59.31
Sand and Pebble
21.93
3.02
Sand and Water
41.41
115.65
Breccia
2
0.00
20.78
Top Soil
11.88
63.01
Sand and Pebble
17.75
4.24
Sand and Water
24.54
146.36
Breccia
3
0.00
79.95
Backfill Soil
0.68
47.19
Top Soil
19.88
5.08
Sand and Water
28.46
163.08
Breccia
74.03
10.24
Clay
4
0.00
36.05
Backfill Soil
3.94
30.20
Top Soil
28.38
7.86
Sand and Water
37.76
196.14
Breccia
73.60
10.01
Clay
78.60
3.02
Sand and Water
5
0.00
77.81
Backfill Soil
1.04
41.03
Top Soil
19.02
8.38
Sand and Water
25.28
115.14
Breccia
66.53
10.11
Clay
76.60
2.88
Sand and Water
Based on the geological map, results of this
research are in line with the geological condition of
Sekaran area. They are well-proven as there are
layers of breccia and lava flow, with clay and
tuffaceous sand underneath them. Furthermore, the
finding of two aquifers that matches the CAT map of
Sekaran area is also in support of them. There are two
types of aquifers were found; unconfined and
confined.
Other than those, data interpretation revealed two
types of sand layers; dry sand and pebble, and wet
sand and pebble with water content. Even though the
two layers are of the same rock type, they have starkly
contrasting resistivity values. Resistivity value for
the dry sand and pebble layer is up to 60 - 65 ohm.m,
whereas that of the wet sand and pebble reaches 3 - 8
ohm.m. This difference in resistivity value is due to
the electrolytic properties of conductive rocks. Higher
resistivity values of sand and pebble and lower
resistivity values of water cause the current to flow
with the help of fluid (water) ions in the crevices of
sand and pebble (Fallah-Safari et al., 2013).
Figure 4: The 1D image of Sekaran subsurface condition
consisting of depths and rock types.
In order to help interpret the extent of
groundwater distribution, 3 modeling was conducted,
with the help of Rockworks, as can be seen in Figure
5.
Figure 5: Map of research location and lines.
Based on Figure 5 in its western part reveals two
aquifers of unconfined and confined types. The
surface of groundwater, which is a unconfined
aquifer, is seen to be of the same depth from the
ground surface. This unconfined aquifer consists of
sand.
Meanwhile, the confined aquifer below is also of
equal depth from the ground surface and extents
evenly. This confined aquifer lies underneath a layer
of breccia and lava flow, as well as clay. It consists
of tuffaceous sand at 77 m depth.
Vertical Electrical Sounding Survey to Determine Groundwater Potential in Sekaran, Gunungpati, Semarang, Indonesia
127

However, seen from the eastern side, there is only
one aquifer found, the unconfined aquifer. The
confined aquifer cannot be detected from this side as
it is not easy to get maximum extent of the research
line. The eastern part of Sekaran area is filled with
housing complexes that does not allow long range
extension of geoelectric wires.
This side also witnesses an unfilled sandy
unconfined aquifer, or at least only passed by water.
This is perhaps due to extensive use of groundwater
by the people living nearby. The numerous living
quarters and buildings, and also roads also prevent
water catchment.
It can be seen in Figure 5 that there are two types
of groundwater aquifer in Sekaran administrative
village. Both aquifers extends evenly to all areas in
Sekaran administrative village with different depths.
The depth of unconfined aquifer is between 17.75 m
to 28.46 m, while the depth of confined aquifer is at
more than 76.60 m.
4 CONCLUSIONS
Results show that there are two types of
groundwater aquifer in Sekaran administrative
village. Both aquifers extends evenly at different
depths. The depth of the unconfined aquifer is
between 18 m to 28 m, whereas the depth of the
confined aquifer is at more than 77 m.
ACKNOWLEDGEMENTS
The writers wish to thank the Head of Physics
Laboratory of Universitas Negeri Semarang for the
instruments used in this research. The writers are also
indebted to the people of Sekaran administrative
village for allowing us to carry out our research there,
and to fellow students from Geophysics Study Group
of Universitas Negeri Semarang for the contribution
in data collection.
REFERENCES
Abdullahi, M. G., Toriman, M. E. & Gasim, M. B., 2014.
“The Application of Vertical Electrical Sounding
(VES) For Groundwater Exploration in Tudun Wada
Kano State, Nigeria”, International Journal of
Engineering Research and Reviews, Vol. 2, No. 4, pp.
51–55.
Adelusi, A. O., Ayuk, M. A., & Kayode, J. S. 2014. “VLF-
EM and VES: an application to groundwater
exploration in a Precambrian basement terrain SW
Nigeria”, Annals of Geophysics, Vol. 57, No. 1, p.
S1084.
Agustina, D., Setyowati, D. L. & Sugiyanto, S., 2012.
‘Analisis Kapasitas Infiltrasi pada Beberapa
Penggunaan Lahan di Kelurahan Sekaran Kecamatan
Gunungpati Kota Semarang”, Geo-Image, Vol. 1, No.
1, pp. 87 – 93.
Balia, R. & Viezzoli, A., 2015. “Integrated Interpretation of
IP and TEM Data for Salinity Monitoring of Aquifers
and Soil in The Coastal Area of Muravera (Sardinia,
Italy)”, Bollettino di Geofisica Teorica ed Applicata,
Vol. 56, pp. 31-44.
Ekpo, A. E., Orakwe, L. C., Ekpo, F. E., & Eyeneka, F. D.,
2016. “Evaluating the Protective Capacity of Aquifersat
Uyoinakwaibom State, Southern Nigeria, using the
Vertical Electrical Sounding (VES) Technique”,
International Advanced Research Journal in Science,
Engineering and Technology, Vol. 3, No. 1, pp. 34 –
39.
Fallah-Safari, M., Hafizi, M. K. & Ghalandarzadeh, A.,
2013. “The Relationship between Clay Geotechnical
Data and Clay Electrical Resistivity”, Bollettino di
Geofisica Teorica ed Applicata, Vol. 54, pp. 23-38.
Jayanti, M. H. D., Setyowati, D. L. & Tukidi, 2012.
“Potensi Pemanenan Air Hujan (Rain Water
Harvesting) Kampus Unnes sebagai Pendukung Unnes
Konservasi”, Geo-Image, Vol. 1, No. 1, pp. 28 – 34.
Kazakis, N., Voudouris, K., Vargemezis, G., & Pavlou, A.,
2017. “Hydrogeological regime and groundwater
occurrence in the Anthemountas River Basin”, Bulletin
of the Geological Society of Greece, Vol. 47, No. 2, pp.
711–720.
Khalil, M. A. & Santos, F. A. M., 2013. “2D and 3D
resistivity inversion of Schlumberger vertical electrical
soundings in Wadi El Natrun, Egypt: A case study”.
Journal of Applied Geophysics, Vol. 89, pp. 116–124.
Loke, M. H., 1999. Electrical Imaging Surveys for
Environmental and Engineering Studies. A Practical
Guide to 2-D and 3-D.
Obiajulu, O. O., Okpoko, E. I.& Mgbemena, C. O., 2016.
“Application of Vertical Electrical Sounding to
Estimate Aquifer Characteristics of Ihliala and Its
Environs, Anambra State, Nigeria”, ARPN Journal of
Earth Sciences, Vol. 5, No. 1, pp. 13–19.
Setiadi, H., 2003. Peta Cekungan Air Tanah di Provinsi
Jawa Tengah. Semarang: Dinas ESDM Jawa Tengah.
Strelec, S., Mesec, J., Grabar, K. & Jug, J., 2017.
“Implementation of in-situ and Geophysical
Investigation Methods (ERT & MASW) with The
Purpose to Determine 2D Profile of Landslide”, Acta
montanistica Slovaca, Vol. 22, pp. 345 - 358.
Supriyadi, Khumaedi, & Putro, A. S. P., 2017.
“Geophysical and Hydro chemical Approach for
Seawater Intrusion in North Semarang, Central Java,
Indonesia”, International journal of GEOMATE: geo-
technique, construction material and environment, Vol.
12, pp. 133–139.
EIC 2018 - The 7th Engineering International Conference (EIC), Engineering International Conference on Education, Concept and
Application on Green Technology
128

Syaifuddin, F., Widodo, A. & Puji, M. N., 2018.
“Resistivity Tunnel Monitoring System”, IPTEK
Proceedings Series, 1.
Thanden, R.E., N. Sumadirdja, P.W.& Richards, 1996. Peta
Geologi Lembar Magelang dan Semarang, Jawa, scale
1:100.000. Bandung: Puslitbang Geologi.
Yousif, M. & Sracek, O., 2016. “Integration of Geological
Investigations with Multi-GIS Data Layers for Water
Resources Assessment in Arid Regions: El Ambagi
Basin, Eastern Desert, Egypt”. Environmental Earth
Sciences, Vol. 75, p. 684.
Vertical Electrical Sounding Survey to Determine Groundwater Potential in Sekaran, Gunungpati, Semarang, Indonesia
129
