
Bayesian Analysis Application in Nuclear Physics
Parada. T. P. Hutauruk
Asia Pacific Center for Theoretical Physics, Gyeongbuk, 36765, South Korea
Keywords:
Bayesian Analysis, Kaon Photo-production, Nested Sampling Integration, Excited Baryon Resonances,
Associated Legendre Polynomial.
Abstract:
Bayesian analysis is applied to analyze the CLAS experimental data of the angular distributions of the differ-
ential cross sections, and C
x
0
and C
z
0
double polarizations for γ + p → K
+
+ Λ reaction. These observables can
be classified into four Legendre classes and represented by associated Legendre polynomial function itself.
In this analysis, we intend to determine the best data model for both observables. We use the Bayesian tech-
nique to select the best model by calculating the posterior probabilities and comparing the posterior among
the models for each observable. The posteriors probabilities for each data model are computed using a Nested
sampling integration. From this analysis, we found that the CLAS data set needs no more than four associated
Legendre polynomials to describe the differential cross section data. For C
x
0
and C
z
0
double polarizations
require two and three order of associated Legendre polynomials respectively to describe the data well. The
extracted coefficients of each observable of the best model are presented. It shows the structure of baryon
resonances qualitatively.
1 INTRODUCTION
Significant information on the structure of the nu-
cleon can be obtained by studying its excitation spec-
trum [1, 2]. Over the last few decades, a large amount
information about the spectrum of the nucleon has
been collected. Most of this information has been ex-
tracted from pion-induced and pion photo-production
reactions [3, 4]. However, pionic reactions may have
biased the information on the existence of certain res-
onances. Constituent quark model calculations pre-
dict a much richer resonance spectrum than that has
been observed in pion production experiments [8].
Predicted resonances which have not been observed
are called ”missing” resonances. Instead, the con-
stituent quark model (CQM) also predicts that these
”missing” resonances may couple strongly to KΛ and
KΣ channels or other final states involving vector
mesons [8, 9, 10]. Since performing kaon-hyperon,
kaon-nucleon or hyperon-nucleon scattering experi-
ments is a daunting task, kaon photo-production on
the nucleon appears to be a good alternative solu-
tion [9, 10].
Experiments on kaon photo-production and
electro-production started in the 1960s[11]. However,
the old experimental data are often inconsistent and
have large error bars. In recent years, a large amount
of data for kaon photo-production has been collected.
High statistics data from the CLAS, for differential
cross sections, recoil polarization, C
x
and C
z
double
polarizations for the reaction γ + p → K
+
+ Λ have
been published since several years ago [12, 13]. The
world database for the reaction γ + p → K
+
+ Λ is
more available now. This gives a possibility to ana-
lyze the data more accurately. Recently the newest ex-
perimental data for the K
+
Λ channel of photon asym-
metry (Σ), target polarization (T), recoil polarization
(P), and O
x
0
and O
z
0
double polarizations has been
collected [14]. Unfortunately, the experimental data
do not published yet. Furthermore the experimental
data for other observables such as G asymmetry will
available soon from Jefferson Lab. Newport News,
USA.
Additional experimental data have also been mea-
sured by SAPHIR [15, 16, 17], LEPS [18, 19] and
GRAAL [20]. Several previous analyses have been
applied to the results of these experiments, such as
Isobar models [9, 10, 21, 22, 23] and Coupled chan-
nel models [24, 25, 26]. However different theoret-
ical model calculations often produce very different
predictions.
Based on paper of Ref.[5], all sixteen observ-
ables in kaon photo-production were shown to
be classified into the classes L
0
ˆ
I;
ˆ
E;
ˆ
C
z
0
;
ˆ
L
z
0
,
310
Hutauruk, P.
Bayesian Analysis Application in Nuclear Physics.
DOI: 10.5220/0008908700002481
In Proceedings of the Built Environment, Science and Technology International Conference (BEST ICON 2018), pages 310-315
ISBN: 978-989-758-414-5
Copyright
c
2022 by SCITEPRESS – Science and Technology Publications, Lda. All rights reserved

L
1a
ˆ
P;
ˆ
H;
ˆ
C
x
0
;
ˆ
L
x
0
, L
1b
ˆ
T;
ˆ
F;
ˆ
O
x
0
;
ˆ
T
z
0
, and
L
2
ˆ
Σ;
ˆ
G;
ˆ
O
z
0
;
ˆ
T
x
0
, where each class is an ex-
pansion in a different set of associated Legendre
polynomials. What is not apparent is how many
terms in each expansion are required. This work
attempts to address the issue by examining data mod-
els with different numbers of terms, and calculating
which one has the greatest posterior probability. In
this article we focus on the differential cross section
observables, which are described by the associated
Legendre class L
0
and the double polarizations of
C
x
0
and C
z
0
, which are described by the associated
Legendre class L
0
and L
1a
, respectively.
This paper is organized as follows. We begin with
a brief review on the Bayesian analysis procedure
which contains the data model and model compari-
son in Sec. 2. Then in Sec. 3 our numerical results are
presented and their implications are discussed. Sec. 4
is devoted for a summary.
2 ANALYSIS PROCEDURE
In this section, the Bayesian analysis [6] proce-
dure for the kaon photo-production is presented. We
begin to construct the data model based on the Legen-
dre classes. We then use a comparison strategy to de-
termine the best model. In general we have two steps
to determine the best model. Firstly to compute the
maximum posterior for each photon energy for each
observable. Secondly to compare the maximum pos-
terior among the models with different order of Leg-
endre polynomials. We then employ the Nested sam-
pling integration to execute the multi-integral over the
parameters of Legendre polynomials. Nested sam-
pling is a very powerful technique to evaluate the
multi-dimensions integral into one dimension inte-
gral. This also has been used in many fields such as
astrophysics [27], cosmology [28], statistics [29], and
high energy physics [30].
2.1 Data Model
We construct data models based on Legendre
class L
0
. These data models can be written com-
pactly as follows:
M
L
0
L
=
l=L
X
l=0
A
l
P
l0
(cosθ). (1)
where M
L
0
L
is the data model, and A
l
and P
l0
(cosθ)
are the coefficients and associated Legendre polyno-
mials, respectively. Each data model therefore has a
different “order” or maximum number of polynomi-
als. Our task is to find the most likely order. Note that
analogous data model can be built for another Legen-
dre class.
2.2 Model Comparison
To determine the best model, we evaluate the poste-
rior probability [6] for each data model. The ratio of
the probabilities for M
L
and M
0
can be written, using
Bayes theorem, as follows :
R =
P(M
L
|D)
P(M
0
|D)
=
P(D|M
L
)
P(D|M
0
)
×
P(M
L
)
P(M
0
)
. (2)
where P(M
L
|D) is the posterior for the M
L
model,
P(D|M
L
) is the probability that the data would be ob-
tained, assuming M
L
to be true (the likelihood). With
no prior prejudice as to which variant is correct, we
obtain the ratio of likelihoods:
R =
P(D|M
L
)
P(D|M
0
)
The likelihood P(D|M
L
) is an integral over the joint
likelihood P(D, {A
l
}|M
L
), where {A
l
} represents a set
of free parameters:
P(D|M
L
) =
Z
...
Z
P(D, {A
l
}|M
L
)d
L
A
l
,
=
Z
...
Z
P(D|{A
l
}, M
L
)P({A
l
}|M
L
)d
L
A
l
.
(3)
The function P(A
l
|M
L
) is the prior probability
that the parameters take on specific values. We as-
sume that each parameter A
l
lies in the range A
min
l
≤
A
l
≤ A
max
l
, and we can write the prior as the re-
ciprocal of the volume of a hyper-cube in parame-
ter search space as P({A
l
}|M
L
) =
1
Q
L
(A
max
l
−A
min
l
)
. If
the errors in the data points are Gaussian, it can be
shown that P(D|{A
l
}, M
L
) ∝ exp
−
χ
2
2
, where χ
2
is the
sum of squared residuals. Using a Taylor series ex-
pansion about the minimum χ
2
, χ
2
≈ χ
2
min
+
1
2
(X −
X
0
)
T
∇
2
χ
2
(X − X
0
) + ..., we can write an approximate
form for the likelihood:
P(D|M
L
) ∝
L!(4π)
L
Q
L
(A
max
l
− A
min
l
) ×
p
Det(∇∇χ
2
)
exp
−
χ
2
min
2
. (4)
where L is the dimension of the integral and
(Det(∇∇χ
2
) is the determinant of the Hessian matrix,
which in turn is the inverse of the covariance matrix.
For simplicity the Eq.(3) can also be written as
follows:
Z =
Z
L(A
i
)π(A
i
)dA
i
. (5)
Bayesian Analysis Application in Nuclear Physics
311
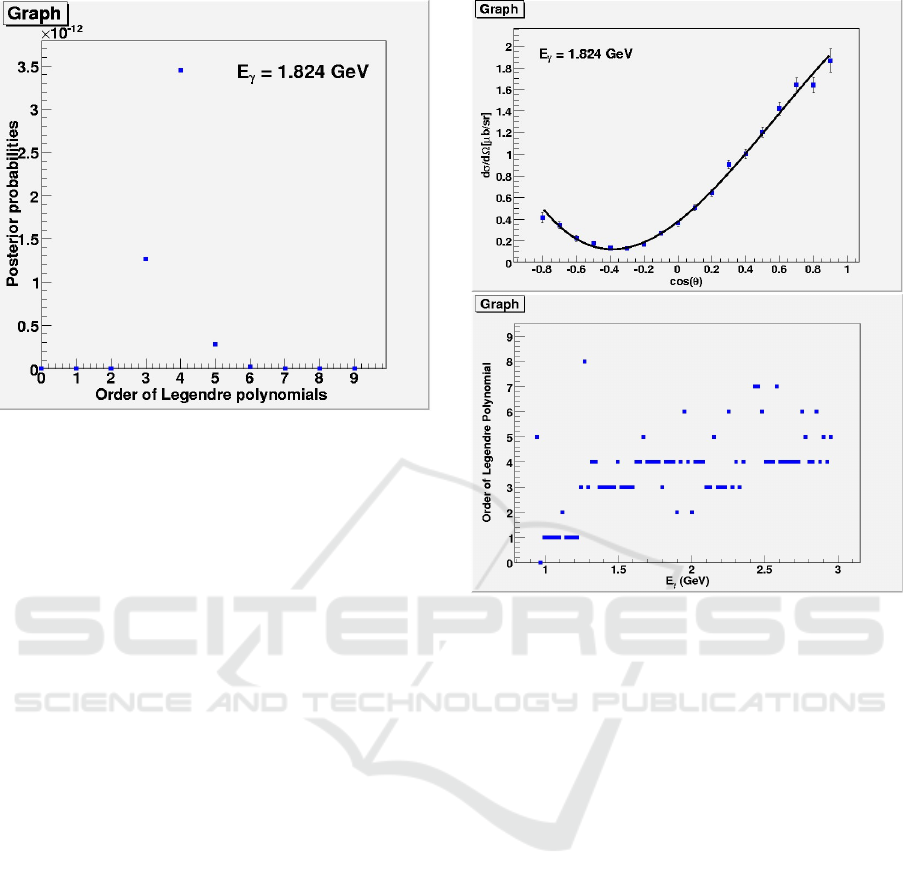
Figure 1: The posterior probabilities for different orders of
data model, for E
γ
= 1.824 GeV.
Where L(A
i
) is the likelihood functions and π(A
i
) is
the prior distribution. Nested sampling is a Monte
Carlo integration technique for evaluating the inte-
gral of a likelihood function or Bayesian Evidence
in Eq.(5) over its range of parameters which is de-
veloped by Skilling [31]. This technique exploits the
relation between the likelihood and prior volume to
transform the multidimensional of evidence integral
into one dimensional integral. The prior volume X is
defined by dX = π(Θ)d
D
Θ
, so that:
X(λ) =
Z
L(Θ)
π(Θ)d
D
Θ
, (6)
where the integral extend over the region of the pa-
rameter space contained the iso-likelihood contour
L(Θ) = λ. Assuming that L(X) is monotonically de-
creasing function of X which is trivially satisfied for
most posteriors. The evidence integral can be written
as follows:
Z =
Z
1
0
L(X)dX. (7)
A more detailed of this technique can be found in
Ref. [31].
3 NUMERICAL RESULTS
Using the above analysis procedure, for each of
the available photon energy bins, we fitted each data
Figure 2: Plot showing the fit of the fourth order data model
to the CLAS cross section data for E
γ
= 1.824 GeV (on
the top).The order of associated Legendre polynomial for
all photon energy (on the bottom).
model to the angular distribution. This was carried out
using the standard minimization package MINUIT.
We then compared models with different numbers of
Legendre polynomials by evaluating Eq. (4) for each
data model.
To illustrate the procedure, we first choose one
photon energy bin at E
γ
= 1.824 GeV as an exam-
ple. The posterior probabilities are shown in Fig. 1,
where the order of the data model is shown on the
horizontal axis. The maximum posterior is given by
the data model containing four associated Legendre
polynomials.
On the left side in Fig. 2 we show the fit of the
fourth order data model to the CLAS differential cross
section data [12] for E
γ
= 1.824 GeV. The procedure
is repeated for each photon energy bin. The right side
in Fig. 2 the order of data model which has the great-
est probability at each photon energy is plotted. It
can be seen that this generally increase from thresh-
old into the resonance region, but that the maximum
is mostly at the fourth order. The distributions of the
polynomial coefficients for fourth order data models
BEST ICON 2018 - Built Environment, Science and Technology International Conference 2018
312
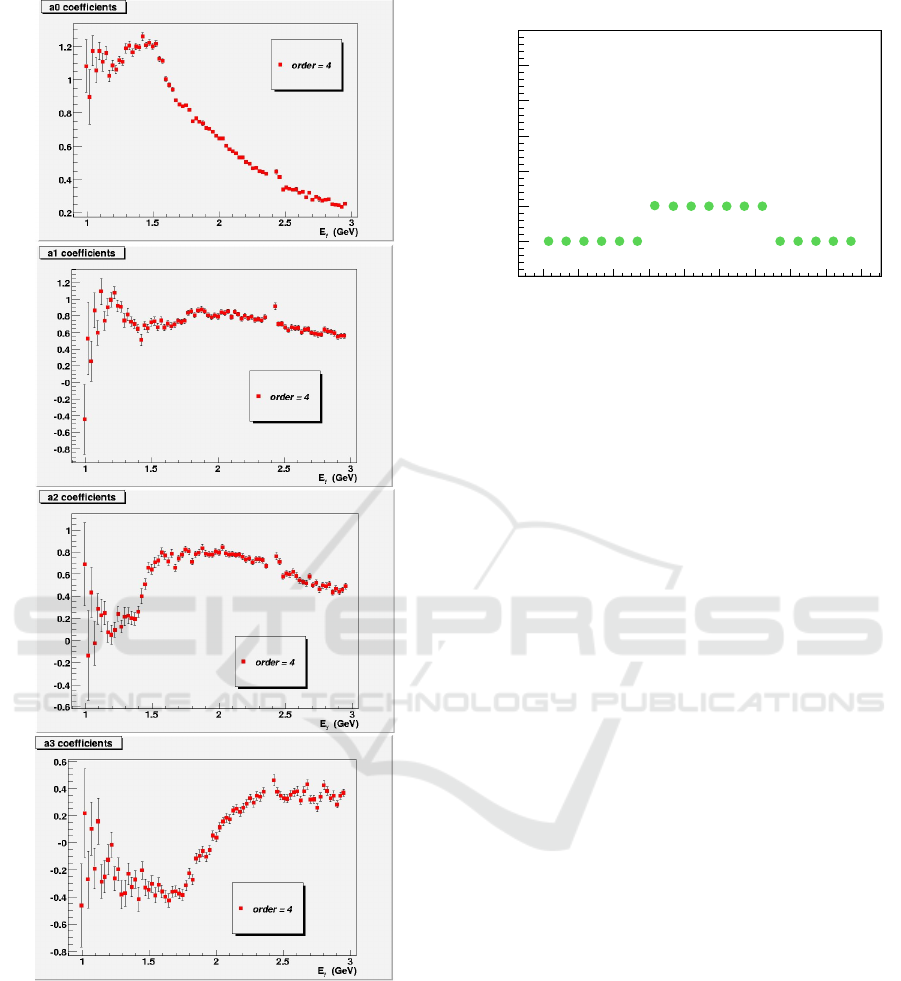
Figure 3: Extracted associated Legendre polynomial coeffi-
cients for each photon energy.
as a function of photon energy is shown in Fig. 3.
The experimental data available for KΛ of C
x
dan
C
z
double polarization measured at unprime coordi-
nate system, whereas in our analysis we require the
data of C
x
0
and C
z
0
double polarization which were
measured at prime coordinate system (outgoing kaon
or z’-axis). Hence we have to transform these observ-
ables using a standard rotation matrix as follows:
[GeV]
γ
E
1 1.2 1.4 1.6 1.8 2 2.2 2.4 2.6 2.8
Data Model
0
1
2
3
4
5
6
7
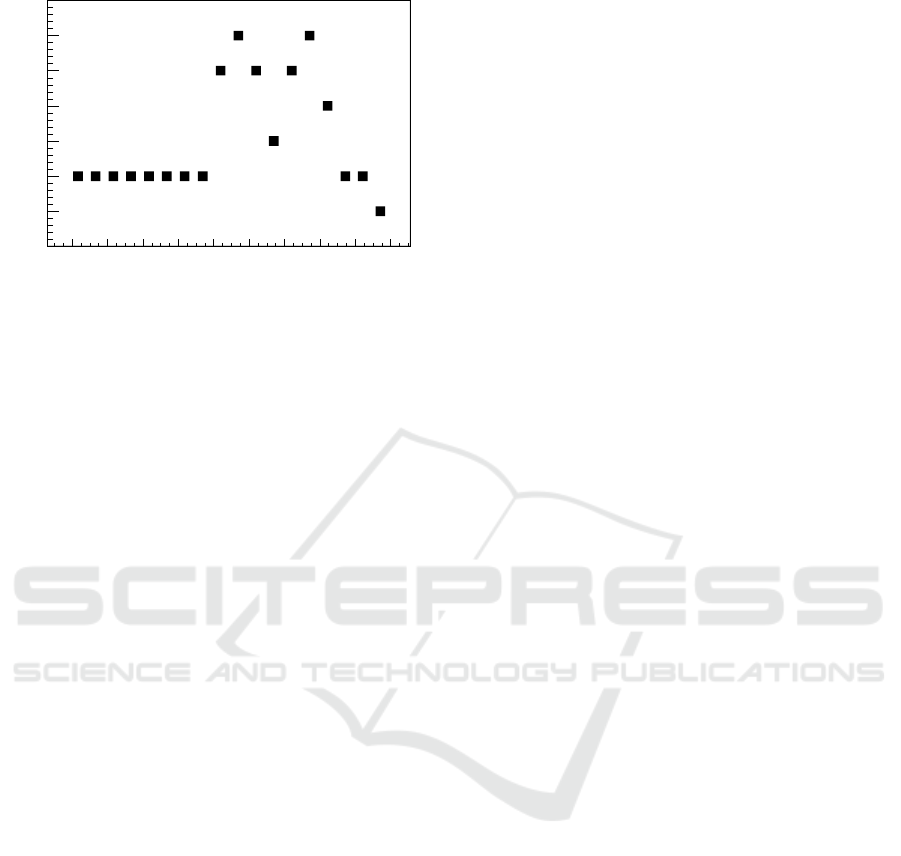
Figure 4: The best data model for each photon energy for
C
x
0
double polarization.
C
x
0
= C
x
cosθ − C
z
sinθ,
C
z
0
= C
x
sinθ + C
z
cosθ. (8)
Where θ is the kaon scattering angle. Then the results
of this transformation will be used in the analysis.
Using Eq. (7) we computed the evidence for each
photon energies (E
γ
). For calculating the posterior we
chosen the uniform prior distribution π(Θ). We then
compared the posterior of the data model with dif-
ferent order of associated Legendre polynomials for
each photon energies. The best data model for each
photon energy of C
x
0
double polarization are shown
in Fig. 4. Fig. 4 provides most experimental data of
C
x
0
double polarization can be described well by M
1
data model. Extracted coefficients of the best model
for C
x
0
double polarization provided in Fig. 6. The
extracted coefficients results for other models are also
shown in Fig. 6.
With similar procedures, the best data model for
C
z
0
double polarization are shown in Fig. 5. The most
experimental data for C
z
0
double polarization can de-
scribed by M
2
data model. The extracted coefficients
for this observable provided in Fig. 7. Generally the
extracted coefficients results of the best data model
for C
x
0
and C
z
0
double polarizations may reveal the
baryon resonances.
4 SUMMARY
Bayesian analysis is a powerful tools for determin-
ing the best data model. We have analyzed the Leg-
endre polynomial decomposition of differential cross
section data and the associated Legendre polynomials
of C
x
0
and C
z
0
double polarizations data. We gener-
ated data models with different numbers of associated
Bayesian Analysis Application in Nuclear Physics
313
[GeV]
γ
E
1 1.2 1.4 1.6 1.8 2 2.2 2.4 2.6 2.8
Data Model
0
1
2
3
4
5
6
7
Figure 5: The best data model for each photon energy for
C
z
0
double polarization.
Legendre polynomials. We computed the evidence of
the data models by using the Nested sampling integra-
tion. We then compared them by calculating posterior
probabilities. From this analysis, we found that differ-
ential cross section data in this case requires at least
four associated Legendre polynomials, and C
x
0
and
C
z
0
double polarizations require two and three order
of associated Legendre polynomials respectively.
ACKNOWLEDGMENTS
P .T .P .H is supported by the Ministry of Science
and Education, ICT and transportation, Pohang city,
Gyeongsangbukdo, South Korea.
REFERENCES
[1] M. Guidal, J. M. Laget and M. Vanderhaeghen,
Nucl. Phys. A 627, 645 (1997).
[2] N. Kaiser, T. Waas and W. Weise, Nucl. Phys. A
612, 297 (1997).
[3] J. A. Mueller [CLAS Collaboration],Nucl. Phys.
A 721, 701 (2003).
[4] D. Sokhan et al. [CLAS Collaboration], Int. J.
Mod. Phys. A 24, 497 (2009).
[5] C. G. Fasano and Frank Tabakin, Phys. Rev.
C64, 6 (1992).
[6] D. S. Sivia, Data Analysis: A Bayesian Tutorial.
Clarendon Press. Oxford. (1996).
[7] R. A. Adelseck and B. Saghai, Phys. Rev. C42,
108 (1990).
[8] S. Capstick and W. Roberts, Phys. Rev. D49,
4570 (1994).
[9] T. Mart and C. Benhold, Phys. Rev. C 61,
012201R (2000).
[10] T. Mart, Phys. Rev. C 62, 038201 (2000).
[11] E. G. Gorzhevskaya, V. M. Popova and
F. R. Yagudina, Sov. Phys. JETP 11, 200 (1960)
[Zh. Eksp. Teor. Fiz. 38, 276 (1959)].
[12] R. Bradford et al. (CLAS collaboration), Phys.
Rev. C 73, 035202 (2006).
[13] R. Bradford et al. (CLAS collaboration), Phys.
ReV. C75, 035205 (2007).
[14] Craig Patterson, PhD Thesis, University of Glas-
gow, Scotland 2008 (unpublished).
[15] K. -H. Glander et al. (SAPHIR collaboration),
Eur. Phys. J. A19, 251-273 (2004).
[16] M. Q. Tran et al. (SAPHIR collaboration), Phys.
Lett. B445, 20 (1998).
[17] K. -H. Glander et al. (SAPHIR collaboration),
Nucl. Phys. A754, 294c-302c (2005).
[18] M. Sumihama at al. (LEPS collaboration), Phys.
Rev. C73, 035214 (2006).
[19] R. G. T. Zegers et al. (LEPS collaboration),
Phys. Rev. Lett. 91, 9 (2003).
[20] A. Lleres et al. (GRAAL collaboration), Eur.
Phys. J. A31, 79-93 (2007).
[21] D. G. Ireland, S. Janssen, J. Ryckebusch, Nucl.
Phys. A740, 147-167 (2004).
[22] Stijn Janssen et al, Phys. Rev. C65,015201
(2001).
[23] S. Janssen et al., Eur. Phys. J. A11, 105-111
(2001).
[24] V. Shklyar et al., Phys. Rev. C71, 055206
(2005)and references therein.
[25] A. Usov and O. Scholten, Phys. Rev. C72,
025205 (2005).
[26] G. Penner and U. Mosel, Phys. Rev. C66,
055211 (2002).
[27] Pia Mukherjee, David Parkinson and Andrew R.
Liddle, Astrophys. J. 638 (2006) L51-L54.
[28] R. Trotta, arXiv:1701.01467 [astro-ph.CO].
[29] W. K. Hastings, Biometrika 57, 97 (1970).
[30] G. D’Agostini, CERN-99-03, CERN-
YELLOW-99-03.
[31] J. Skilling, Bayesian Analysis 4(2006) 883-860.
BEST ICON 2018 - Built Environment, Science and Technology International Conference 2018
314
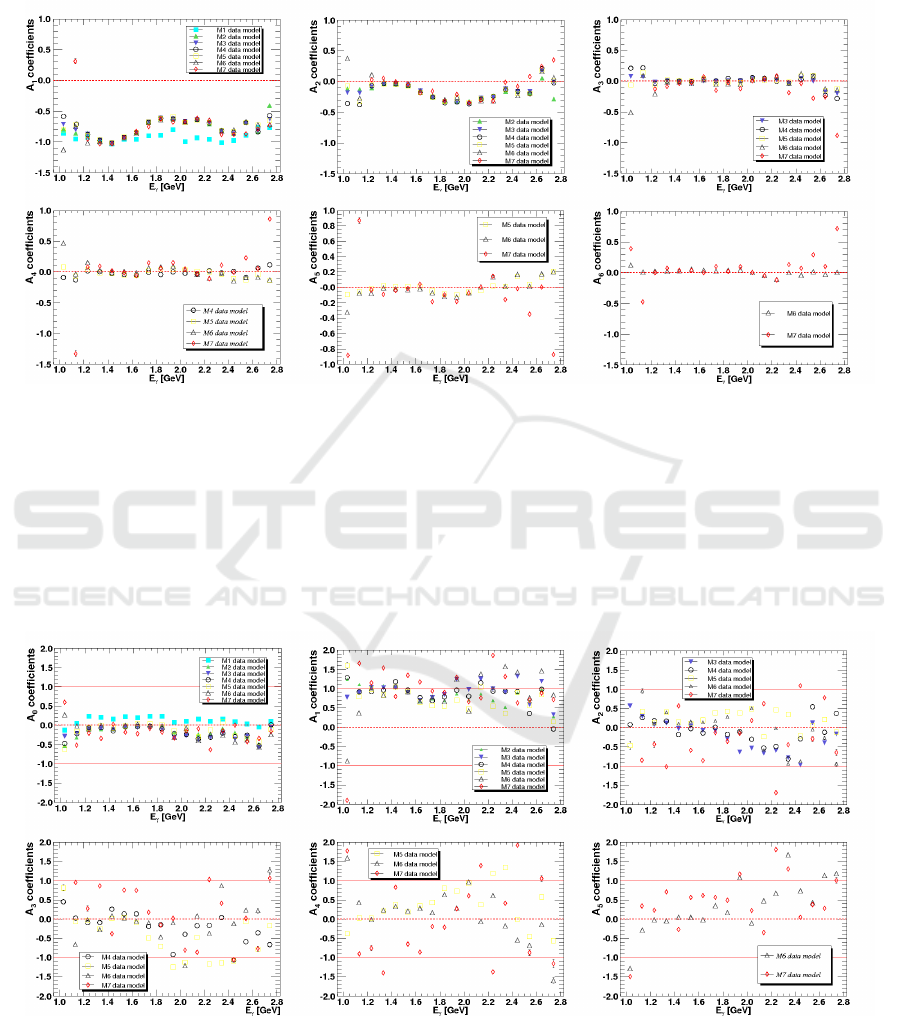
Figure 6: Extracted coefficients of C
x
0
double polarization for each photon energies.
Figure 7: Extracted coefficients of C
z
0
double polarization for each photon energies.
Bayesian Analysis Application in Nuclear Physics
315
