
Effective Urban Drainage for Juata Laut Landfill
Teguh Taruna Utama
1
, Dyah Ratri Nurmaningsih
1
, Dedy Suprayogi
1
, Abdul Hakim
1
,
Rr Diah Nugraheni Setyowati
1
Environmental Engineering Department, Sunan Ampel University,
Ahmad Yani Street 117, Surabaya, Indonesia
diahnugraheni@uinsby.ac.id
Keywords: Rainfall, Drainage, Channel
Abstract: Urban drainage management is a science that studies flood control in urban areas. This water management
system can be used for other water flow regulation settings, such as Housing drainage system, Waste Landfill
drainage system, and densely populated drainage system. Tarakan is one of cities in Indonesia. Because of
the amount of waste generation, Tarakan City requires a Final Waste Processing Site. Tarakan's municipal
landfill is designed to accommodate garbage produced by Tarakan City residents. DED Sanitary Landfill of
Tarakan City also requires a good drainage management so that rainwater does not flood the landfill. Drainage
planning stage starts from measuring the landfill site plan, rainfall modeling, designing flood discharge,
channels design and channel dimensions. Rainfall is measured using the estimated rainfall method. The data
were obtained from rain stations located on the island of Tarakan. After obtaining the rainfall data, the next
step was to estimate runoff discharge flowing around the landfill. Based on the results of measurements in the
field, the area of the Tarakan landfill is planned to be 40 ha. With this area of land, landfill is divided into
several cell zones. Based on the rainfall data, maximum rainfall occurred in July 2014 with a magnitude of
601 mm / month. Each of the maximum rainfall was used to determine the amount of rainwater runoff. Based
on the results of the analysis, the types of channel used are primary, secondary and tertiary with a square
channel shape. The maximum channel dimension is 11.19 m/s and the minimum channel dimension is 1.43
m/s.
1 INTRODUCTION
Indonesia is a tropical country which has a high
rainfall level (Amien, 2011). Urban drainage
management is important when the water flow is
regulated so that the flow goes to a lower area. The
surface drainage discharge is one of the indicators
that influences drainage systems management
(Valipour, 2012b).
Urban drainage management is a science that
studies flood control in urban areas. The water
management system can be used for other water flow
regulation settings, such as housing drainage system,
Waste Landfill drainage system, densely populated
drainage system (Amien, 2011).
Landfill drainage is one of important parameters
in the design of landfill. Landfill drainage will
discharge water to lower areas. The design and
construction of landfill drainage must consider land
use, slope and large rainfall (Mursito & Amien,
2011). Water flow is set to control puddles and floods.
Floods are avoided in the Waste Landfill. Rainwater
outside the waste cell is expected to enter the water
channel to the river while leachate enters the leachate
processing system.
Tarakan is one of cities in Indonesia. Based on
population projections for 2018 - 2037, Tarakan's
urban population will reach 345,168 people. This will
affect the amount of waste generated by the city
population. With the amount of waste generation,
Tarakan City requires a Final Waste Processing Site.
Tarakan municipal landfill is designed to
accommodate garbage produced by Tarakan City
residents. In addition to designing landfill zones, the
Tarakan City Landfill DED Sanitary landfill also
requires a good drainage management so that
rainwater runoff does not flood the Waste Landfill
(Utama & Ardhianto, 2017).
Utama, T., Nurmaningsih, D., Suprayogi, D., Hakim, A. and Setyowati, R.
Effective Urban Drainage for Juata Laut Landfill.
DOI: 10.5220/0008908000002481
In Proceedings of the Built Environment, Science and Technology International Conference (BEST ICON 2018), pages 185-190
ISBN: 978-989-758-414-5
Copyright
c
2022 by SCITEPRESS – Science and Technology Publications, Lda. All rights reserved
185
2 EVALUATION METHOD AND
MEASUREMENTS
2.1 Measurements of Rainfall
Rainfall is measured using the estimated precipitation
method. Some common methods used are Normal
Distribution, Log Normal, Pearson type III, Log
Pearson type III, and Gumbel. Some of these methods
require the last 10 year rain data. Precipitation data
can be obtained by recording the number of rainy
days throughout the year within a period of 10 years
(Suripin, 2004). This data can be obtained from rain
stations located on the Tarakan Island. Rainfall data
obtained were then matched with the rain model from
several rain models; the smallest level of tilt will be
the basis for planning drainage around the Waste
Landfill.
2.2 Drainage Planning Stage
Drainage planning stage starts from measuring the
landfill site plan, precipitation modeling, designing
flood discharge, drainage channel design and channel
dimensions (Amien, 2011). Site plan measurement
employed the theodolite and google earth methods.
The measurement with these methods will get results
of the site plan area and location coordinates.
Precipitation model is required to obtain large rainfall
falling to the ground. Some of the models mentioned
above will generate a statistical value that
corresponds to the actual condition in the field.
After obtaining rainfall, the next step was to
estimate runoff discharge that flows around the
landfill. Runoff debit is calculated using the rational
method. This method has the function of estimating
the design flood discharge. Flood design in question
is the peak flood discharge (Q
peak
), included in the
non-hydrograph design (Yanto, Warman, & Hatta,
2014).
The next step is to design the flow and dimensions
of the drainage channel. The channel dimensions are
closely related to channel slope and runoff discharge.
The channel is expected to accommodate peak flood
discharge and safely channel runoff water to a lower
place (Amien, 2011).
2.3 Precipitation Analysis
If the observation points in the area are not evenly
distributed, then the method of calculating the
average rainfall is done by calculating the area of
influence of each observation point (Arora & Singh,
1989; Yeshoda, Meenambal, & Manikandan, 2015).
Rainfall in that area can be calculated by the
following equation:
………… (1)
2.4 Precipitation Analysis
Precipitation analysis can be estimated by the model.
For this maximum daily precipitation analysis,
several methods can be used
2.4.1 Normal Distribution
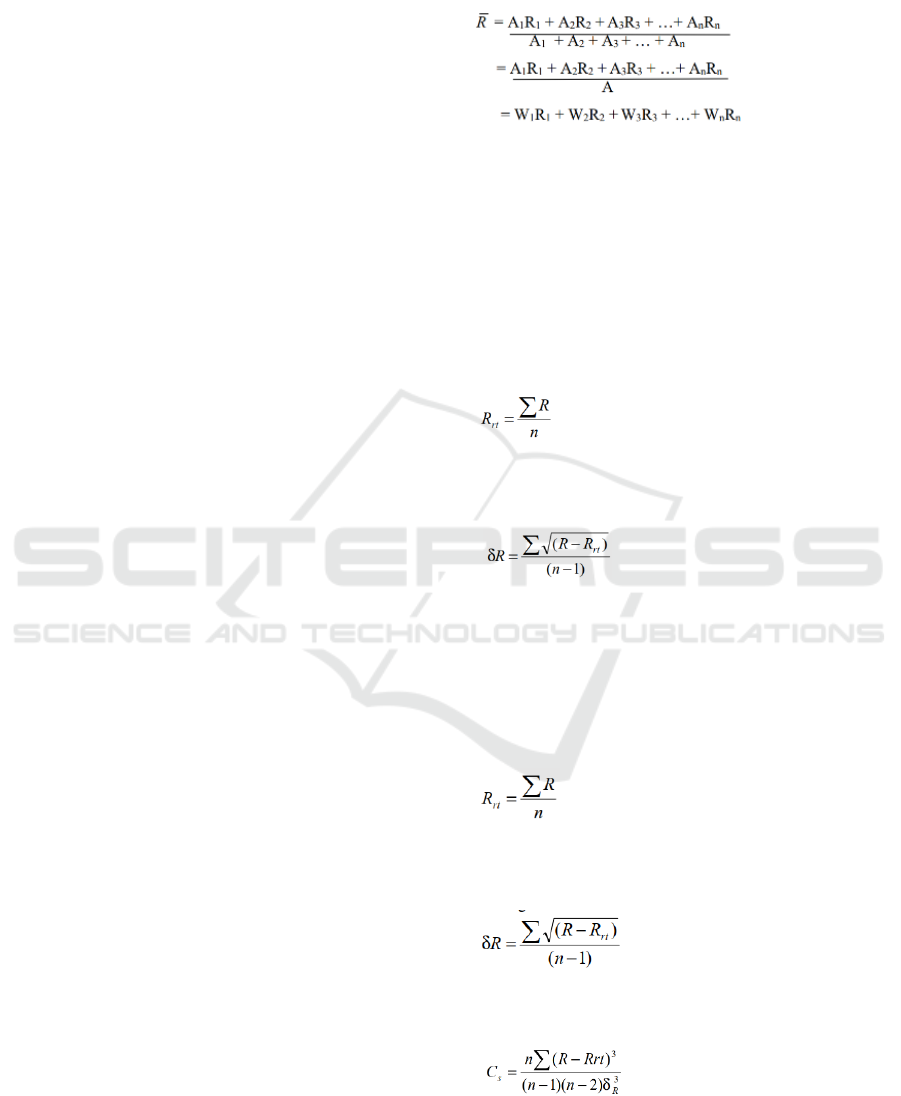
The first step of normal distribution is calculating the
average rainfall using the following equation:
………… (2)
The second step is calculating deviation standard, and
the third step is calculating variation coefficient using
the following equation:
………… (3)
Where R is the maximum annual rainfall, Rrt is
average annual rainfall, and δ
R
is deviation standard.
2.4.2 Pearson Type III
The first step of Pearson Type III is calculating the
average rainfall using:
………… (4)
The second step is calculating the deviation standard
and the third step is calculating variation coefficient
with
………… (5)
The third step is calculating the deviation standard
and Skewness Coefficient with
………… (6)
BEST ICON 2018 - Built Environment, Science and Technology International Conference 2018
186
Where R is maximum annual rainfall, Rrt is average
annual rainfall, δ
R
is deviation standard, and Cs is
skewness coefficient.
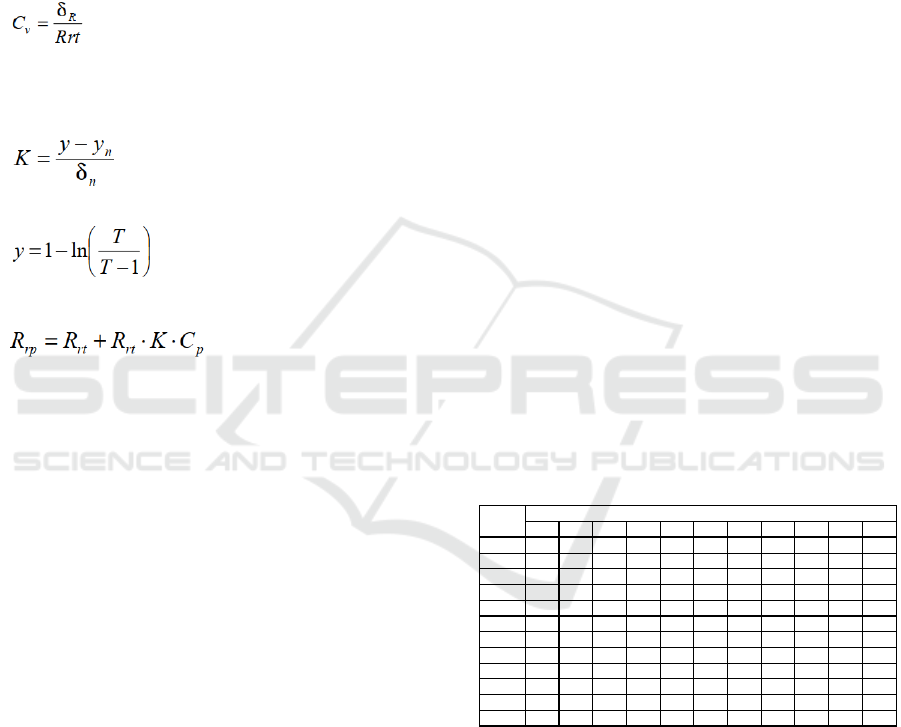
2.4.3 Gumbel Distribution
The first step of gumbel distribution calculating the
maximum average rainfall, the second step is
calculating the deviation standard, and the third step
is calculating the variation coefficient.
………… (7)
Next, expected mean reduced from n is calculated;
then, the fifth step is calculating frequency factor with
………… (8)
The sixth step is calculating y
………… (9)
The seventh step is calculating R
rp
...…….… (10)
Based on the four methods mentioned, models
were selected based on the smallest skewness. Model
selection was based on the smallest rate of infestation
to reduce errors in the design of flood discharge.
2.5. Precipitation Intensity Analysis
Short-term precipitation is expressed in hourly
intensity formulas. This intensity is called rainfall
intensity (mm / hour). The amount of rainfall intensity
varies. This is caused by the length of rainfall or the
frequency of occurrence. Some formulas of
precipitation intensity associated with these things
have been calculated as experimental formulas:
2.6 Maximum Plan Debit Analysis
The size of the maximum (m³ / second) Debit plan is
calculated by the regional formula:
Q = 0.278 x C x I x A (m³/s) ...…….… (11)
The amount of the maximum plan debit
corresponds to the return period and the estimated
area obtained as follows:
a. The direction of drainage in the channel follows a
continuous decrease in the existing altitude line so
that the drainage is gravitational.
b. Utilization of rivers/creeks for receiving water
bodies from the planned outfall, for drainage of work
site locations and drainage of water flows as large as
stockpiling.
3 RESULTS AND DISCUSSION
Based on the results of measurements in the field, the
area of the Tarakan TPA site plan is planned to be 40
ha. With this area of land, TPA is divided into several
waste cell zones. Drainage flowing from the landfill
Trash follows the perimeter of the waste cell and is
connected to the TPA inspection road drainage
channel (Gristlier, 1993; Jensen, 1967; Madani &
Brenton, 1995). According to the contour of the land,
the direction of the flow utilizes the slope of the land
and flows in gravity.
The dimensions of the drainage channel are based
on hydrological analysis. The analysis includes
rainfall data per 10 years. Then, the data are matched
by statistical rain analysis. Maximum debit plan is
very dependent on the availability of supporting data.
Discharge measurement is derived from rainfall data
theoretically based on methods commonly used. The
average maximum daily rainfall in Tarakan
Subdistrict from 2005–2015 was 378.3 mm / day in
2011. The rainfall table can be seen below.
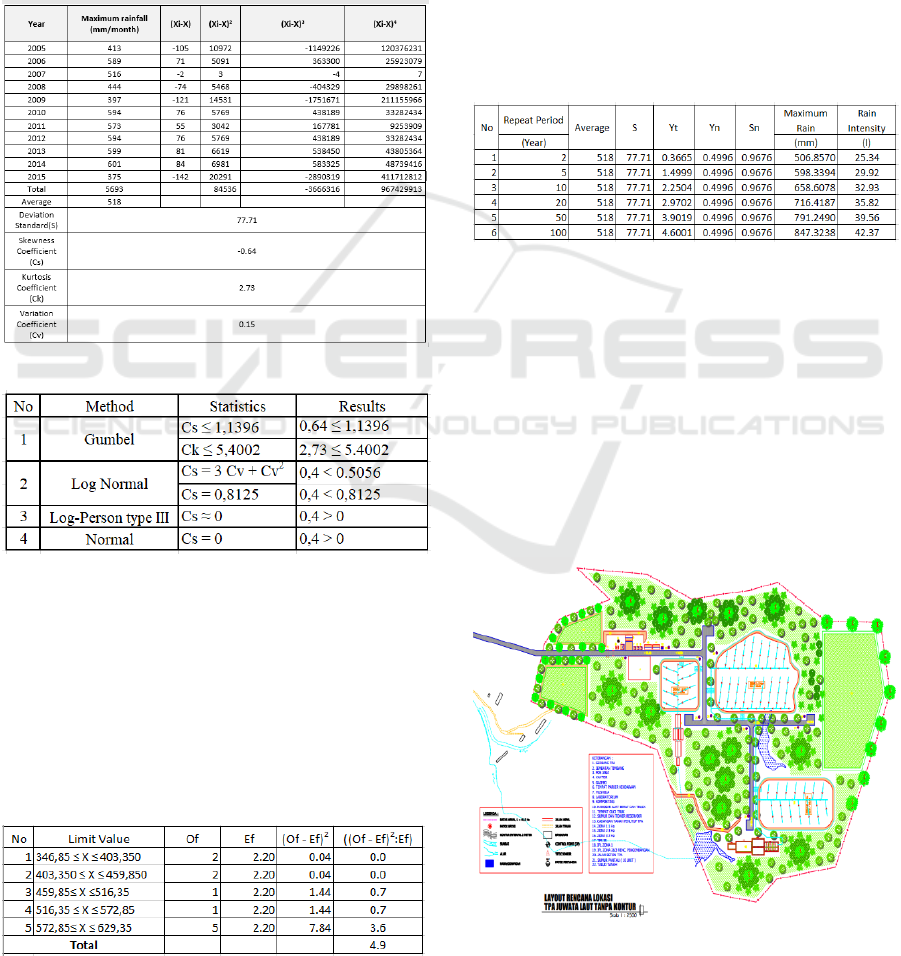
Table 1: Rainfall data in Tarakan Island 2005 - 2015
Based on the rainfall data, the maximum rainfall
occurred in July 2014 with a magnitude of 601 mm /
month. Each of the maximum rainfall is used to
determine the amount of rainwater runoff.
3.1 Frequency Analysis
Frequency analysis of the hydrological data is related
to the magnitude of extreme rainfall events that are
related to the frequency of occurrence through the
distribution of possibilities. Design rain is obtained
from the analysis of frequency distribution and
2005 2006 2007 2008 2009 2010 2011 2012 2013 2014 2015
Januari 234.7 155.2 253.2 443.6 397 288.4 397 .1 288.4 267.5 278.5 197.4
Februari 124.9 235.9 79.7 293.6 315.6 163 430.3 163 289.5 161.1 283.1
Maret 260.4 335.6 311.9 404.1 212.1 337.6 358 337.6 34 0.3 386 358.9
April 412.8 476.9 276.6 377.1 390.4 297.3 145.7 297.3 327.5 490.6 260.1
Mei 322.1 368 323.1 375.5 357.7 428.9 572 .7 428.9 378.9 265.8 232.6
Juni 280.4 588.9 431.2 320.9 189.1 226.7 370.4 226.7 280.9 269.9 224.8
Juli 159.2 409.4 385.8 312.8 234.9 455.8 244.3 455.8 598.9 601.1 200.2
Agustus 274.8 275.4 396.8 208.1 248.4 397.5 414.5 395.7 566.1 459.1 220.1
September 309 .6 288 .5 251.4 309.2 195.6 337.8 311.5 337.8 456.3 185.4 284.1
Oktober 339.4 422.5 323.3 206 334.1 362 474.8 362 356.5 317.7 208.2
November 352.9 337.5 405.9 426.5 368.7 359.8 306 359.8 34 3.2 259 375.1
Desembe r 271.1 268.7 515.9 291.8 218.1 593.5 513 .8 593 .5 261.1 408.3 329.8
Bulan
CurahHujan(MM/Bulan)
Effective Urban Drainage for Juata Laut Landfill
187
distribution match test. There are several methods
that can be used in frequency analysis, namely the
Gumbel method, Normal Log, Type III and Normal
Log-Person (Kidson & Richards, 2005; Otti,
Ejikeme, & Nwafor, 2013; Sangal & Biswas, 1970;
Shao et al., 2015; Valipour, 2012a). The results of
statistical parameter analysis in Table 2 show the
values of Cs and Ck. From this value, the most
suitable type of distribution uses the Gumbel method.
The analysis of distribution selection can be seen in
table 3.
Table 2: Statistical Analysis
Table 3: Distribution Analysis
3.2 Distribution Match Test
This distribution suitability test is intended to find out
the distribution that has been chosen to represent the
statistical sample of the analyzed data (San, Selamat,
& Ghani, 2009). After analyzing data for distribution
match testing, the appropriate method uses the Chi-
Square test. The results of the Chi-Square test
analysis are presented in Table 4.
Table 4: Chi-Square Test
The calculation results of Table 4 above obtained
X2 value of 4.9, while less than X2 value in the Chi-
Square test table whose magnitude was 7.815. Then,
from the compatibility test, the distribution of
Gumbel distribution can be accepted. The Gumbel
distributions is often considered as competing models
when the variable of interest takes values from −∞ to
+ ∞ (Qaffou, 2017).
3.3 Maximum Daily Rainfall Period
Frequency analysis is to confirm the return on rainy
events. This analysis aims to determine rainfall or
discharge with a certain return. The maximum rainfall
results with various returns are presented in Table 5 .
Table 5: Maximum rainfall
3.4 Drainage Dimension Plan
Drainage design plan in the Juwata Laut TPA is
determined by hydrological calculations. This
calculation determines the amount of rainwater
runoff. Then, hydraulic calculations are done to
determine the dimensions of the channel. Drainage
planning is certainly based on the existing landfill
layout (Bhagat, 2017). The following is the picture of
the existing layout of the Juwata landfill site which
will be built by the drainage channel.
Figure 1: Juata Laut landfill siteplam
BEST ICON 2018 - Built Environment, Science and Technology International Conference 2018
188
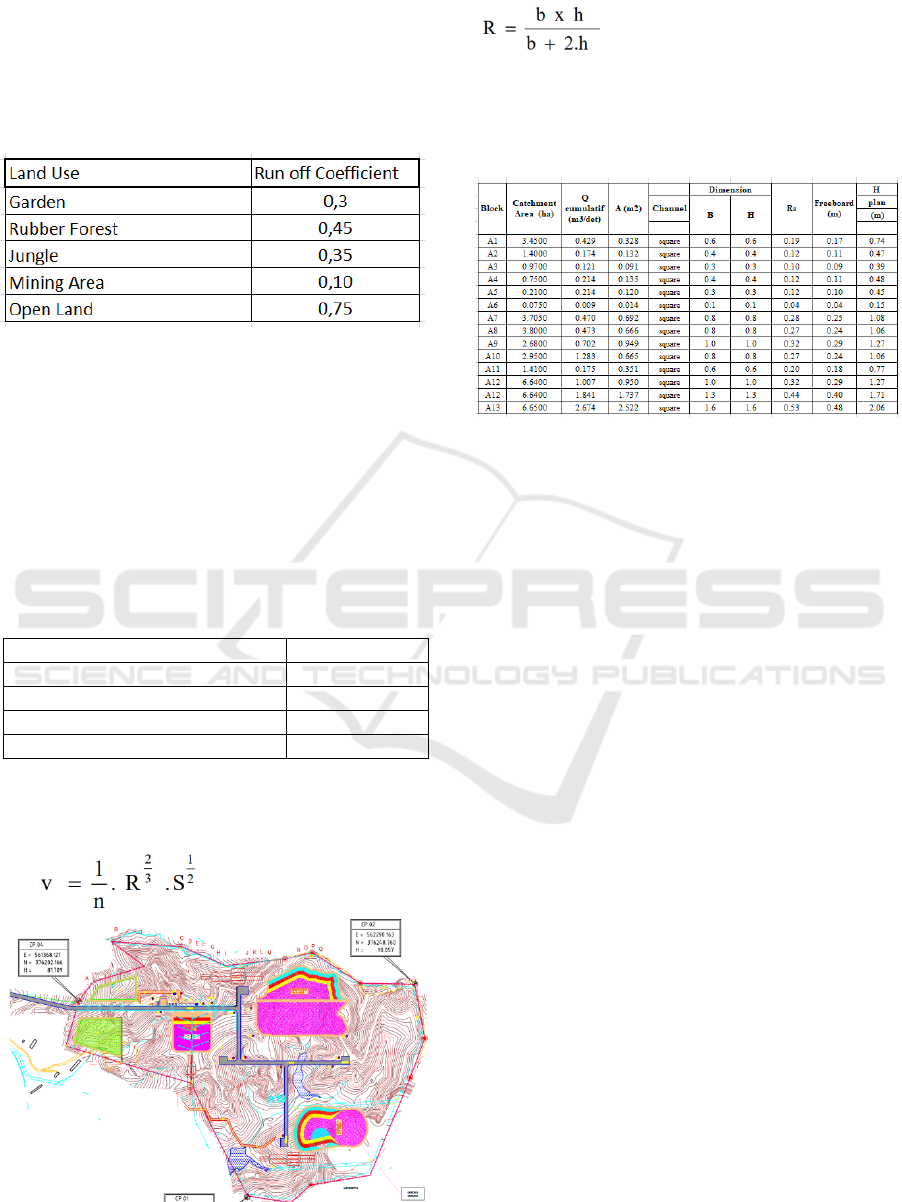
Land use that is used as a guide to determine
the runoff coefficient value in the Juwata TPA usually
has a flat elevation in urban areas, which is 0.3. This
runoff coefficient value will affect the analysis of the
drainage channel design plan. Runoff coefficient
value in Juwata TPA is presented in table 6 .
Table 6: Runoff Coefficient
Drainage design is based on the channel material
used. This type of material will affect the maximum
and minimum speed of water. Flow velocity will
affect the process of sedimentation and erosion. Flow
velocity is less than 0.6 m / s will cause sedimentation
at the bottom of the channel while the flow velocity
that exceeds 2 m/s will cause drainage channels to
erode. The material used as a drainage channel will
affect the Manning coefficient. Manning coefficient
value used is 0.035 which is a channel on finely cut
rock. The Manning coefficient value can be seen in
table 7 .
Table 7: Manning Coefficient
Type of materials N
Brick: Open channel 0.014 – 0.017
Concrete: Open channel 0.013 – 0.022
Gravel: Open channel 0.014 – 0.033
Rock: Open channel 0.035- 0.045
Source : (Lin, 2007)
The flowrates in channel can be calculated by
manning formula
...…….… (12)
Figure 2: Juata Laut Landfill Drainage Plan
The channel dimension can be calculated by a
...…….……...... (13)
From the data obtained and explained previously,
the results of the analysis of the design plan for the
design of drainage dimensions in the Sea Juwata
Landfill are presented in Table 8 .
Table 8: Dimension of drainage channels
Drainage planning in the Sea Juata Landfill is
made around the landfill embankment. This channel
prevents the flow of water into the landfill and drain
rainwater out of the landfill. Drainage channels are
separated with leachate collection channels. Drainage
channels will carry rainwater runoff safely outside the
landfill and do not mix with leachate. That way, this
planning is an integrated part of the overall planning
of the Juata Laut Landfill.
4 CONCLUSION
Drainage planning stage starts from measuring the
landfill site plan, precipitation modeling, designing
flood discharge, drainage channel design and channel
dimensions. Precipitation is measured using the
estimated rainfall method. This data can be obtained
from rain stations located on the island of Tarakan.
After obtaining rainfall data, the next step is to
estimate runoff discharge that flows around the
landfill. Based on the results of measurements in the
field, the area of the Tarakan TPA site plan is planned
to be 40 ha. With this area of land, TPA is divided
into several waste cell zones.
Based on rainfall data, maximum rainfall
occurred in July 2014 with a magnitude of 601 mm /
month. Each of the maximum rainfall is used to
determine the amount of rainwater runoff. Based on
the results of the analysis, the types of channel used
are primary, secondary and tertiary with a square
channel shape. The maximum channel dimension is
1.6 x 1.6 m
2
with o.48m freeboard channel. The
minimum channel dimension is 0.3 x 0.3 m
2
with
0.1m freeboard channel. The flowrate of water in
Effective Urban Drainage for Juata Laut Landfill
189

channel maximum is 3.19 m/s and the minimum
flowrate is 1.43 m/s. The flowrate which exceeds 3
m/s can be reduced by terracing trap at channel so that
the flowrate can be reduced and erosion can be
minimized.
ACKNOWLEDGEMENT
This research was funded by CV Artha Gemilang
Consultant. The researchers would like to thank the
staff and the Ministry of Public Works for providing
data in the field and supporting the researchers and
the design of Tarata Laut TPA.
REFERENCES
Amien, S. 2011. Diseminasi dan Sosialisasi Keteknikan
Bidang PLP : Materi Bidang Drainase. Jakarta.
Arora, K., & Singh, V. P. 1989. A comparative evaluation
of the estimators of the log Pearson type LP 3
distribution. Journal of Hydrology, 105, 19–37.
Bhagat, N. 2017. Flood Frequency Analysis Using
Gumbel’s Distribution Method: A Case Study of Lower
Mahi Basin, India. Journal of Water Resources and
Ocean Science, 64, 51–54.
Gristlier, M. E. 1993. Subsurface Drainage Systems Design
and Drain Water Quality. Journal of Irrigation and
Drainage Engi¬neering, 1193.
Jensen, M. E. 1967. Nonsteady-State Drainage from Porous
Media. Journal of the Irrigation and Drainage
Division.
Kidson, & Richards. 2005. Flood frequency analysis:
assumptions and alternatives. Progress in Physical
Geography, 293.
Lin, S. dar. 2007. Water and Waste Water Calculations
Manual Second. McGraw-Hill.
Madani, A., & Brenton. 1995. Effect of drain spacing on
subsurface drainage performance in a shallow, slowly
permeable soil. Department of Agricultural
Engineering, 37.
Mursito, D., & Amien, S. 2011. Panduan Pengelolaan
Terpadu Sistem Drainase Perkotaan Berwawasan
Lingkungan Ecodrain. Jakarta: Kementerian Pekerjaan
Umum.
Otti, Ejikeme, & Nwafor. 2013. The Environmental Effects
of the Drainage System and Flood Control in Awka
Urban City. International Journal of Engineering and
Technology, 31.
Qaffou, A. 2017. Discriminating between Normal and
Gumbel Distributions. REVSTAT - Statistical Journal,
154, 523–526.
San, L. Y., Selamat, Z., & Ghani, A. A. 2009. Urban
Stormwater Drainage System Study using Numerical
Modeling. International Conference on Water
Resource.
Sangal, & Biswas. 1970. The 3-Parameter Lognormal
Distribution and Its Applications in Hydrology. Water
Resources Research, 62.
Shao, G., Wang, M., Yu, S., Liu, N., Xiao, M., & Yuan, M.
2015. Potential of Controlled Irrigation and Drainage
for Reducing Nitrogen Emission from Rice Paddies in
Southern China.
Journal of Chemistry.
Suripin. 2004. Sistem Drainase Perkotaan Yang
Berkelanjutan. Yogyakarta: CV. ANDI.
Utama, T. T., & Ardhianto. 2017. Fasilitasi Penyusunan
DED TPA Juata Laut. Tarakan: CV Artha Gemilang.
Valipour, M. 2012a. A Comparison between Horizontal and
Vertical Drainage Systems Include Pipe Drainage,
Open Ditch Drainage, and Pumped Wells in
Anisotropic Soils. IOSR Journal of Mechanical and
Civil Engineering IOSR-JMCE, 41.
Valipour, M. 2012b. Effect of Drainage Parameters Change
on Amount of Drain Discharge in Subsurface Drainage
Systems. IOSR Journal of Agriculture and Veterinary
Science, 14.
Yanto, A., Warman, H., & Hatta, U. B. 2014. Perencanaan
Saluran Drainase Kawasan Komplek
Perumahanbelimbing Kecamatankuranji Kota Padang
Sumatera Barat, 14.
Yeshoda, Meenambal, & Manikandan. 2015. Design of
Storm Water Drainage System to Enhance Ground
Water Level-A Case Study on Hosur Inner Ring Road
IRR. Bonfring International Journal of Industrial
Engineering and Management Science, 53.
BEST ICON 2018 - Built Environment, Science and Technology International Conference 2018
190
