
Hydrodynamic Modelling using Software of Mike21 in the Land
Reclamation of Jakarta Bay: Current Condition and Master Plan
Rahmad Agung Saputra
1
, Rizqi Abdi Perdanawati
1
and Rudy Akhwadhy
2
1,2
Faculty of Science and Tecnology Islamic University of Sunan Ampel Surabaya,,Jalan Ahmad Yani 117,Surabaya
2
Badan riset Sumber Daya Manusia, Kementrian Kelautan dan Perikanan, Jalan Pasir Putih I, Ancol, Jakarta
Keywords: Reclamation, Current, Jakarta Bay, Mike21.
Abstract:
Currently, the land reclamation of Jakarta bay as the manifestation of Presidential Regulation No.
25 of 1995 consists of 4 islands (Named: C (a half), D, G (a half), and N). The land reclamation
may cause effects and changes in water condition, especially in hydrodynamic condition.
Understanding on effects of reclamation is very important as an effort to manage coastal zone. This
research investigates the possible effects in tidal current at two conditions: current condition (4
islands) and master plan (17 islands). The analysis is divided into 3 areas: marine tourism area,
port area, and marine life area. The simulation used mike 21 with hydrodynamic module. The
simulation has shown that current dominantly goes to the west in highest sea level and dominantly
goes to the east in lowest sea level. The fastest current during north-west monsoon occurs in marine
tourism area. The fastest current during south-east monsoon occurs in marine biota area. Current
speed if master plan (17 islands) is implemented will be slower than current condition.
1 INTRODUCTION
Jakarta Bay is a part of Java sea located in the north
of DKI Jakarta, Indonesia. This bay is a shallow water
area with an average depth of 15 meters
(Coordinating Ministry for Coastal Integrated
Economic Development, Capital City, 2014).
Population density in DKI Jakarta is one of the factors
causing land shortages. Therefore, reclamation is
considered by the DKI provincial government to be
one of the choices to overcome this problem.
Reclamation in DKI Jakarta is the addition of 17
islands covering an area of 5,189 Ha (Agus, 2016).
Reclamation in the Jakarta Bay is feared to change
the flow pattern. Ocean currents play an important
role in the processes of biology, physics, and
chemistry that occur in the sea (Ismunarti, 2013). The
problems that occur in Jakarta Bay can be studied
with Mike21 software. In general, this software is
more friendly on graphic interfaces, easy to use /
simple, and able to be undone. It is very different from
similar software such as SMS (Surface
waterModeling System). This software is a collection
of several simulation modules to predict the rate of
sedimentation.
The purpose of this study is to determine the
current pattern before and after reclamation is
finished.
2 METHODS
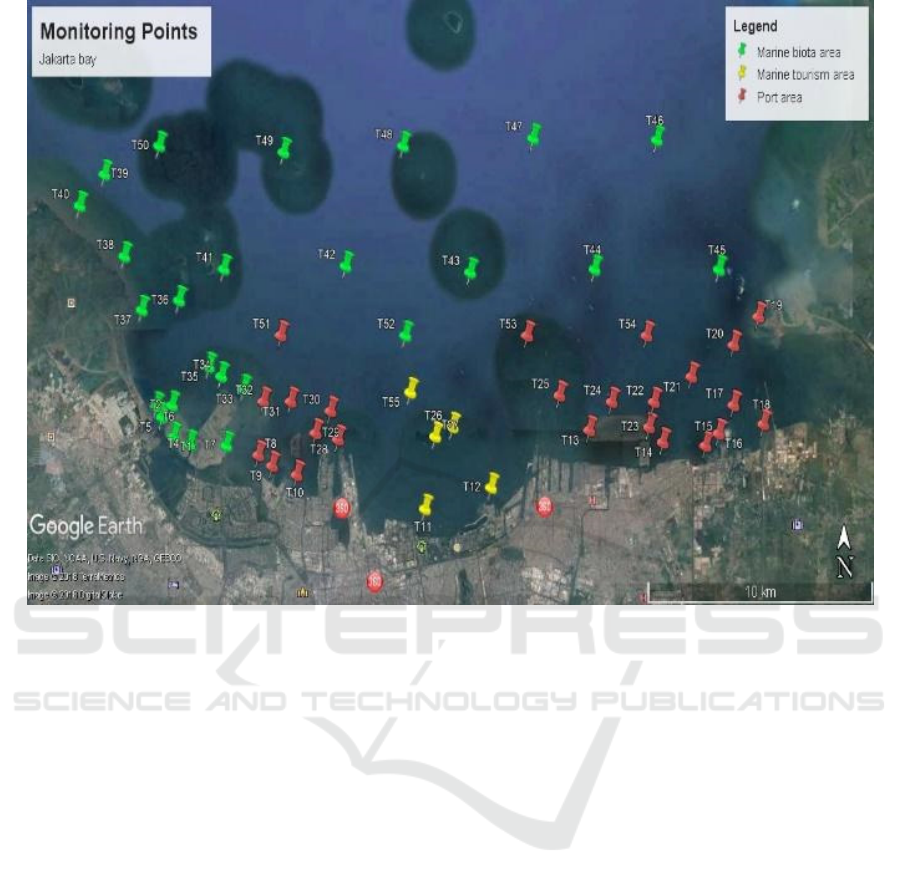
Research of hydrodynamic modelling in the Jakarta
Bay (figure 1A) was carried out for 6 months, from
January - March (west season) and from July -
September (east season). Modelling used Mike21
software with a Hydrodynamic module.
The monitoring point was based on the area that
entered the quality standard according to KEPMEN
LH No. 51 of 2004 which was then selected based on
field conditions. Based on the minister's decision, the
bay area of Jakarta is divided into 3 parts, namely:
marine tourism area, port area, and water biota area.
Tourist area was with 5 monitoring points, port area
was with 23 monitoring points, and water biota area
was with 25 monitoring points.
Saputra, R., Perdanawati, R. and Akhwadhy, R.
Hydrodynamic Modelling using Software of Mike21 in the Land Reclamation of Jakarta Bay: Current Condition and Master Plan.
DOI: 10.5220/0008907400002481
In Proceedings of the Built Environment, Science and Technology International Conference (BEST ICON 2018), pages 367-377
ISBN: 978-989-758-414-5
Copyright
c
2022 by SCITEPRESS – Science and Technology Publications, Lda. All rights reserved
367
The monitoring point was based on the area that
entered the quality standard according to KEPMEN
LH No. 51 of 2004 which was then selected based on
field conditions. Based on the minister's decision, the
bay area of Jakarta is divided into 3 parts, namely:
marine tourism area, port area, and water biota area.
Tourist area was with 5 monitoring points, port area
was with 23 monitoring points, and water biota area
was with 25 monitoring points.
2.1 Model Parameter
Model parameters used the Hydrodynamic module.
The hydrodynamic module was carried out in 3
different months, namely during the west season
starting from January to April 2016 and during the
east season starting from July 2016 to October 2016.
The results of the hydrodynamic module will provide
output in the form of current speed, current direction,
and water level elevation.
2.2 Model Design
Model area used was the Jakarta Bay area which
were divided into 2 models namely post reclamation
(figure 2) and master plan (Figure 3). In post
reclamation condition, there are reclaimed islands C
(half), D, G (half), and N. The depth in these
conditions ranges from -2 meters to -28 meters. In
the master plan, there are 17 reclamation islands as
shown above. The depth in this condition ranges
from -2 meters to -35 meters.
In the initial stages of modelling, the most
important part is the mesh editing process. Mesh
elements are automatically formed based on
predetermined coastline data and boundary
conditions. In this study, editing mesh (Figure 4) used
triangular meshing model with a minimum angle of
28 °. The area where meshing reclamation island will
be built is made increasingly tight so that the level of
accuracy is higher.
Figure 1: A. Research Location map
BEST ICON 2018 - Built Environment, Science and Technology International Conference 2018
368
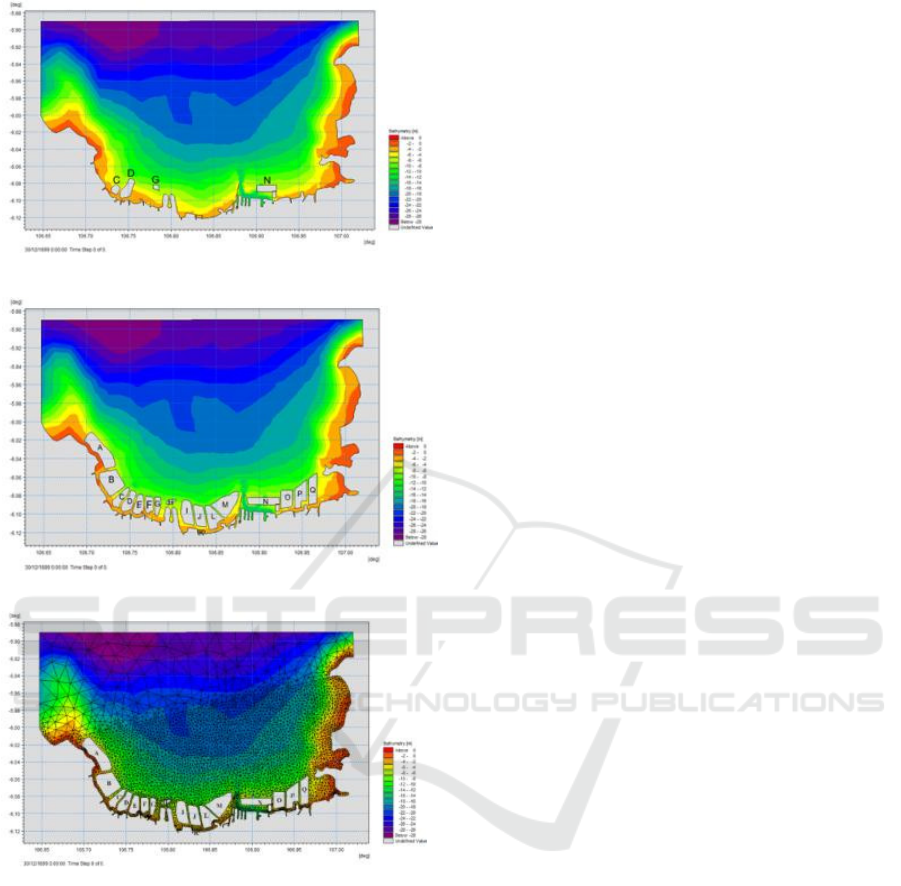
Figure 2. post reclamation of Jakarta Bay
Figure 3. post reclamation of Jakarta Bay
Figure 4. Meshing Model
3. RESULT
3.1 Wind
Wind data is needed to determine the distribution of
wind direction from the wind speed that occurs at the
research location. Wind data used were wind data
from 2013 to 2017 obtained from the Jakarta
Meteorology and Geophysics Agency (BMKG).
Wind speed and direction in Jakarta Bay from 2013
to 2017 predominantly came from the east with a
speed of 3.45 m / s. Wind speed and direction in
Jakarta Bay during western season were
predominantly originated from the east and northeast
with a speed of 3.85 m / s. Whereas during the east
season, the wind speed and direction in the Jakarta
bay predominantly came from the southeast with a
speed of 3.65 m/s.
3.2 Tide
Tidal predictions used NAOTIDE software and were
compared with observational data in the Jakarta Bay.
Tides in the Jakarta Bay are single daily type with
Formzahl number 5.97. The highest elevation is
0.45185 m, while the lowest elevation is -0.44238 m.
The validation and the tide observation resulted in an
RMSE value 0.00286. Small RMSE value indicates
that the tidal prediction value has a relatively small
error rate (Syahputra, 2016). This means that tidal
prediction data can be used.
3.3 Current
Current data used were measurement data from
BRSDM-KP which use ADCP (Acoustic Doppler
Current Profiler). Data were taken in June 2015 with
coordinates of -6.043011 ° LS and 106.734212 ° BT.
The current at the observation point was dominantly
from the northwest, which is consistent with the
research conducted by Aprilia (2017). The maximum
speed reached 12.07 m / s and the minimum speed
was 0.1 m / s, while the average speed was 4.843 m /
s. As for current speed validation, Jason-2 altimetry
satellite data was used (Aprilia, 2017). The RMSE
value of 0.023 was obtained. According to Syahputra
(2016), small RMSE value indicates that the value of
the model results has a relatively small error rate. This
means that the current model data from the Mike21
software can be used.
3.4 River Discharge
River discharge data used for input in this study were
data of average river discharge into the Bay of
Jakarta. Estuaries used included estuary BKT, Muara
Ancol, Muara Waduk Pluit, Muara Angke, and Muara
Cengkareng Drain. The biggest river debit was the
discharge from Angke estuary which was 26.71 m3 /
s, while the lowest estuary discharge was the BKT
estuary with 3.37 m
3
/s.
3.5 Hydrodynamic Modelling from
Post-Reclamation and Master Plan
Hydrodynamic modelling results were obtained from
the overview in the current pattern of Jakarta bay.
Hydrodynamic Modelling using Software of Mike21 in the Land Reclamation of Jakarta Bay: Current Condition and Master Plan
369
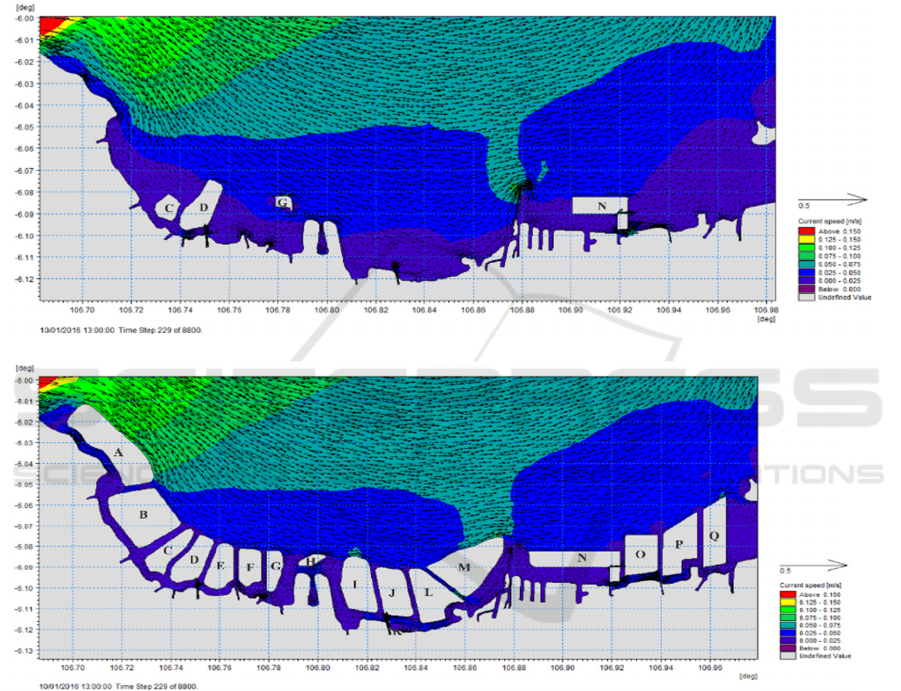
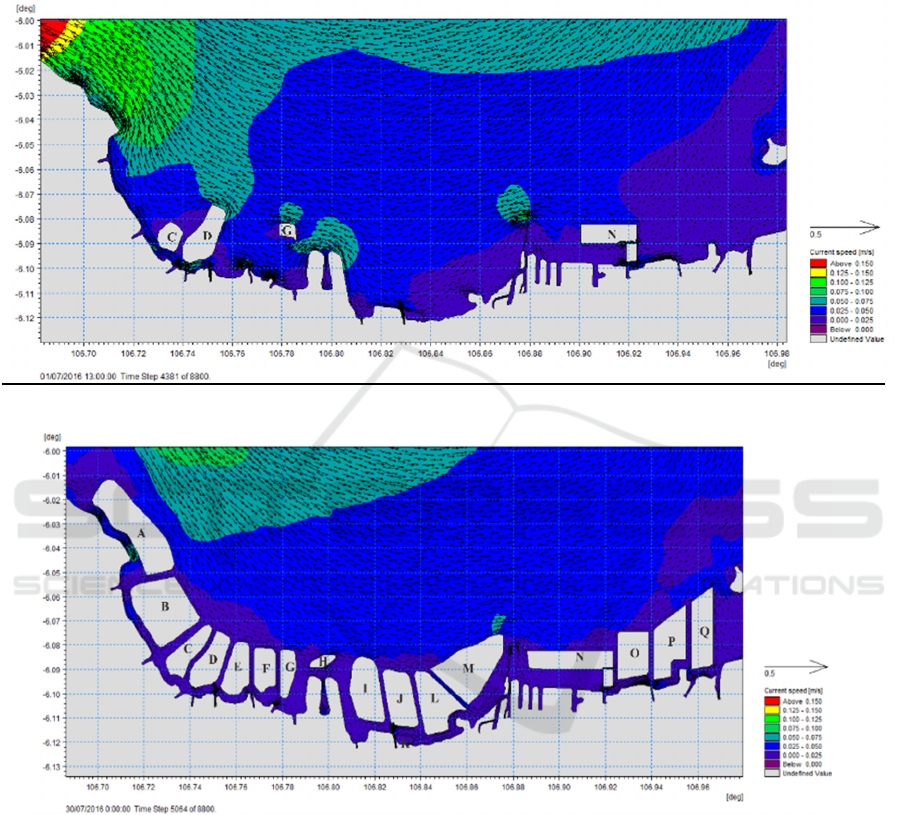
General description of the current condition after
recent reclamation at the highest tide in the bay of
Jakarta is dominantly towards the east and the
northeast (Figure 5.a). The smallest current velocity
is between 0 m / s - 0.098 m / s, while the biggest
speed is between 0.361 m / s - 0.427 m / s. Whereas
the current conditions if master plan is fully
implemented in the Jakarta bay are dominantly to the
eastward (figure 5.b). According to Bakrie (2017),
current patterns are influenced by wind direction and
wind speed, besides bathymetry profiles also affect
current patterns. The minimum current velocity is
between 0 m / s - 0.120 m / s, while the maximum
current is between 0.240 m / s - 0.360 m / s General
description of the post-reclamation condition when
the lowest ebb of the flow in the Jakarta bay
predominantly headed west can be seen in Figure 6.b.
Figure 5. Current pattern at the highest tide in the west season: a) post reclamation b) master plan
a
b
BEST ICON 2018 - Built Environment, Science and Technology International Conference 2018
370
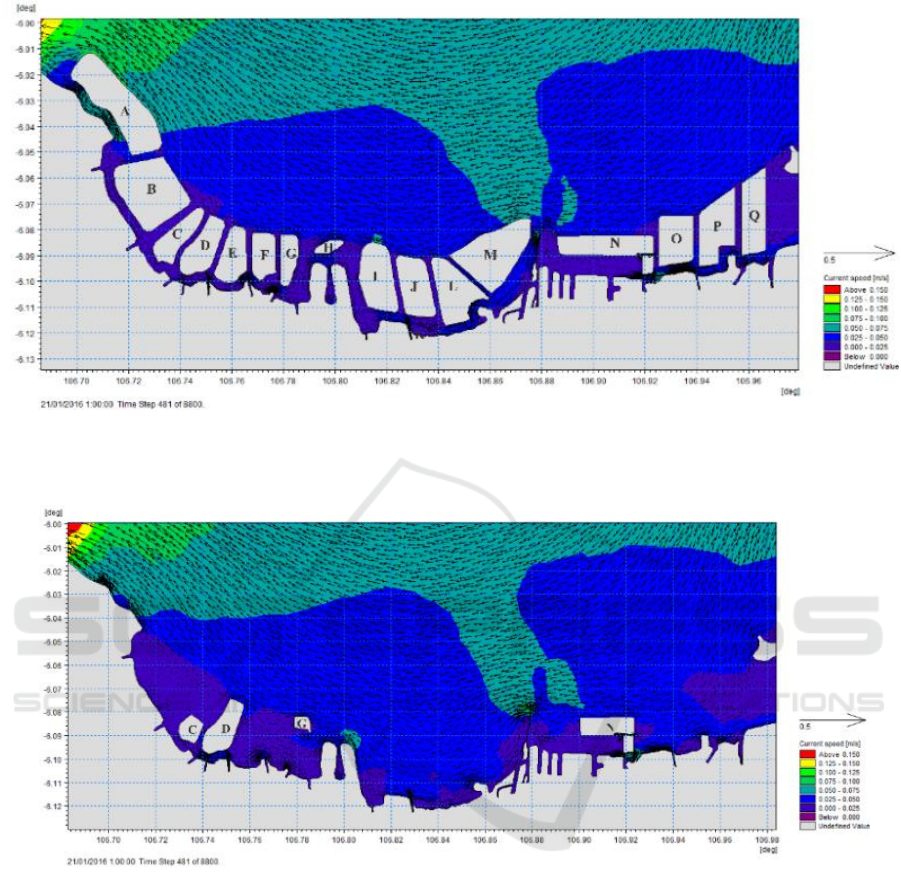
Figure 5. Currentpatternatthehighesttideinthewestseason:a)postreclamationb)masterplan
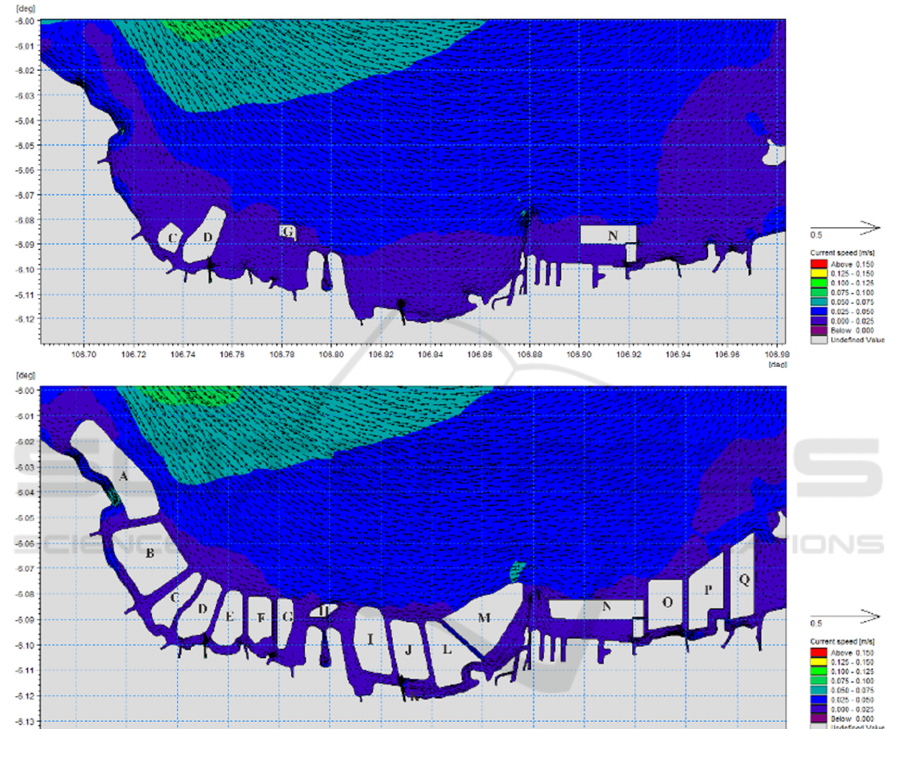
Figure6.Currentpatternatthelowesttideinthewestseason:a)postreclamationb)masterplan
This is directly proportional to the wind pattern
during the west season that is dominantly from east to
west. According to Bakrie (2017), current patterns are
influenced by wind direction and wind speed, besides
bathymetry profiles also affect current patterns. The
smallest current velocity is between 0 m / s - 0.096 m
/ s, while maximum current velocity was between
0.386 m / s - 0.483 m / s. The current pattern at the
lowest ebb tide in the Jakarta bay was dominantly to
the northwest - west (figure 6.b). This is because the
geographical location of the Jakarta Bay, between the
east end and the west end, is not parallel with the west
end and is slightly down south. The minimum current
velocity was between 0 m / s - 0.120 m / s, while the
maximum current was between 0.120 m/s - 0.240 m/s.
General description of post-reclamation flows
during the east season when the highest tides in the
Jakarta bay predominate towards the west and
northwest can be seen in Figure 7.b. This is due to the
wind coming from the southeast. According to Bakrie
(2017), current patterns are influenced by wind
direction and wind speed, besides bathymetry profiles
also affect current patterns. The smallest current
velocity was between 0 m / s - 0.151 m / s, while the
biggest speed was between 0.151 m / s - 0.302 m / s.
Figure 7 b is a general description of the
master plan condition during the east season when the
highest tide in the bay of Jakarta is dominantly
towards the west and the northwest. This is due to the
wind coming from the southeast. The smallest current
a
b
Hydrodynamic Modelling using Software of Mike21 in the Land Reclamation of Jakarta Bay: Current Condition and Master Plan
371
velocity was between 0 m / s- 0.149 m / s, while the
largest speed was between 0.148 m / s - 0.297 m / s.
Figure 7. Current pattern at the highest tide during the east season: a) post reclamation b) master plan
Figure 8.a shows general description of post-
reclamation current conditions in the east season
when the highest tide flows in the Jakarta Bay
predominantly head towards the east and the
northeast. This is due to the wind coming from the
southeast. The smallest current velocity was between
0 m / s - 0.151 m / s, while the biggest speed was
between 0.452 m / s - 0.603 m / s. Whereas Figure 8.b
is a general description of the current during the east
season when the lowest ebb flows in the bay of
Jakarta are dominantly towards the east and the
northeast.
This is due to the wind coming from the
southeast. According to Bakrie (2017), current
patterns are influenced by wind direction and wind
speed, besides bathymetry profiles also affect current
patterns.
The smallest current velocity was between 0 m / s
- 0.140 m / s, while the largest speed was between
0.560 m / s - 0.700 m / s.
a
b
BEST ICON 2018 - Built Environment, Science and Technology International Conference 2018
372
During the west season, the current dominantly
goes to the east, while when it recedes, the current is
dominantly to the west. This is due to the wind during
the dominant western season heading east. During the
east season, the current is dominantly towards the
west, while when it recedes, the current is dominantly
to the east. This is due to the wind during the east
season heading west. According to Bakrie (2017),
current patterns are influenced by wind direction and
wind speed, besides bathymetry profiles also affect
current patterns.
3.6
Hydrodynamic in The Marine Tourism
Area
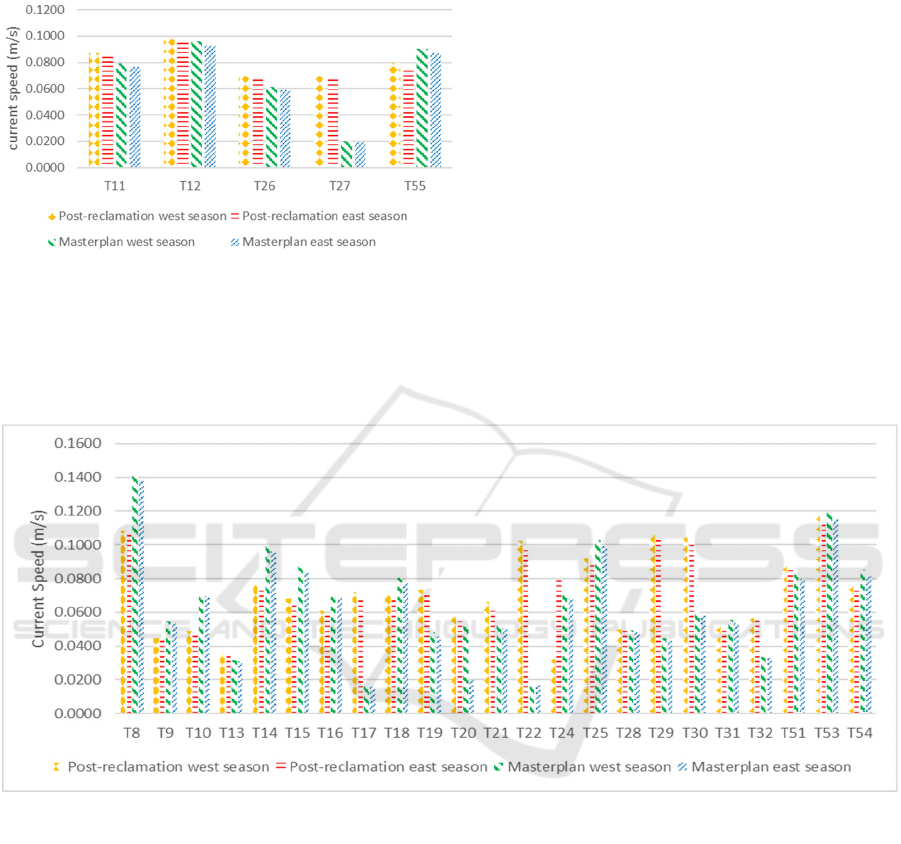
The maritime tourism zone includes Ancol Beach
area and Pantai Indah Kapuk. Figure 7 shows that
during the west season, the average current velocity
in the master plan condition experienced an
insignificant decrease compared to in the post
reclamation condition. This is because the point of
monitoring, that is in the marine tourism area, is far
from the reclamation island plan. Whereas during the
east season, the average speed in the aster plan
experienced an insignificant decrease compared to in
the post reclamation condition. However, at the
observation point 27, there was a significant
decreaseincurrentvelocity.
This is because the observation point 27 is between
the reclamation islands J and L and the distance
between reclamation islands J and L is relatively
narrow, so that the current speed slows down.
According to Kurniawati (2017), in the vicinity of
a
b
Figure 8.
Current pattern at the lowest tide during the east season: a) post reclamation b) master plan
Hydrodynamic Modelling using Software of Mike21 in the Land Reclamation of Jakarta Bay: Current Condition and Master Plan
373
reclamation islands there was a flow of currents
because of the obstructed landscape of the island and
because the area blocked by the reclamation island
had a small tendency.
Figure 9.
Currentconditioninthemarinetourism
are
a
3.7 Hydrodynamic in The Port Area
The Port Zone includes Tanjung Priok Port, Nizam
Zaman Port, Muara Baru, and Muara Kamal Port.
Figure 10 shows that during the west and east
seasons, average velocity in the master plan is smaller
than the current in the time of post reclamation. This
is because there were several monitoring points in the
port area which experienced a significant decline. At
the observation point 8 during the east and west
seasons, there was a significant change in current
patterns. This happened because in the pre and post
reclamation conditions, there was no reclamation
island, while in the condition of the master plan, the
current pattern changes because of the islands E and
F.
At the observation point 17 during the east and
west seasons, there was a significant change in
current patterns. This was because point 17 is
between the P and Q reclamation islands where the
distance between the two reclaimed islands is
relatively narrow so that it forms something like a
canal. At observation point 22 during the east and
west seasons, there was a significant change in
current velocity. This was because observation of
point 22 is at the end between N and O reclamation
islands. At observation point 29 during the east and
west seasons, there was a significant change in
current velocity. Meanwhile in the condition of the
master plan, the current tended to be slower than in
the post-reclamation condition. This happens because
point 29 affects the reclamation island F. At the
observation point 30 during the east and west seasons,
there was a change in the flow velocity due to the
reclamation island H.
In the port area, the current has been weakening
since the reclamation started. This is because the
Figure 10.
Currentconditionintheportarea
BEST ICON 2018 - Built Environment, Science and Technology International Conference 2018
374
currents that hit the reclamation island cause small
currents. According to Kurniawati (2017), in the
vicinity of reclamation islands there was a flow of
currents because of the obstructed landscape of the
island and because the area blocked by the
reclamation island had a small tendency.
3.8
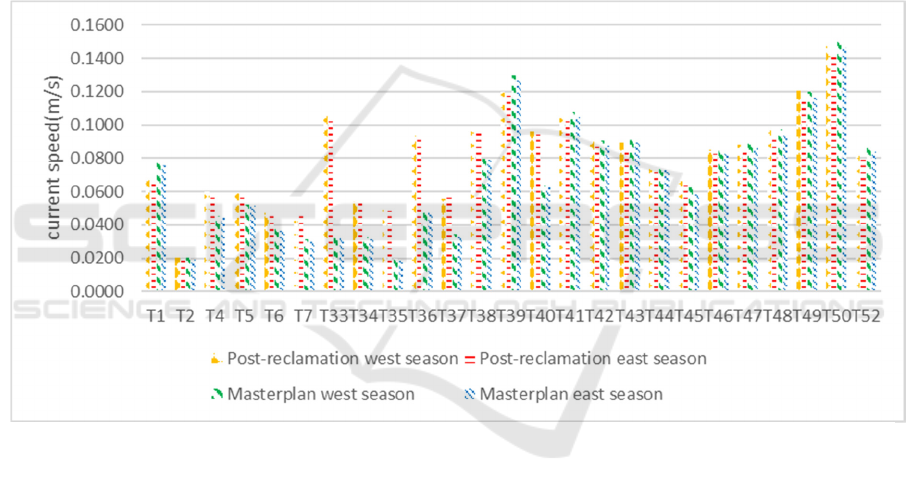
HydrodynamicinTheMarineBiotaArea
Marine biota zones cover zones where the marine
biota lives. Figure 11 shows that during the west and
east seasons, average velocity in the master plan
condition is smaller than the current at the time of post
reclamation. This was because there are several
monitoring points in the port area which experienced
a significant decline. At the observation point 33
during the east and west seasons, there was a
significant change in speed and current pattern. This
is because the observation point 33 is at the end
between reclaimed islands D and E. At the
observation point 35 during the east and west seasons,
there was a change in the current pattern. This
happened because of the reclamation islands B and C.
At the observation point 36 during the east and
west seasons, there was a change in the flow velocity
due to the reclamation of islands A and B so that the
current velocity becomes weak.
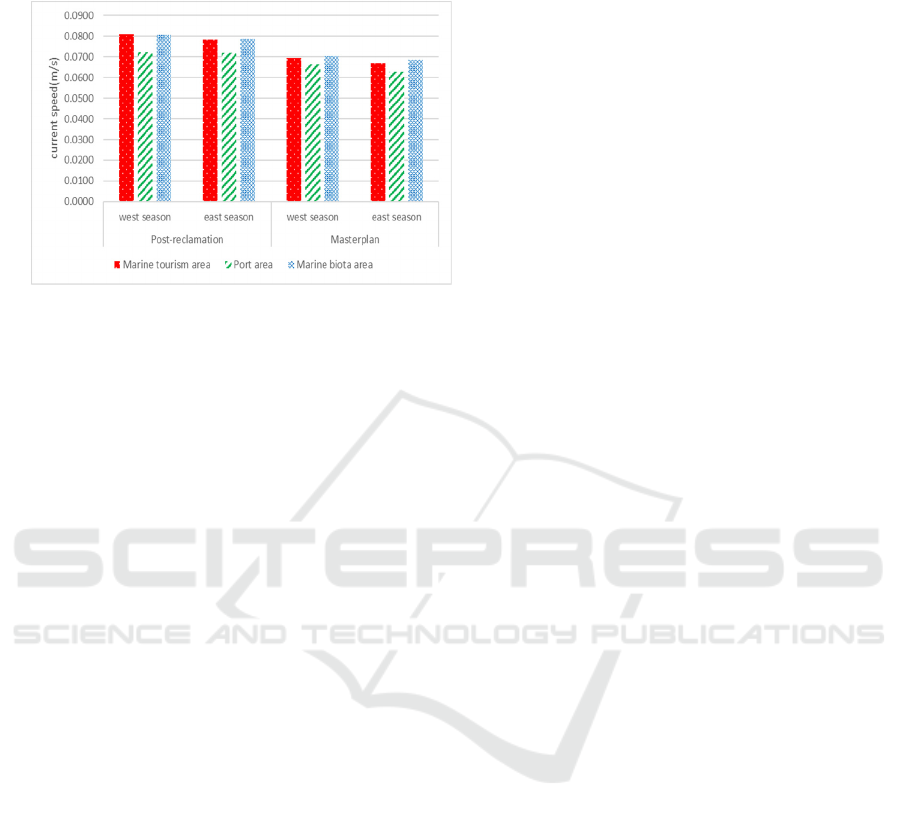
3.9 Hydrodynamic in Any Area
Figure 12 shows during the west season, the velocity
of currents in the maritime tourism zone is greater
than it is in the port area and marine biota area.
Whereas during the east season, the current velocity
in the marine biota area is greater than it is in the
marine tourism area and port area.
At the observation point 37 during the east and
west seasons, there was a change in the flow pattern
due to the reclamation islands A and B. At the
observation point 38 during the east and west seasons,
there was a change in the current pattern. This
happened because of the reclamation island A, the
current speed at point 38 becomes slower because the
point is along the coast and adjacent to the
reclamation island A.
In the area of marine biota, the current has been
weakening since the reclamation process started. This
is because the currents that hit the reclamation island
cause small currents. According to Kurniawati
(2017), in the vicinity of reclamation islands there is
a flow of currents due to blocked islands and the area
blocked by reclaimed islands that has a small
tendency.
The decrease in current velocity occurs along with
the reclamation island. According to Kurniawati
(2017), in the vicinity of reclamation islands there is
a deflection of the flow because it is blocked by the
Figure 11. Current condition in the marine
b
iota area
Hydrodynamic Modelling using Software of Mike21 in the Land Reclamation of Jakarta Bay: Current Condition and Master Plan
375
span of the island and the area blocked by the
reclamation island has a small tendency.
Figure 12. Current condition any area
3.10 Impact of Changes on Current
Patterns
The impact of changes on current patterns caused by
reclamation is very influential to the physical,
chemical and biological activities that occur at sea.
According to Ismunarti (2013), ocean currents play
an important role in the processes of biology, physics,
and chemistry that occur at sea. In addition, the
weakening of the current will also result in high
sedimentation rates. According to Miftachurraazaq
(2017), if the flow is faster, the sediment
concentration will decrease, whereas if the current is
weak, the sediment concentration will increase.
4 CONCLUSIONS
Current modelling results of marine tourism areas
current velocity in post-reclamation conditions
during the western season is greater than it is in
master plan conditions. The current velocity in port
area in post-reclamation conditions is greater than it
is in the master plan conditions, while in the marine
biota area, the current velocity in post-reclamation
conditions is greater than it is in the master plan
condition. Whereas during the eastern season, the
current velocity of the marine tourism area in the
post-reclamation condition is greater than it is in the
master plan condition. Current velocity of the port
area in the post-reclamation condition is greater than
it is in the master plan condition, and in the marine
biota area, the current velocity in the post-reclamation
condition is greater than it is in master plan condition.
This is caused by the bending of the current due to the
reclamation island so that the current becomes small.
During the west season, current speed of the
marine tourism area is faster than those of the port
area and marine biota, while during the east season,
the current Speed in the marine biota area is greater
than it is in the marine tourism area and port area.
ACKNOWLEDGEMENTS
I would like to thank BRSDM-KP for supplying data
and making software mike21. I also want to show my
gratitude to BMKG Jakarta for supplying data, and to
Islamic University of Sunan Ampel Surabaya for
permission to use laboratory of computer to run this
software.
REFERENCES
Agus Setiawan. 2016. Technical Report on the Field of
Hydrodynamics and Geomorphology of the
Reclamation Activity Study Team. BalitbangKP.
Jakarta.
Aprilia, Evasari. 2017. Three-Dimension Hydrodynamics
Modelof Sedimentation Distribution Pre and Post
Reclamation Jakarta Bay. Final Assigment
Departement of Geomatics Engineering. Faculty of
Civil Engineering. Institut Teknologi Sepuluh
Nopember. Surabaya
Bakrie, D D. 2017. Evaluation of Trophic State with
Modelling of Mike 21 Ecolab and Mitigation Strategies
in Jakarta Bay. Thesis postgraduate Program Faculty
Engineering. Universitas Indonesia. Depok
Ismunarti, Dwi H. 2013. Study of Flow Patterns in the
Waters of West Nusa Tenggara and their Simulations
Using a Mathematical Model Approach.
Oceanographic Study Program, Majoring in Marine
Science, Faculty of Fishery and Marine Science.
Diponegoro University. Bulletin Journal of
Oceanography Marina July 2013. vol. 2 page 1 - 11
Kepmen LH No 51. 2004. Sea Water quality standards.
State Minister of Environment.
Kurniawati. D S. 2017. Modelling Analysis of Tss
Distribution and Its Impact to Phytoplankton in Jakarta
Bay. Thesis postgraduate Program Faculty
Engineering. Universitas Indonesia. Depok
Miftachurrazaq, Izhad. 2017. Modeling of Sediment
Distribution to Analysis the Impact of Reclamation to
The Shallowing of Benoa Bay. Final Assigment
Departement of Geomatics Engineering. Faculty of
Civil Engineering. Institut Teknologi Sepuluh
Nopember. Surabaya
Perekonomian, K, K. 2014 . Integrated Development of the
State Capital Coast, Jakarta.
Syahputra, Hendry. 2016. Comparative Analysis of the
Accuracy of the Tidal Prediction Model: A Case Study
in the Larantuka Strait, East Flores, East Nusa
BEST ICON 2018 - Built Environment, Science and Technology International Conference 2018
376

Tenggara. Journal of oceanography program, Faculty of
Fishery and Marine Science, Diponegoro University.
Semarang.
Hydrodynamic Modelling using Software of Mike21 in the Land Reclamation of Jakarta Bay: Current Condition and Master Plan
377
