
Optimization of Autoregressive Integrated Moving Average
(ARIMA) for Forecasting Indonesia Sharia Stock of Index (ISSI)
using Kalman Filter
Luluk Wulandari
1
, Yuniar Farida
1
, Aris Fanani
1
And Mat Syai’in
2
1
Departement of Mathematics, UIN Sunan Ampel Surabaya, Jl A.Yani 117, Surabaya
2
Departement of Electrical Engineering, Politeknik Perkapalan Negeri Surabaya, Jl Campus ITS Keputih Sukolilo,
Surabaya
Keywords: Indonesia Sharia Stock of Index, Autoregressive Integrated Moving Average, Artificial Neural Network,
Kalman Filter
Abstract: Forecasting stock price index is an important thing, because it can describe the state of stock price index going
forward. It can be a consideration for a company's investors to determine the decision in selling, buying, or
holding its stock. This research aims to find out an optimal model that can be used to forecast ISSI using
ANN and ARIMA model. The optimal model was analyzed from the smallest RMSE and MAE results. The
results of this research show that ANN (12,12,1) is more optimal than ARIMA (2, 1, 2) with values of MAE
= 0.59143 and RMSE = 0.58705. Then, ARIMA model will be improved using Kalman filter method, showing
that the residual value is very small with the RMSE value of 3.8693e-08. The RMSE value from the
forecasting results using ARIMA – Kalman Filter is much smaller than the RMSE of ANN. Thus, it can be
concluded that the ARIMA Kalman Filter method is more optimal than ANN in forecasting ISSI.
1 INTRODUCTION
Stock are securities traded in the capital market
indicating a capital ownership of an enterprise. In this
era, stock investment has become one of choices to
develop finance, because it will provide a big
advantage for investors. Ownership of stocks of a
company indicates that the owner of the stocks are
entitled to get advantages from developing business
by the company, and risked to endure a loss if a
company go bankrupt, increase and decrease of stock
price index into consideration for a company's
investors. Forecasting stock prices index in the stock
market is important to do. Because forecasting stock
price index can describe the stock price index in the
future. Indonesia Sharia Stock of Index (ISSI) is
stocks traded in the capital market of sharia. Capital
market sharia is part of the Indonesian capital
market.Generally, all activities in the capital market
sharia are similar to those in the Indonesian capital
market. However, the characteristics of capital
market sharia is product and transaction process
which does not not contradict with sharia principles
in the capital market (OJK, 2016). ISSI is rice set
from all sharia stock in Indonesia Stock Exchange.
Recently, there are 331 Sharia Stocks (Respati, 2017).
Stock price index as time series data are non-
stationary, non-linear, highly noisy and contains
uncertainty. This is because the stock market is
affected by many factors, such as traders’
expectations, general economic conditions and
political events. So, forecasting stock requires the
right approach.
There have been several studies related to stock
forecasting in the capital market, among others are
Rio Bayu Afriyanto who forecasted stock price using
the Neural Network method (Afrianto, Tjandrasa, &
Arieshanti, 2013). In this study, it is known that the
forecast are good, indicated by the accuracy level up
to 62.18%. Imam Halimi and Wahyu Andhyka
forecasted stock price index using a Neural Network
algorithm (Halimi & Kusuma, 2018). Amin Hedayati
Moghaddama and his partner forecasted stock price
index using Neural Network algorithm
(Moghaddama, Moghaddamb, & Esfandyari, 2016).
This research obtained a value of
of 0.9408.
Mohammed M Mustofa, forecasted stock price
movements using the Neural Network method
Wulandari, L., Farida, Y., Fanani, A. and Syai’in, M.
Optimization of Autoregressive Integrated Moving Average (ARIMA) for Forecasting Indonesia Sharia Stock of Index (ISSI) using Kalman Filter.
DOI: 10.5220/0008906900002481
In Proceedings of the Built Environment, Science and Technology International Conference (BEST ICON 2018), pages 295-303
ISBN: 978-989-758-414-5
Copyright
c
2022 by SCITEPRESS – Science and Technology Publications, Lda. All rights reser ved
295

(Mustofa, 2010). Muzakir forecasted the magnitude
of earthquake using Neural Networks in time series
data (Sultan, 2014). Jordan Grestandhi et.al analyzed
the OLS-ARCH and ARIMA method to predict the
stock price index (Jordan Grestandhi et al, 2011).
Bayu Ariestya Ramadhan analyzed the comparison of
ARIMA and GARCH methods to forecast stock
prices (Ramadhan, 2015). Ahmad Sadeq forecasted
stock index using ARIMA method (Sadeq, 2008).
The results of this forecasting are accurate with
MAPE 4.14%. Chintya Kusumadewi forecasted the
Indonesia stock market price index using the ARIMA
and Genetic Programming (Kusumadewi, 2014). In
this research, the MAPE value is smaller compared to
using the ARIMA method only, which is
1.181192667%. Ping-Feng Pai and Chih-Sheng Lin
combined ARIMA and Support Vector Mechine
(SVM) methods to forecast stock price (Ping-Feng
Pai and Chih-Sheng Lin, 2005). Nurissaidah
Ulinnuha and Yuniar Farida forecasted the weather
using ARIMA – Kalman Filter (Ulinnuha & Farida,
2018). In this research, it is known that the ARIMA
kalman filter method is optimal for forecasting, with
MAPE value of 0.000389.
From several studies above, most of the ANN
methods are proven to be more optimal when
compared to statistical methods such as ARIMA. This
is because ARIMA models cannot identify nonlinear
patterns of data (Shukur, 2015). So, the results of
forecasting by ARIMA model must be increased
using other methods, such as Kalman Filter. The
Kalman Filter approah is used as an optimal solution
for many data tracking and predictions, because the
Kalman filter reduces noise and obtains correct data
(Hairong Wang et al, 2017). So, in this research, the
results of ARIMA forecasting were improved by
using Kalman Filter to obtain a more optimal
forecasting result and compare it with the ANN
method.
2. THEORITICAL FRAMEWORK
2.1 Indonesia Sharia Stock of Index (ISSI)
ISSI is index of stock that covers all sharia stock in
Indonesia and registered in Indonesia Stock
Exchange. The difference between ISSI and stock in
general is that the implementation of ISSI does not
violate religion. Stocks of Sharia have some criteria.
They are:
1. Activities carried do not violate Islamic religious
law. They are :
a) Everything that belongs to gambling
b) Trade is prohibited sharia
c) Based financial services of usury (riba)
d) Traded risks contain uncertain elements or
gambling
e) Producing, distributing, trading and providing
illicit goods or services that defined by DSN-
MUI
f) Transactions carried contain elements of
bribery
2. Confirm of financial ratios. They are :
a) Total money based on interest compared to
total assets not exceeding 45%
b) Total interest income and other haram income
compared to total business income and other
income not exceeding 10%
2.2 Time Series Analysis
Time series data are some data from a specific
variable successive in each period, for example daily,
weekly, monthly, yearly and etc. Time series data are
important to predict next occurrences. because it is
known that multiple data patterns of the past will be
repeated in the future. Any observations made can be
expressed in random variables
which is obtained
on a certain time index
, with
. so, from time series, data can be
written with
2.3 Stationary Test of Time Series Data
Stationary data is when the data pattern is at
equilibrium around the constant mean and the
variance around average which is is constant for some
time (S. Makridakis, S. C. Wheelwright, and V. E.
McGee, 1999). The data that are not stationary
against variance, it must be transformed by the Box-
Cox transformation method (G. E. P. Box, G. M.
Jenkins, and G. C. Reinsel, 2013). The formulation is
as follows:
with λ is transformation parameter,
is
transformation data,
is Observation at time t
If the data are not stationary on mean, it is
necessary to do differencing. Backward shift operator
is very appropriate to describe the differencing
process (S. Makridakis, S. C. Wheelwright, and V. E.
McGee, 1999). The use of backshift is as follows :
(2)
BEST ICON 2018 - Built Environment, Science and Technology International Conference 2018
296

with
is observation value at t;
is observation
value at t-1; B is Backshift.
If there is differencing until the the
equation becomes:
(3)
2.4 Autocorrelation Coefficient Function
(ACF)
The autocorrelation coefficient is a determinant of
data basic pattern identification (L. Arsyad, 1995).
The stationary process of a time series (
) is
obtained from
and
which are constant and covariance
Based on the autocorrelation
coefficient between
and
for lags k as follows:
(4)
The autocovariance function between
and
for
lag k is as follow :
) (5)
is autocovariance function, for stationary state
. So, the equation (4)
and (5) become :
(6)
(7)
2.5 Partial Autocorrelation Coefficient
Function (PACF)
Partial autocorrelation is used to determine the
correlation between
and
, if the effect of
time is considered separate.
The formulstion is as follows :
(8)
2.6 Autoregressive Integrated Moving
Average (ARIMA) Model
The ARIMA model is a model used for forecasting
time series data that tend to be stationary. ARIMA
model is a combination of AR (p) and MA (q) models
with differencing data (d).
Formulation AR (p) model is:
(9)
Equation (9) using operator B (backshift):
(10)
with :
Formulation of MA (q) model is:
(11)
Equation (11) using operator B (backshift):
(12)
with :
Formulation of (ARMA) model is :
(13)
Equation (9) using operator B (backshift):
(14)
ARIMA Model is a combination of ARMA (p, q)
and differencing (d) models. Formulation of ARIMA
(p,d,q) model is :
(15)
with :
with
is AR factor (p);
is MA factor (q);
is order differencing.
2.7 Artificial Neural Network (ANN)
ANN is a method formed from the awareness of a
complex learning system in the brain which consists
of several sets of neurons that are closely related.
ANN have 3 main types, namely multilayer
perceptron, radial basic function and kohonen
network (J Hair & R.Anderson, 1998). The layers of
the ANN compiler are divided into 3 parts, namely
Optimization of Autoregressive Integrated Moving Average (ARIMA) for Forecasting Indonesia Sharia Stock of Index (ISSI) using Kalman
Filter
297

input layer, hidden layer and output layer (Sutojo T,
et al, 2010). ANN applies the activation function to
limit the output of the neuron to match output value
specified. There are 4 kinds activation functions,
namely:
a) Linear activation function, the formulation is :
(16)
b) Bipolar activation function, the formulation is :
(17)
c) Sigmoid Binner activation function, the
formulation is :
(18)
d) Sigmoid Bipolar activation function, the
formulation is :
(19)
2.8 Backpropagation
The Backpropagation algorithm uses an error output
to change the weight value in the backward (J. J.
Siang, 2005). Suppose given n different data inputs
that are connected to the output
data
( = 1,2, ..., ), the interpolation of ANN is:
(20)
with
is variable input ,
is output layer value,
is index of input,
is weight of the neuron in the
input layer leading to the hidden layer,
is bias
from the neuron at hidden layer,
is activation
function of the neuron in the hidden layer,
is
weight of the neuron j in the hidden layer that leads
to output layer,
is bias on the output layer, and
is activation function in the hidden layer.
The steps of the training algorithm for the ANN
are as follows:
a) Initialize of weights
b) Repeat steps until the iteration conditions
are appropriate.
c) For each pair of training data, do steps
Feedforward Algorithm :
d) Input unit
receives an input
signal
and the signal is forwarded to the next
section units.
e) Calculate all outputs in the hidden layer
(21)
Calculate activation function
hidden layer
(22)
f) Calculate all outputs at the output layer
(23)
Calculate the activation function
at the output
layer :
(24)
Backpropagation Algorithm :
g) Each output layer
accept the
target pattern (
) according to the input pattern
and calculate the error value (
)
(
(25)
The usual activation function is sigmoid then
, The formula is :
(
=
(26)
Equation (25) is substituted to equation (26)
obtained :
(27)
h) Calculate the change of weight
with the
learning .
i) Calculate the factor δ based on errors in each
hidden layer
(28)
(29)
Change of weight
use learning α.
BEST ICON 2018 - Built Environment, Science and Technology International Conference 2018
298

j) Output layer
is updated.
After deriving the Gradient Descent algorithm,
two equations are used to update the weights of
Updating the weights and bias on the Output Layer:
(30)
=
(31)
Updating the weights and bias on the Hidden Layer:
(32)
=
(33)
2.9 Kalman Filter
Kalman filter is one of the very optimal estimation
methods. Transition and measurement equations are
the basic components of applying the Kalman filter
method. Improved estimation results are based on
measurement data.
Estimate polynomial coefficients
and
with
the following model equation:
(34)
This estimate will take the value n = 2. So,
equation (34) changes to :
(35)
With :
and
,
is matrix system, is input value of iterasi, is
covariance matrix, is covariance matrix R;
is
initial value of input
;
is initial value of input
.
Find for values from noise with random ones
normal distribution.
System Model :
(36)
(37)
Measurement model :
(38)
(39)
Estimastion value :
(40)
Covariance value :
(41)
Correction Step :
Kalman gain value :
(42)
With and to get correction value from
and
using the formulation as follow :
=
(43)
Forecasting value :
(44)
3. RESEARCH METHOD
3.1 Data and Research Variable
The data used in this research are ISSI data sourced
from the Indonesian Stock Exchange. The data used
are daily close index data for the period of July 2017
to May 2018 amounting to 340 time series data, in
which 310 data are used as trainning data and 30 other
data as testing data.
3.2 Analysis Method
Forecasting was conducted using ARIMA method
with the following step :
a) Data stationary test
b) Identification of the model that is considered most
appropriate by calculating and testing the ACF
and PACF of correlogram.
c) The model estimation step of the parameters in the
model.
d) Calculates the values of RMSE and MAPE
e) Analysis of model compatibility with p-value
f) Use of models for further forecasting.
Optimization of Autoregressive Integrated Moving Average (ARIMA) for Forecasting Indonesia Sharia Stock of Index (ISSI) using Kalman
Filter
299
Forecasting using ANN method with the following
step :
a) Determine the number of parameters tested
which affect the output value
b) Determine the number of hidden layers
c) Determine the activation function
d) Evaluate the selection of the optimal model
using RMSE and MAE
e) Use models for further forecasting
Determination of the optimal model of both models
by selecting the value of MAE and RMSE smaller
value.
4 RESULT AND DISCUSSION
Before forecasting using ARIMA and ANN, it is
necessary to know descriptive statistics from the data
used in the research, shown in table 1.
Table 1 : Descriptive Statistic Data of Research
N
310
Minimum
173,247
Maximum
199,614
Mean
18,658,976
Std Deviation
4,738,130
4.1 Forecasting ISSI using ARIMA
First step in ARIMA method is Stationary test. In fact,
ISSI data are not stationary. Figure 1 is a graph of the
stationary data test results.
Figure 1: Graph of ACF non-stationary data
Based on the ACF graph, it appears that the ACF
graph decreases slowly to zero. This means that the
data are not stationary towards the mean.
Figure 2: Graph of PACF non-stationary data
Based on the partial graph ACF (PACF), it appears
that after lag 1, the graph is not significantly different
from zero. From the graph analysis of ACF and
PACF, it is found that the data are still not stationary
towards the mean. So, the data should be transformed
using differencing. The result of differencing data on
figure 3 indicates that the data are stationary.
Figure 3: Stationary PACF graph
After the data pattern test process, it was found
that with differencing 1, the data were stationary. The
next step is estimation of the model for forecasting
ISSI. The model used is ARIMA (p, d, q), where p is
the order of AR model, d is differencing data, q is
order of MA. In this research some ARIMA models
will be formed with orders (1,1,1), (2,1,1), (2,1,2),
(1,1,2), (1,1,3), (2,1,3).
The model of ARIMA (1,1,1) is :
The model of ARIMA (2,1,1) is :
BEST ICON 2018 - Built Environment, Science and Technology International Conference 2018
300

The model of ARIMA (2,1,2) is:
The model of ARIMA (1,1,2) is :
The model of ARIMA (1,1,3) is:
The model of ARIMA (2,1,3) is:
From the some model of ARIMA above, P-Value,
RMSE, MAPE and MAE were found to determine the
results of the model accuracy. It shows that ARIMA
with orders (2,1,2) is the most optimal model
compared to other models. Table 3 shows the P-
Value, RMSE, and MAE of ARIMA (2, 1,2).
Table 3: P-Value, RMSE and MAE of ARIMA (2,1,2)
Model
P-Value
RMSE
MAE
(2,1,2)
Constanta
0,751
1,080
0,700
AR(1)
0,000
AR(2)
0,000
D
1
MA(1)
0,031
MA(2)
0,0279
4.2 Forecasting ISSI using ANN
Forecasting ISSI using ANN consists of 4 activation
functions types namely semi linear, Bipolar Sigmoid,
Sigmoid and Hyperbolic Tangent which are used in
processing data from input to the hidden layer. From
several inputting neuron values from input layer,
hidden layer, and output layer by using 4 activation
functions, the optimal model will be obtained from
RMSE and MAE. In this research some ANN models
will be formed. Those are (4,4,1), (12,12,1), (8,10,1),
(4,8,1) . The best model of ANN is input layer = 12,
hidden layer = 12 and output layer = 1 and using
bipolar sigmoid of activation function. The MAE and
RMSE results of ANN are presented in table 2.
Table 2 : The results of MAE and RMSE of ANN
Neuron
Activation
Function
MAE
RMSE
12/12/2001
Linear
44,672
371,445
Sigmoid Binner
0,7958
118,747
Bipolar
Sigmoid
0,5914
0,58705
Hyperbolic
Tangent
0,7803
0,92354
4.3 The Comparison of Forecasting using
ARIMA and ANN
From the results of forecasting using these two
methods, it is known that the best model uses ARIMA
(2,1,2) and ANN (12,12,1). The best model of
forecasting ISSI is by comparing RMSE and MAE
from the two models. Table 4 presents the results of
the comparison.
Table 4 : Comparison of RMSE and MAE of
ARIMA(2,1,2) and ANN (12,12,1)
Model
RMSE
MAE
ARIMA (2,1,2
1,08000
0,70000
ANN (12,12,1)
0,58705
0,59143
From table 4 above, it is known that the best model is
forecasting using ANN method with input layer 12,
hidden layer 12 and layer 1 output. It is proved by the
RMSE and MAE values that are smaller than the
ARIMA model (2,1,2).
4.4 Improvement of ARIMA Method
Using Kalman Filter
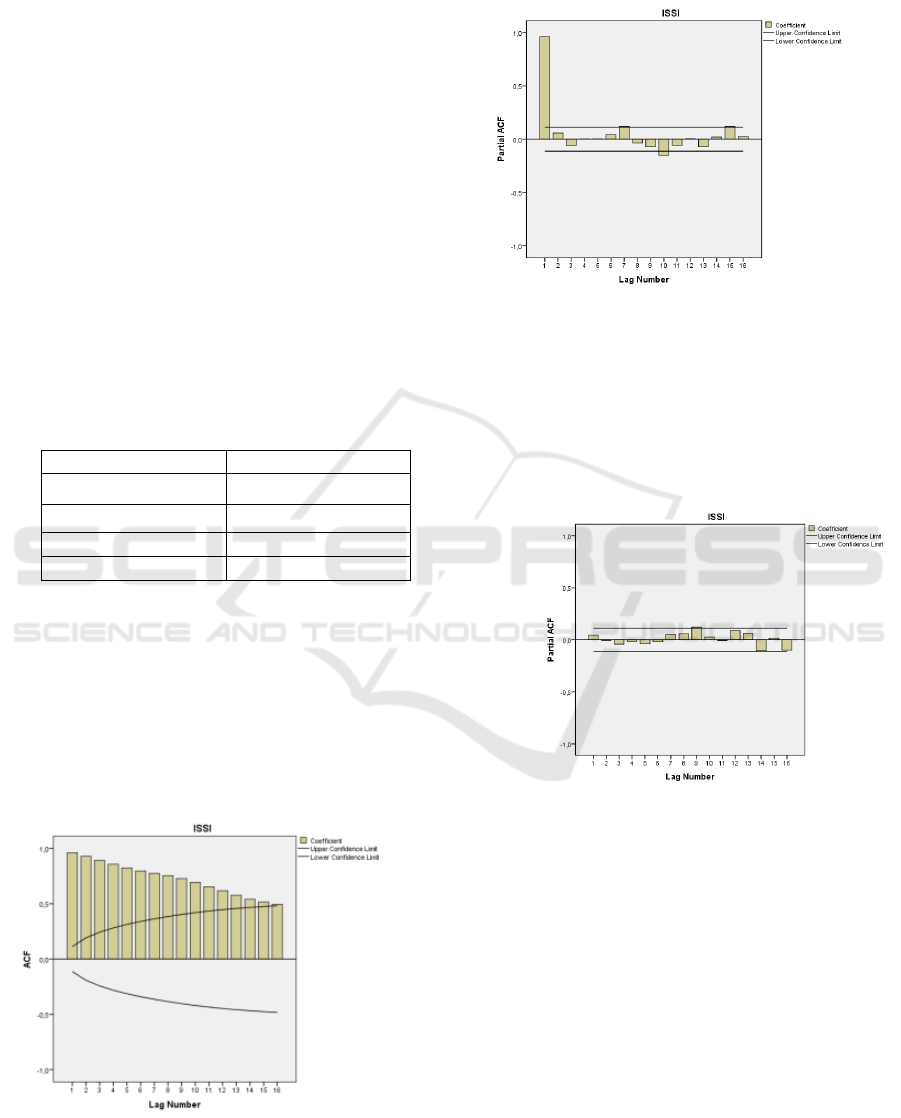
From the results of forecasting, ISSI using ARIMA
method has a high residual value. So, it must be
improved using the Kalman filter method.
Comparison of Actual Data, ARIMA and ARIMA –
Kalman Filter is shown in figure 4.
Based on fig.4, it is known that the residual
value is very small with RMSE value of 3.8693e-08.
The RMSE value from the forecasting results using
ARIMA – Kalman Filter is much smaller than the
RMSE value of ANN. Thus, it can be concluded that
the ARIMA Kalman Filter method is more optimal
for forecasting ISSI.
Optimization of Autoregressive Integrated Moving Average (ARIMA) for Forecasting Indonesia Sharia Stock of Index (ISSI) using Kalman
Filter
301
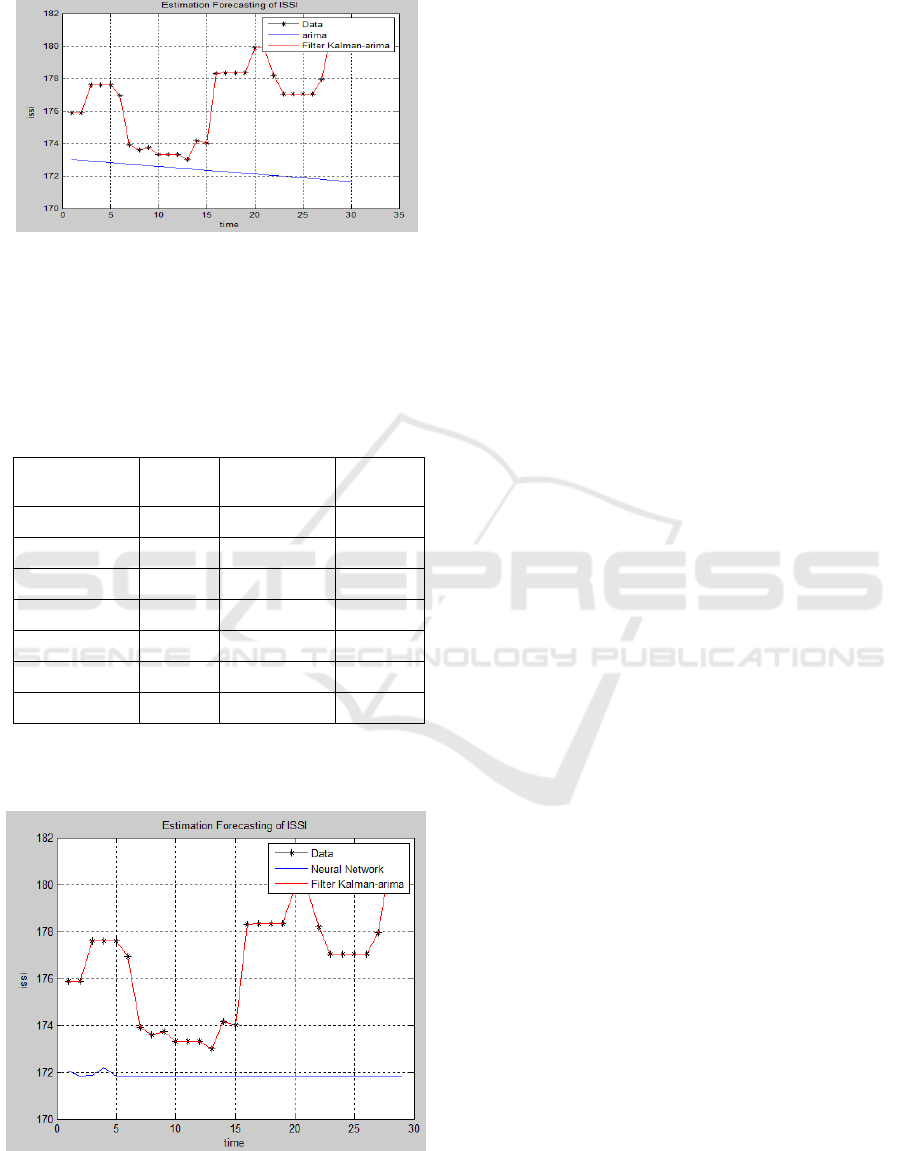
Figure 4: Plot data comparison of Actual Data, ARIMA
and ARIMA-Kalman Filter
Comparison of actual data, forecasting results using
the ARIMA-Kalman Filter and ANN for one week
are presented in Table 5.
Table 5: Comparison of actual data, forecasting results
using the ARIMA-Kalman Filter and Neutral Network
Date
Actual
ARIMA –
KF
ANN
09 Mei 2018
175.873
175.873
173.8703
10 Mei 2018
175.873
175.873
173.0156
11 Mei 2018
177.602
177.602
173.386
12 Mei 2018
177.602
177.602
175.1289
13 Mei 2018
177.602
177.602
173.9586
14 Mei 2018
176.942
176.942
174.9494
15 Mei 2018
173.912
173.912
174.6113
Comparison of Actual Data, ARIMA-Kalman filter
and ANN is shown by plot data in figure 5.
Figure 5 :Plot data comparison of Actual Data, ARIMA-
Kalman filter and ANN
5. CONCLUSION
The best ARIMA model used forecasting ISSI is
ARIMA (2,1,2) with RMSE value of= 1,08000 and
MAE = 0,70000. Then, the best ANN model is ANN
(12,12,1) with RMSE = 0,58705 and MAE = 0,59143.
Comparison forcasting ISSI result using ARIMA
and ANN indicates that ANN model is more optimal
than ARIMA. So, the forecasting result of ARIMA is
improved using Kalman – Filter and forecasting
results that are very close to the actual data with the
RMSE = 3.8693e-08 were obtained. This RMSE
value is much smaller than ANN. Thus, ARIMA –
Kalman Filter is more optimal than ANN in
forecasting ISSI.
REFERENCES
Afrianto, R. B., Tjandrasa, H., & Arieshanti, I.
(2013). Prediksi Pergerakan Harga Saham
Menggunakan Metode Backpropagation
Neural Network.Jurnal Simantec ISSN
2088-2130.
G. E. P. Box, G. M. Jenkins, and G. C. Reinsel.
(2013). Time series analysis: forecasting
and control. John Wiley & Sons.
Hairong Wang et al. (2017). An adaptive Kalman
filter estimating process noise covariance.
Neurocomputing, 12-17.
Halimi, I., & Kusuma, W. A. (2018). Prediksi Indeks
Harga Saham Gabungan (IHSG)
Menggunakan Algoritma Neural Network.
Jurnal Edukasi dan Penelitian Informatika
ISSN(e): 2548-9364 / ISSN(p) : 2460-0741.
J Hair & R.Anderson. (1998). Multivariate Data
Analysis. New York: Prentice Hall.
J. J. Siang. (2005). Jaringan syaraf tiruan dan
pemrogramannya menggunakan matlab.
Yogyakarta: Andi.
Jordan Grestandhi et al. (2011). Analisis
Perbandingan Metode Peramalan Indeks
Harga Saham Gabungan (IHSG) Dengan
Metode Ols-Arch/Garch Dan ARIMA .
ISBN : 978 – 979 – 16353 – 6 – 3 .
Kusumadewi, C. (2014). Prediksi Harga Saham di
Bursa Efek Menggunakan Metode
Campuran Autogressive Integrated Moving
Average dan Genetic Programming.
Bandung: Universitas Telkom.
L. Arsyad. ( 1995). Peramalan Bisnis. Jakarta:
Indones.
Moghaddama, A. H., Moghaddamb, M. H., &
Esfandyari, M. (2016). Stock market index
BEST ICON 2018 - Built Environment, Science and Technology International Conference 2018
302

prediction using artificial Neural Network.
Journal of Economics, Finance and
Administrative Science, 89-93.
Mustofa, M. M. (2010). Forecasting stock exchange
movements using Neural Networks:
Empirical evidence from Kuwait. Expert
Systems with Applications.
OJK. (2016). Mengenal Pasar Modal Syariah.
Ping-Feng Pai and Chih-Sheng Lin. (2005). A
hybridARIMA and support vector machines
model in stock price forecasting. Science
Direct, 497 – 505.
Ramadhan, B. A. (2015). Analisis Perbandingan
Metode ARIMA dan GARCH untuk
Memprediksi Harga Saham. e-Proceeding
of Management ISSN : 2355-9357,(hal. 61).
Respati, Y. (2017). Apa itu indeks saham syariah
indonesia ? Diambil kembali dari Berita
ekonomi dan keuangan:
http://keuangansyariah.mysharing.co/apa-
itu-indeks-saham-syariah-indonesia/
S. Makridakis, S. C. Wheelwright, and V. E. McGee.
(1999). Metode dan aplikasi peramalan.
Jakarta: Bin.Aksara.
Sadeq, A. (2008). Analisis Prediksi Indeks Harga
Saham Gabungan Dengan Metode ARIMA.
Semarang: Universitas Diponegoro.
Shukur, O. B. (2015). Artificial Neural Network And
Kalman Filter Approaches Based On
ARIMA For Daily Wind Speed Forecasting.
Universiti Teknologi Malaysia .
Sultan, M. H. (2014). Optimasi Parameter Neural
Network Pada Data Time Series Untuk
Memprediksi Rata-rata Kekuatan Gempa
Per Periode. Volume 3(ISSN: 2086-0382).
Sutojo T, et al. (2010). Kecerdasan Buatan.
Yogyakarta: Andi Ofset.
Ulinnuha, N., & Farida, Y. (2018). Prediksi Cuaca
Kota Surabaya Menggunakan ARIMA-
Kalman Filter. Jurnal Matematika ISSN:
2527-3159.
Optimization of Autoregressive Integrated Moving Average (ARIMA) for Forecasting Indonesia Sharia Stock of Index (ISSI) using Kalman
Filter
303
