
Identification of Glioma using Discrete Wavelet Transform (DWT)
and Artificial Neural Network (ANN)
Endah Nur Salamah
1
, Dian C Rini Novitasari
1
, Ahmad Hanif Asyhar
1
, Muh Ma’arif
1
1
Program Studi Matematika, Universitas Islam Negeri Sunan Ampel, Surabaya, Indonesia
Keywords: Glioma, Discrete Wavelet Transform (DWT), Artificial Neural Network (ANN)
Abstract: Glioma is one of the deadly diseases and suffered by many people in the world. Glioma means brain tumor.
In 2016, the World Health Organization (WHO) recorded as many as 6.2 million people of the world suffering
gliomas. Based on this fact, it is necessary to examine glioma using a tool that is one of magnetic resonance
imaging (MRI), then the results of brain MRI image be analyzed or diagnosed by an expert doctor but
sometimes the results of its analysis is still subjective and takes a long time. The image used in this study are
the normal brain MRI image and glioma brain MRI image. First steps are image improvement (Adaptive
Histogram Equalization), the second step is image segmentation using the Otsu threshold, third step is image
extraction using discrete wavelet transform (DWT) with features taken are energy, standard deviation and
mean, then classification using ANN (backpropagation) which will be identified into two classes namely
normal and glioma. Based on the testing result using the Matlab program, the results of image extraction using
the best decomposition levels DWT Haar is 4. Then the results of the best-hidden layers backpropagation
ANN classification is 25 then obtained MSE error value = 0,0000999 it indicates that the model used in this
study is suitable for identifying gliomas using image data and obtained the best accuracy values of 91.67%,
the sensitivity of 100%, and specificity of 85.71%.
1 INTRODUCTION
There are many kinds of brain disease, one of them is
a tumor. Many people in the world suffered the
disease. Uncontrolled growth of body cells that
changes character, shape and kinetic is called a tumor
(Lestari, et al., 2017). In this study, we identified the
tumor that occurs in glia cells is called glioma
(Drevelegas, 2011). Glia cells in the brain are neuron
supporting cells that decisive the synaptic contact and
protect the ability of neurons signals so the signal
connection of neurons and brain properly worked
(Purves, et al., 2001). World Health Organization
(WHO) recorded that 688,000 people in the United
States suffered the primary glioma in 2012 and 6.2
million of the world's population suffered the glioma
in 2016 (Anitha & Raja, 2017). Glioma is the fifth
disease that causes the death of women cancer
patients at age 20-39 years (Sari, et al., 2013). Data
cases of glioma in Indonesia haven’t reported, so
there are just a few data and no records of glioma data.
Glioma patients in Indonesia increased in 2013,
especially the Gatot Soebroto Army Hospital in
Jakarta (Satyanegara, 2010). The test of brain tumors
is taken by specialists using CT-Scan or MRI devices
which the results will analyze by a doctor, but
sometimes the results of doctor's diagnosis are
subjective and require a long time. Therefore, a
method is needed to help the diagnosis be more
objective in a short time.
In this study used brain MRI images data because
the results are a clear image and almost 90% used
MRI to diagnose the head and spinal cord (Sjahriar &
Iwan, 2005). Anitha and Raja obtained the features of
brain tumors for identification of brain cells in normal
and tumor glia cells in their paper "Segmentation of
Glioma Tumors using Convolutional Neural
Networks" using morphological operations, there are
opening and closing to segmented the features and
background in brain images (Anitha & Raja, 2017).
Neural networks are used in many problems such as
prediction, EEG signal classification, and image
classification. Classification of EEG signal used
Adaptive Neighborhood Modified Backpropagation
Salamah, E., Novitasari, D., Asyhar, A. and Ma’arif, M.
Identification of Glioma using Discrete Wavelet Transform (DWT) and Artificial Neural Network (ANN).
DOI: 10.5220/0008906700002481
In Proceedings of the Built Environment, Science and Technology International Conference (BEST ICON 2018), pages 289-294
ISBN: 978-989-758-414-5
Copyright
c
2022 by SCITEPRESS – Science and Technology Publications, Lda. All rights reserved
289
(ANMBP) with EEG signal data in normal and
epilepsy patients (Novitasari, 2015). The first study
referred by the author of the study is backpropagation
neural network implementation for medical image
compression which applies backpropagation method
for processing medical images with X-ray
examination of bones into four classes there are
fractured, dislocated, broken and healthy with
accuracy values obtained by 90% (Dimililer, 2013).
The second study referred is Guijarro et all in discrete
wavelet transform for improving greenness image
segmentation in agricultural image by extracting the
features of agricultural image using DWT texture
analysis to obtained value of mean and standard
deviation, so image quality is obtained with good
results although the image that used is a low-quality
image (Guijarro, et al., 2015).
A related study that made by the author based on
the previous study is about the identification of
glioma using discrete wavelet transform (DWT) and
artificial neural network (ANN) to identify and
classify brain MRI images into two classes, there are
normal brain and glioma. In this study used
segmentation process to separate objects and
background from brain images. DWT is the
technique of low filters and high filters as image
processing used to image extraction to obtain the
value of energy, mean, and standard deviations, it also
to find which the DWT process that obtained the best
decomposition level value of glioma texture. The
three values used as input to the ANN method with a
backpropagation algorithm. In this study used the
backpropagation algorithm because the previous
research obtained high accuracy values at the process
of medical image data. Backpropagation algorithm
used to find the proper classification process with the
best backpropagation structure.
2 LITERATURE REVIEW
2.1 Glioma
Glioma is a type of disease that occurs in tissues that
grow uncontrollably and abnormally in the brain. The
brain has an important role in regulating body activity
because the brain is the central neuron system. The
main cause of gliomas is still unknown. There are
several factors that can increase a person's risk of
developing a glioma including hereditary factors and
side effects of radiotherapy (radiation) procedures.
Gliomas that arise from glia cells are called gliomas
and this type of brain tumor is most common. This
type of glioma is located supratentorially above the
tentorium of the brain (Enggariani, 2012). In this
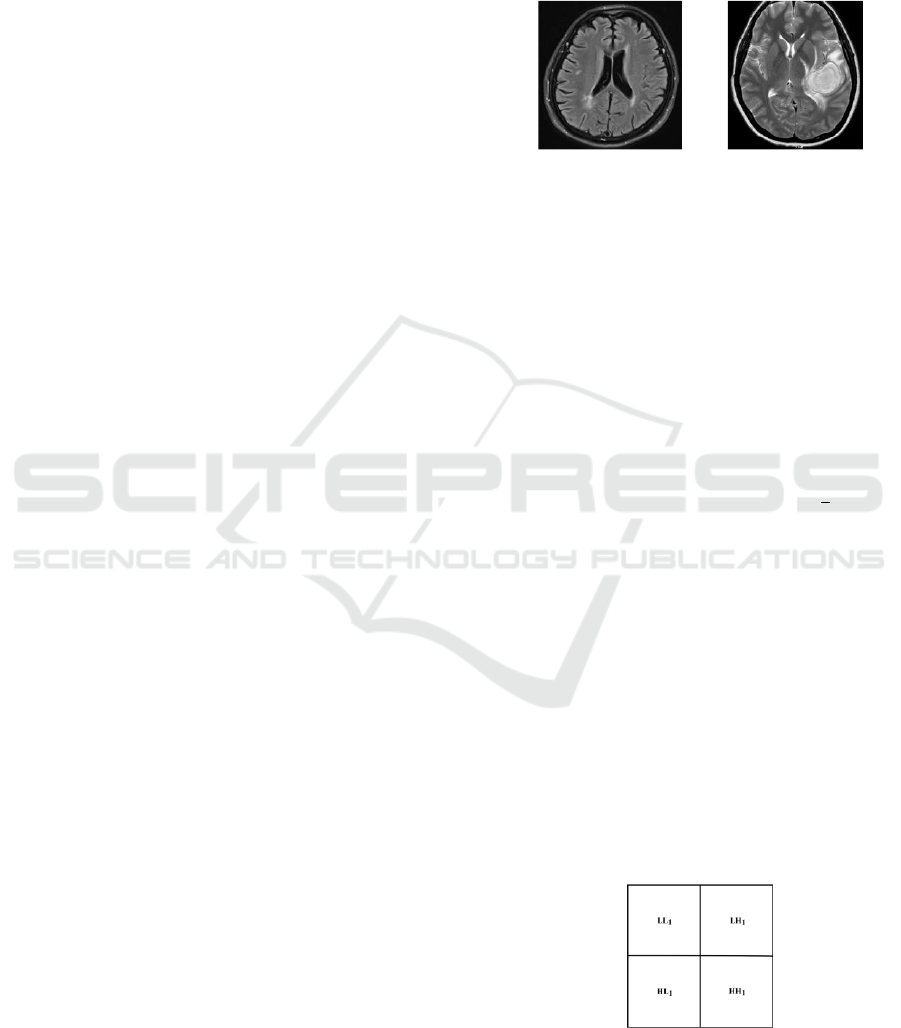
study two classes were used: normal and glioma
presented in Figure 1. Identification of glioma
visually has a different or striking color. The image
used in this study results from Magnetic Resonance
Imaging (MRI) examination.
Figure 1: Brain MRI image (Anitha & Raja, 2017)
2.2 Discrete Wavelet Transform
(DWT)
Wavelet transformation is the transformation of
discrete signals into wavelet coefficients obtained by
filtering signals using two filters, namely a high pass
filter and low pass filter. Mathematical operations
that are the main basis of wavelets include (Sutarno,
2010):
1) Translation, example
,
2) Scaling, example
Based on the two mathematical operations above that
combined produce a family of wavelets. Wavelets
have many types depending on the functions used,
such as Haar, Symlet, Daubechies, Coifflet, and so
on. The most commonly used types of wavelets are
Haar and Daubechies.
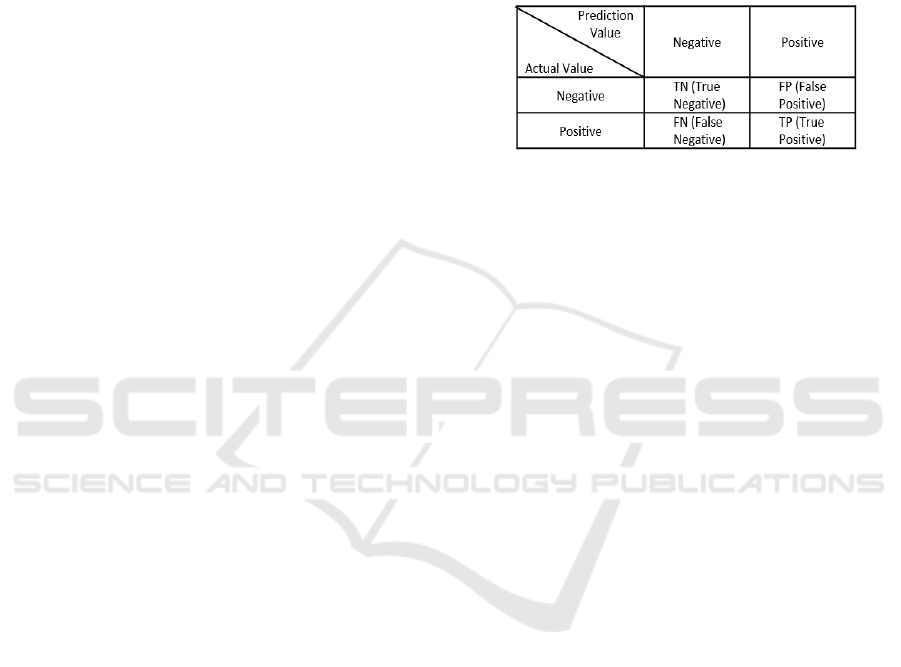
DWT is a transformation that is identical to the
hierarchical sub-band system where the logarithmic
sub-band is in the frequency domain. DWT
decomposes the image of the four sub-bands of
frequency, namely the low-pass through low pass
filter (LL), the low pass through high filter (LH), the
high pass through low pass filter (HL), and the high
pass through high pass filter (HH) such as in Figure 2
(Nayak, et al., 2015). The filter on the image is called
decomposition.
Figure 2: The level 1 wavelet decomposition
(Guijarro, et al., 2015)
A The Brain Normal
B Glioma
BEST ICON 2018 - Built Environment, Science and Technology International Conference 2018
290
DWT Haar is used in this study because it is better
to represent the characteristics of texture and shape
and the computation time needed is less compared to
other wavelet methods (Novamizanti & Kurnia,
2015). The analysis of the texture that is used such as
energy, average, and standard deviation (Singh, et al.,
2015). Energy is used to calculate Euclidean distance
which is then used to determine similarity and the
inequality of two feature vectors, mean and standard
deviation are statistical groups whose purpose is to
find out the uniformity and concentration of a data in
an image, then the feature vector is used for input
artificial neural networks.
2.3 Artificial Neural Network (ANN)
The artificial neural network is one information
processing system that is designed by imitating the
work of the neuron system in the human brain. ANN
consists of two layers, namely the input layer and the
output layer which has a different number of
networks (neurons), but there are have layers located
between the input and output layers called hidden
layers (Novitasari, et al., 2016). In this study, the
algorithm used is the backpropagation algorithm
because based on the previous study obtained high
accuracy values and good for classification of image
data (Dimililer, 2013). Backpropagation algorithm is
a supervised algorithm that trains the network by
spreading the output error backward from the output
layer to the input layer. The backpropagation training
algorithm using the sigmoid activation function is as
follows (Siang, 2005):
a. Initialize all weights with small random
numbers.
b. If the termination condition has not been
met, do step c-j.
c. Each input unit receives a signal and passes
it to a hidden unit above it.
d. Calculates all outputs in hidden units which
is the sum of input signals that have been
given weight and bias.
e. Calculates all network outputs in the output
unit.
f. Calculate the error factor of the output unit
based on errors in each output unit that
serves to correct errors and determine
changes in weight to be used.
g. Calculate the error factor of the output unit
based on errors in each network unit (node)
output, then calculate the change in weight.
Next, calculates all changes in weight from
the output unit to the hidden unit.
2.4 Measurement of Classification
Accuracy
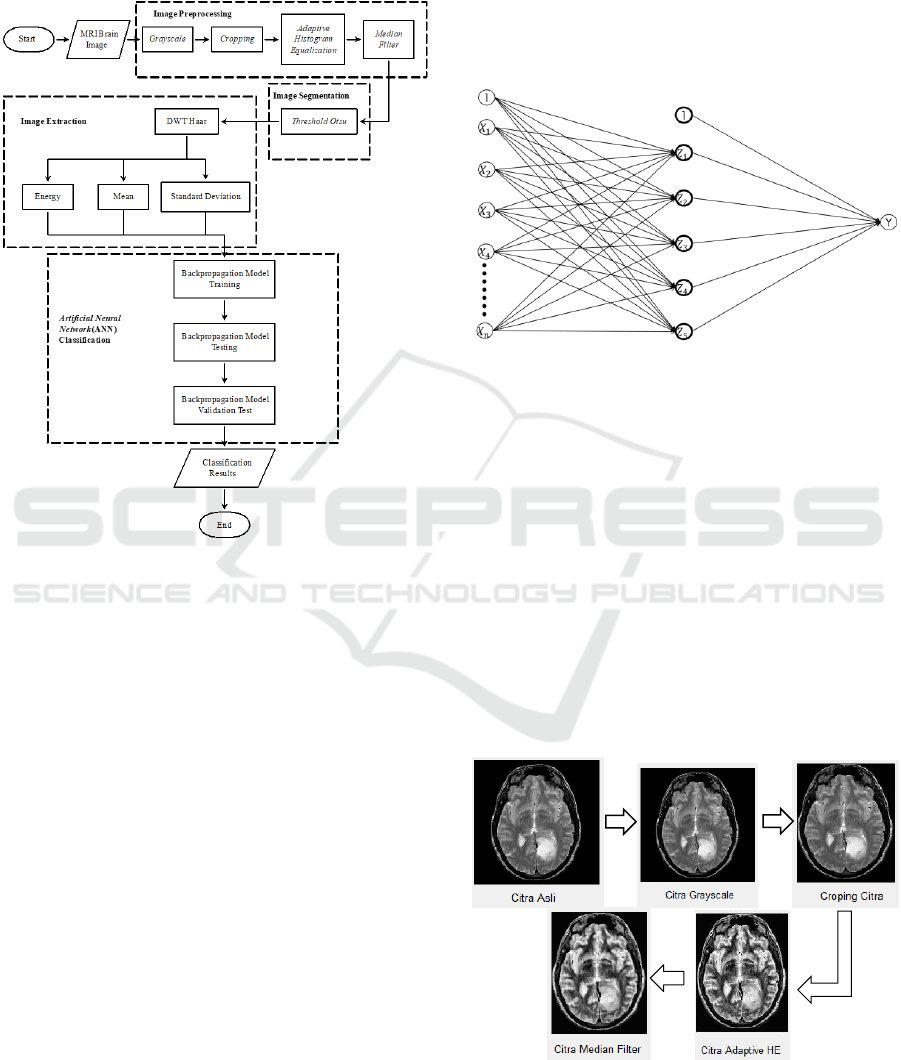
In the classification results using backpropagation
algorithm, it is necessary to have a system validation
to ensure its accuracy, so that the confusion matrix is
used by analyzing the value of sensitivity, specificity,
and accuracy (Akobeng, 2006). The confusion matrix
structure is presented in Figure 3.
Figure 3: Structure Confusion Matrix
Sensitivity is a test to detect the right ill patient is
diagnosed with the illness. The method is the TP
value divided by the TP value plus the FN value
multiplied by 100%. Specificity is a test to detect that
a normal patient is diagnosed as normal. The method
is the TN value divided by the TN value plus the FP
value multiplied by 100%. Accuracy is a test to
correctly identify the actual condition of the patient
(positive or negative results that are right). The
method is to divide the exact number of classification
with the total data multiplied bay 100%.
3 RESEARCH METHODS
3.1 Data
In this study, the data used was obtained from the
Atlas web. Atlas web is a website that provides
information and data in the form of images that are
specifically the brain, such as normal brain image
data, glioma image data, brain cancer images, etc.
(Johnson & Becker, 1995). This study uses data as
many as 60 images consisting of the normal brain and
tumor images with a comparison of training and
testing data that is equal to 80% and 20% and 75%
and 25% (Hota, et al., 2013).
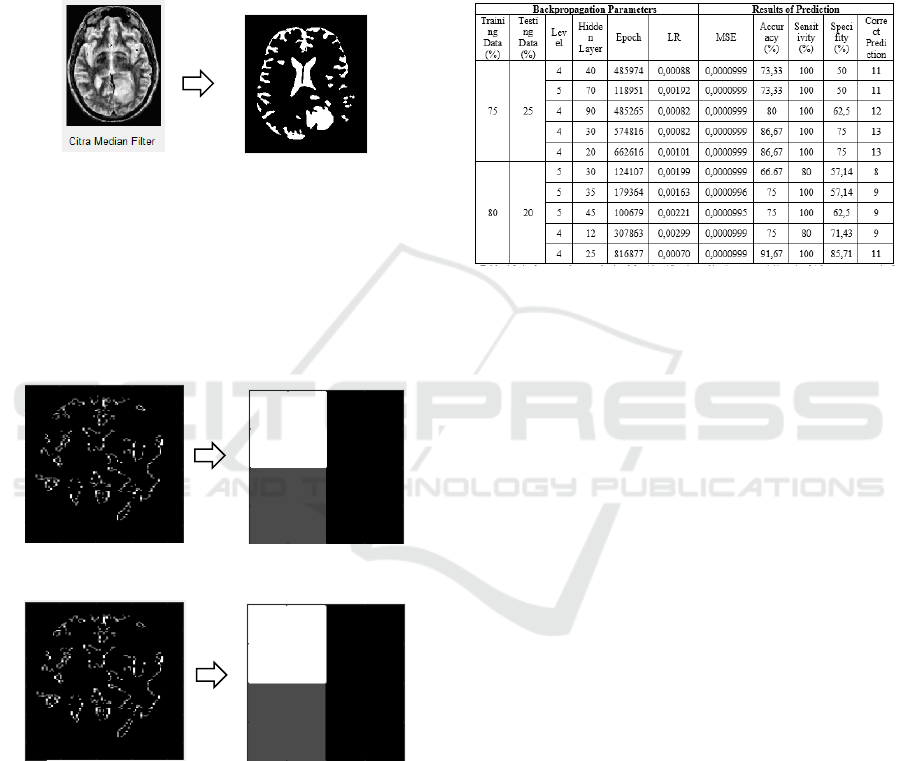
3.2 Preprocessing
The first step is the brain image data is converted to
grayscale image (gray), then cropping is done, then
gray intensity is improved by the adaptive histogram
equalization process, then the image is refined using
the median filter. This study will be carried out in
Identification of Glioma using Discrete Wavelet Transform (DWT) and Artificial Neural Network (ANN)
291
several main processes is preprocessing,
segmentation, extraction, and classification with
brain MRI image data. The process is shown in Figure
4.
Figure 4: The classification system of glioma image
3.3 Segmentation
Next step, after preprocessing finish is the
segmentation process, which is the separation of
objects with the background using the Otsu threshold
method.
3.4 Extraction
In this process, it functions to take the pattern of
normal brain image and glioma pattern using the
Discrete Wavelet Transform Haar method then
analyzed the pattern texture in the image by
calculating the energy, average, and standard
deviation values which are then used as input for the
classification process ANN backpropagation.
3.5 Classifications
The fourth step is the image classification process.
This process uses backpropagation method for data
training/testing. The image data used is 60 images
consisting of normal brain and glioma. Comparison
of training and testing data used is 75%, 25% and
80%, 20%. After classification, the results were tested
using a confusion matrix by analyzing the value of
sensitivity, specificity, and accuracy. Furthermore, it
classified into 2 classes, namely normal or tumor. The
structure of the backpropagation model used in this
study is in Figure 5.
Figure 5: The structure backpropagation of study data
(Prasetyo, 2014)
4 RESULTS AND ANALYSIS
The results of the trial of brain image processing and
classification using the MatLab program.
4.1 Preprocessing
The results all processing steps use the MatLab
presented in Figure 6. Based on the preprocessing
results that have been done provide a level of clarity
of the glioma object, so the preprocessing results can
be applied at the segmentation step.
Figure 6: The results of preprocessing brain image
Input Layer
Hidden Layer
Output
Layer
BEST ICON 2018 - Built Environment, Science and Technology International Conference 2018
292
4.2 Segmentation
At this steps, the function in MatLab is used, such as
level = graythres (I) so the results are presented in
Figure 7. Based on the results of the segmentation
obtained the color difference between the object and
the background image that the object is at the level of
intensity of 0 and 1 pixels, where 0 is the pixel
intensity in black and 1 is the color of white pixels.
Figure 7: The results of the segmentation otsu threshold
brain image
4.3 Extraction
In this study used the image extraction process using
Discrete Wavelet Transform Haar method with the
decomposition level used is 4 and 5. The results of
image extraction are presented in Figures 8 and 9.
Figure 8: The results of level 4 DWT Haar brain image
Figure 9: The results of level 5 DWT Haar brain image
At level 4 there are 13 low and high filters and the
trial process needs a bit of time to reach the error
target. At level 5 there are 16 low and high filters and
the trial process takes quite a bit of time to reach the
error target. In this feature extraction process
obtained vector DWT Haar feature with different
decomposition levels, namely level 1-5 which is sized
according to the level used. Suppose that the
decomposition level used is 3 then got the result of
feature vector DWT with size 1 × 30 pixels which will
be used as input to the Artificial Neural Network
(ANN) Backpropagation.
4.4 Classifications
Backpropagation classification in this study was
carried out computationally using Matlab software.
Then the training and testing processes are shown in
Figure 10.
Figure 10: The Results of the Training and Testing
Backpropagation
Based on Figure 10 the best results of
backpropagation process for glioma identification are
80% training data and 20% testing data using 4
decomposition levels whose results are vectors values
of energy, mean, and standard deviations of 1 × 39
lengths for each image, then the best backpropagation
structure is 25 nodes of the hidden layer, learning rate
equal to 0,00070, and MSE error value is 0.0000999.
Then a comparison is made to check the
classification results in the backpropagation model
with the results of the actual classification. The result
is that there is a normal brain image classified as
glioma so the specificity value is 85.71%, the
sensitivity value is 100%, and the accuracy value is
91.67%.
5 CONCLUSIONS
Based on the testing result using the Matlab program, the
results of image extraction using the best decomposition
levels DWT Haar is 4. Then the results of the best-hidden
layers backpropagation ANN classification is 25 then
obtained MSE error value = 0,0000999 it indicates that
the model used in this study is suitable for identifying
gliomas using image data and obtained the best
accuracy values of 91.67%, the sensitivity of 100%, and
specificity of 85.71%.
Identification of Glioma using Discrete Wavelet Transform (DWT) and Artificial Neural Network (ANN)
293

REFERENCES
Akobeng, A., 2006. Understanding Diagnostic Test1:
Sensitivity, Specify, and Predictive Values.
Jurnal Acta Pediatrica, pp. 338-341.
Anitha, R. & Raja, D. S. S., 2017. Segmentation of
Glioma Tumors using Convolutional Neural
Networks. International Journal Imaging
System Technology, pp. 354-360.
Dimililer, K., 2013. Backpropagation Neural
Network Implementation for Medical Image
Compression. Journal of Applied
Mathematics, pp. 1-7.
Drevelegas, A., 2011. Imaging of Brain Tumor with
Histological Correlations. second ed. New
York: Springer.
Enggariani, 2012. Tumor Otak (Brain Tumors),
Pekanbaru: Fakultas Kedokteran Universitas
Riau.
Guijarro, M., Riomorros, I., Pajares, G. & Zitinski, P.,
2015. Discrete Wavelet Transform for
Improving Greeness Image Segmentation in
Agricultural Images. Computer and
Electronics in Agriculture, pp. 396-407.
Hota, H. S., Shrivas, A. K. & Singhai, K. S., 2013.
Artificial Neural Network, Decission Tree
and Statistical Techniques Applied for
Designing and Developping E-mail
Classifier. International Journal of Recent
Technology and Engineering (IJRTE), pp.
164-169.
Johnson, K. A. & Becker, J. A., 1995. Retrievied from
the Whole Brain Atlas. [Online]
Available at:
http://www.med.harvard.edu/aanlib/
[Accessed Juli 01 2018].
Lestari, Y., Mesran, Suginam & Fadlina, 2017.
Sistem Pakar untuk Mendiagnosis Penyakit
Tumor Otak menggunakan Metode
Certainty Factor (CF). Jurnal INFOTEK,
Volume 2 , pp. 82-86.
Nayak, D. R., Dash, R. & Majhi, B., 2015. Brain MRI
Image Classification using Two-
dimensional Discrete Wavelet Transform
and AdaBoost with Random Forest. Jurnal
Neurocomputing, pp. 1-10.
Novamizanti, L. & Kurnia, A., 2015. Analisis
Perbandingan Kompresi Haar Wavelet
Transform dengan Embedded Zerotree
Wavelet pada Citra. Jurnal ELKOMIKA, pp.
161-176.
Novitasari, D. C. R., 2015. Klasifikasi Sinyal EEG
menggunakan Metode Fuzzy C-Means
Clustering (FCM) dan Adaptive
Neighborhood Modified Backpropagation
(ANMBP). Jurnal Matematika "MANTIK",
pp. 31-36.
Novitasari, D. C. R., Farida, Y. & Puspitasari, 2016.
Klasifikasi menggunakan Metode Hybrid
Bayessian-Neural Network (Studi Kasus:
Identifikasi Virus Komputer). Jurnal
Matematika "MANTIK", pp. 38-43.
Prasetyo, E., 2014. Data Mining- Mengolah Data
menjadi Informasi menggunakan Matlab.
Yogyakarta: ANDI.
Purves, D., Augustine, G. J. & Fitzpatrick, D., 2001.
Neuroscience. second ed. Sunderland:
Sinauer Associates.
Sari, E., Windarti, I. & Wahyuni, A., 2013.
Karakteristik Klinis dan Histopatologi
Tumor Otak di Dua Rumah Sakit Bandar
Lampung, Lampung: Fakultas Kedokteran
Universitas Lampung.
Satyanegara, 2010. Ilmu Bedah Saraf. 4 ed. Jakarta:
Gramedia Pustaka Utama.
Siang, J. J., 2005. Jaringan Saraf Tiruan &
Pemrogramnya menggunakan Matlab.
Yogyakarta: Andi Offset.
Singh, A. et al., 2015. Image Processing Based
Automatic Diagnosis of Glaucoma using
Wavelet Features of Segmented Optic Disc
from Fundus Image. Computer Methods and
Programs in Biomedicine, pp. 108-120.
Sjahriar, R. & Iwan, E., 2005. Radilogi Diagnostik ,
Jakarta: Fakultas Kedokteran Universitas
Indonesia.
Sutarno, 2010. Analisis Perbandingan Transformasi
Wavelet pada Pengenalan Citra Wajah.
Jurnal GENERIC, pp. 15-21.
BEST ICON 2018 - Built Environment, Science and Technology International Conference 2018
294
