
The Implementation of Multi Criteria Decision Making (MCDM) for
the Evaluation of Sustainable Regional Development in East Java by
Using the Fuzzy C-Means Method and Technique for Order
Preference By Similarity To Ideal Solution (TOPSIS)
Devi Saidatuz Zaenab
1
, Yuniar Farida
1
, Dian C Rini Novitasari
1
, Ahmad Lubab
1
, Dian Yuliati
1
1
Department of Mathematics, State Islamic University Sunan Ampel Surabaya, Jl. A. Yani 117, Surabaya
dian.yuliati2014@gmail.com
Keywords: MCDM, Fuzzy C-Means, TOPSIS, Sustainable Development
Abstract: The assessment of sustainable regional development performance has several criteria, such as based on social,
economic and environmental aspects. These criteria include number of sub criteria that are used as indicators.
The large number of criteria and sub criteria in the assessment of sustainable regional development
performance of East Java which include 29 districts and 9 cities can cause performance appraisal to be
complicated, there for an approach is needed accommodate all of these criteria and sub criteria. This research
was conducted using the MCDM approach and aims to determine the ranking of each district or city in the
evaluation of sustainable regional development in East Java using the TOPSIS method, to provide input for
decision making in the East Java local government to develop sustainable regional development based on
criteria or district preference. The steps of this research consist of data analysis, data clustering using Fuzzy
C-Means, and ranking using the TOPSIS method. In the clustering process, data grouped into four regional
cluster: advanced, potential, developing, and Underdeveloped. The initial step of the clustering process was
to cluster seven sub criteria from the economic criteria, seven sub criteria from the social criteria, and five sub
criteria from the enironmental criteria, and lastly cluster all criteria. The weighting criteria was used for the
ranking process. The results of this research are in the form of a ranking for each district or city in East Java,
from economic, social, environmental, and overall criteria. For the ranking results, the top ten includes the
Bojenogoro district, Banyuwangi district, Malang city, Mojokerto district, Kediri city, Surabaya city, Gresik
and Malang district.
1 INTRODUCTION
Sustainable development is development that is
oriented to the compliance of human needs through
wise and efficient utilization of natural resources
which also pays attention to the sustainability of its
utilization for the present and future generations
(Jaya, 2004).The goal of sustainable development is
essentially to develop equitable development from
various aspects that is equitable for the present and
future generations.
There are three main factors why development
must be sustainble various aspects. The first factor, in
terms of economic development, is defined as
development that is able to continuously produce
goods and services to maintain government
sustainability and avoid sectoral imbalances that can
damage agricultural and industrial production.The
second factor, is in terms of ecological or
environmental development, where the concept of
environmental sustainability must be able to maintain
stable resources, avoid exploitation of natural
resources and function as environmental absorption.
This concept also relates to the maintenance of
biodiversity, stability of air space, and other functions
in the ecosystem that do not include economic
sources. The third factor, in terms of social
development, defines social sustainability as a system
capable of achieving equality, provides social
services such as supporting health, education, gender
equality, and political accountability (Fauzi, 2004).
Zaenab, D., Farida, Y., Novitasari, D., Lubab, A. and Yuliati, D.
The Implementation of Multi Criteria Decision Making (MCDM) for the Evaluation of Sustainable Regional Development in East Java by Using the Fuzzy C-Means Method and Technique for
Order Preference By Similarity To Ideal Solution (TOPSIS).
DOI: 10.5220/0008906400002481
In Proceedings of the Built Environment, Science and Technology International Conference (BEST ICON 2018), pages 281-288
ISBN: 978-989-758-414-5
Copyright
c
2022 by SCITEPRESS – Science and Technology Publications, Lda. All rights reserved
281

These conflicting problems can be referred to as
MCDM.
MCDM is a method of decision making that
determines the best alternative from a number of
alternatives based on certain criteria (Rani, Nessa,
Faizal, & Samawi, 2014). MCDM is also used for the
best selection in several cases, such as the research of
the Best Supplier Selection by using the Technique
for Order Preference by Similarity to Ideal Solution
(TOPSIS) (Putra, 2013). In sustainable urban
development evaluation research, MCDM Uses fuzzy
values to identify the coefficients of each criteria
(Zhang, Xu, Yeh, Liu, & Zhou, 2016).
In the MCDM method, the crucial problem is
determining the weight of each criterion and sub-
criteria. This study did not carry out the collection of
primary data and used secondary data. Hence the
weighting approach is obtained from clustering data
using the Fuzzy C-Means method. The Fuzzy C-
Means method is used to cluster and weigh the criteria
of sustainable regional development indicators.
The next crucial problem in MCDM is alternative
decision making. Alternative decisions are taken
account of from the criteria that produces the highest
weight. In this research, the TOPSIS method was
used for MCDM decision making because it can
select the best alternative from a number of
alternatives in a quick and practical manner.
Several studies that apply the combination of
Fuzzy C-Means and TOPSIS methods include the
Integration of Fuzzy C-Means Clustering Algorithm
and TOPSIS Method for Customer Age Assessment
by Amir (Azadnia, Saman, Wong, & Hemdi, 2011),
Fuzzy C-Integration Means and TOPSIS for
Performance Evaluation on Applications and
Comparative Analysis by Chunguang (Bai, Dhavale,
& Sarkis, 2014), and Decision Support Systems in
Mapping National Road and Bridge Repair Priorities
in Bengkulu Province Using TOPSIS and Fuzzy C-
Means (Oktariani, 2017).
Thus, this research proposes a method to identify
and incorporate linkage criteria in the process of
evaluating sustainable regional development for
district or city governments in East Java using
MCDM with the Fuzzy C-Means and TOPSIS
methods. This research is expected to provide input to
the East Java regional governments in making
decisions to develop sustainable regional
development based on district or city criteria
preferences.
2 LITERATURE REVIEW
2.1 Evaluation of Sustainable Regional
Development
According to the Organization for Economic
Operation and Development evaluation is the process
of determining the value of an activity, policy, or
program. Sustainable development according to
Sofyan is defined as a progressive transformation of
the social, economic and political structure to
increase the certainty of the Indonesian people in
fulfilling their current interests without sacrificing the
ability of future generations to fulfil their interests
(Abdurrahman, 2003).
Therefore, the evaluation of sustainable regional
development is an assessment of the quality of the life
development program from all aspects, including the
economic, social, and environmental aspects that
fulfil current interests without compromising the
ability of future generations.
2.2 Criteria for Sustainable Regional
Development
2.2.1 Economic Aspect
In the evaluation of sustainable development in
East Java, the economic aspects were determined by
the sub criteria of Gross Domestic Product (GDP),
fixed investment, average per capita expenditure,
GDP per capita, per capita income, GDP growth rate,
and per capita expenditure rate.
2.2.2 Social Aspects
In evaluating of sustainable development in East
Java, the social aspects were determined by the sub
criteria of population density, population growth rate,
per capita road area, per capita settlement area,
unemployment ratio, gini index, and number of
puskesmas (community health centers)
2.2.3 Environmental Aspects
To evaluation sustainable development in East Java,
the environmental aspects were determined by a
number of sub criteria, such as feasibility of clean
water usage, areas suitable for farming per capita,
investment in ecological protection, proportion of
urban forest fulfilment, and number of waste disposal
sites (WDS).
BEST ICON 2018 - Built Environment, Science and Technology International Conference 2018
282

2.3 Multiple Criteria Decision Making
(MCDM)
MCDM is considered as a term for all models and
techniques related to Multiple Objective Decision
Making (MODM) or Multiple Attribute Decision
Making (MADM) (Tabucanon, 1988).A problem is
classified as MCDM if and only if there are at least
two conflicting criteria and involve two alternative
solutions (Tabucanon, 1988). If a problem has at least
two conflicting criteria, and each of these criteria will
produce a different alternative solution, then the
problem can be said to be MCDM.
2.4 Fuzzy C-Means (FCM)
Fuzzy C-Means is a data clustering technique
where the presence of each data point in a cluster is
determined by the value or degree of membership.
Fuzzy C-Means algorithm is as follows:
1. Data input will be in cluster X, in the form of a
matrix measuring n × m (n = number of data
samples, m = attribute of each data). Xij = sample
data i (i = 1, 2, ..., n), attribute j (j = 1, 2, ..., m).
2. Determine the number of clusters, rank,
maximum iteration, smallest error, initial
objective function, initial iteration.
3. Generate a random number
, where i = 1, 2, ...,
n; k = 1, 2, ..., c; as elements of the initial partition
matrix U.
(1)
4. Calculate the center of the cluster k,V
kj
with k = 1,
2, ..., c and j = 1, 2, ..., m
(2)
where:
= cluster center
= degree of membership of point k in cluster i
= the rank of weight
= input data i, attribute j
5. Calculate the objective function in the t iteration
(3)
6. Calculate changes to the partition matrix
(4)
where:
= sample of data i, attribute j
= center cluster k for attribute j
= the rank of weight
7. Check the stop condition
▪ If t > Maxiteration stops
▪ Otherwise, t = t + 1, repeat step four
8. If the condition stops, it will find clusters of
cluster centers and membership levels for each
criterion.
2.5 TOPSIS
The TOPSIS method is one of the MCDM models
used for the assessment or selection of several
alternatives in a limited number. In the TOPSIS
method there is no limit on the number of attributes
and alternatives used, so that it can be used to solve a
case that has quantitative attributes more efficiently
(Rao, 2004).
The following are the steps used to use the TOPSIS
method:
1. Normalization of the decision matrix
using the equation 5.
(5)
Where, = cluster membership degree matrix
= value of the degree matrix of alternative
cluster membership i to attribute j
2. Determine the maximum and minimum values of
equation (5) using the formulas in Equations 6 and
7.
(6)
(7)
With i is an alternative and j is a criterion.
3. Determine the distance between the values of each
alternative with the positive ideal solution matrix
and the distance between the values of each
alternative with the positive ideal solution matrix
with the formula in Equation 8 and 9.
(8)
(9)
Where
4. Determine the preference value for each
alternative
with the formula in Equation 10.
(10)
Where
5. After the preference value is obtained, then it is
sorted from the highest to the lowest preference
value. High preference values will have the
highest ranking, and vise versa.
The Implementation of Multi Criteria Decision Making (MCDM) for the Evaluation of Sustainable Regional Development in East Java by
Using the Fuzzy C-Means Method and Technique for Order Preference By Similarity To Ideal Solution (TOPSIS)
283
3 RESEARCH METHODS
The data used in this research were 2015/2016
data from indicators of sustainable development,
which include social, economic, and environmental
aspects. The data was obtained from the East Java
Provincial Statistics Agency, the East Java Regional
Development Planning Agency, and the East Java
Provincial Environmental Service. This stage of
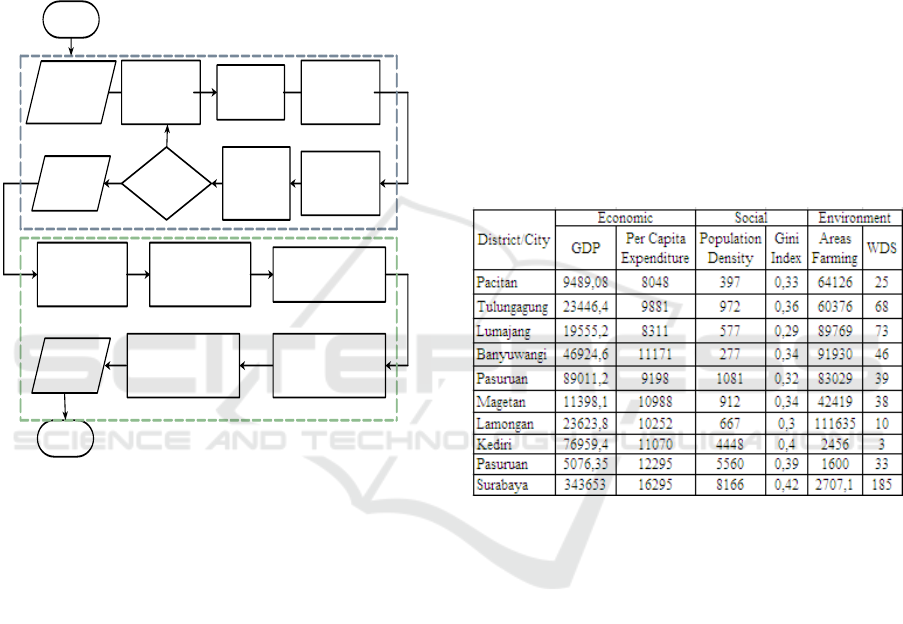
completion of the evaluation of sustainable regional
development research is presented below (Fig.1):
Start
Alternative Data
& Criteria Data
Random Numbers
Generated
Calculated
Cluster Center
Objective function is
calculated
Generate Random
Numbers
Calculated
Partition Matrix
changes
Cluster Result
Data
Normalization of
Decision Matrix
Determining Maximum
and Minimum Values
Determine the Positive and
Negative Ideal Solution Matrix
Determining the Preference
Value of Each Alternative
Ranking Result
Data
Finish
T
O
P
S
I
S
Fuzzy
C-Means
Yes
No
Check Stop
Conditions
Sort the Preference Value of
Each Alternative
Figure 1: Research Flow Chart
The general explanation of the stages of
completion of research is as follows:
a. Enter alternative data and criteria data.Alternative
data consists of 38 districts/ cities in East Java,
while the criteria data consists of economic
criteria with seven sub-criteria, social criteria with
seven sub-criteria, and environmental criteria
with five sub-criteria.
b. The data is grouped or clustered into four clusters
by using the Fuzzy C-Means method. This cluster
process aims to weigh each criteria used for the
ranking process. The weight used was obtained
from the membership degree of Fuzzy C-Means.
In the clustering process, the initial step was to
cluster seven sub criteria from the economic
criteria, seven sub criteria from the social criteria,
and five sub criteria from the environmental
criteria. Clustering was then performed on all
criteria.
c. After obtaining the weight, the weight of the
Fuzzy C-Means process is combined in the
ranking process using the TOPSIS method with
the aim of discovering the value of each district
and city in East Java. Before obtaining the ranking
results of each region, the centroid of cluster was
first ranked using the TOPSIS method.
d. Ranking results were obtained for each district or
city in East Java based on the criteria of
sustainable regional development, which was then
concluded.
4 RESULTS AND DISCUSSION
Data used from the indicators of sustainable
development, which include social, economic, and
environmental aspects as well as data samples shown
on Table 1.
Table 1. The Original Data of All Criteria and Sub
Criteria
Analysis was carried out on the three criteria with
19 different sub-criteria. The economic, social and
environmental criteria, were analyzed first, followed
by all the criteria together. The total criteria involved
nineteen sub criteria simultaneously. Using Fuzzy C-
Means, the thirty eight districts/cities were grouped
into four groups for each scenario of several criteria.
To avoid repetition, details were given for only the
economic criteria. Table 2 shows the results of
applying the FCM algorithm for economic criteria
which shows the value or degree of membership for
each district/ city and the four groups. The maximum
value of membership degree determines which cluster
each district/city is For example, for the District of
Pacitan, membership levels in clusters 1 to 4 are
0.9788, 0.0033, 0.0003, 0.0176. Therefore Pasuruan
District was included in Cluster 1, because the value
of Cluster 1 membership was the highest of the other
values.
BEST ICON 2018 - Built Environment, Science and Technology International Conference 2018
284

Table 2: Cluster formation by Fuzzy C-Means for
Economic Criteria
District / City
Degree of Membership
1
2
3
4
Pacitan
0.9788
0.0033
0.0003
0.0176
Ponorogo
0.9765
0.0035
0.0003
0.0197
Trenggalek
0.9830
0.0026
0.0002
0.0142
Tulungagung
0.8793
0.0118
0.0007
0.1081
Blitar
0.9235
0.0084
0.0005
0.0676
Kediri
0.8433
0.0165
0.0011
0.1391
Lumajang
0.9612
0.0045
0.0003
0.0339
Bondowoso
0.9830
0.0025
0.0002
0.0142
Situbondo
0.9925
0.0011
0.0001
0.0063
Probolinggo
0.9447
0.0064
0.0004
0.0485
Jombang
0.8718
0.0130
0.0008
0.1143
Nganjuk
0.9798
0.0028
0.0002
0.0173
Madiun
0.9865
0.0020
0.0002
0.0113
Magetan
0.9904
0.0014
0.0001
0.0080
Ngawi
0.9807
0.0029
0.0002
0.0161
Lamongan
0.8802
0.0121
0.0008
0.1069
Bangkalan
0.9809
0.0026
0.0002
0.0163
Sampang
0.9681
0.0048
0.0004
0.0266
Pamekasan
0.9560
0.0071
0.0006
0.0364
Sumenep
0.9220
0.0084
0.0005
0.0690
Blitar City
0.9139
0.0145
0.0012
0.0705
Probolinggo City
0.9345
0.0104
0.0008
0.0544
Pasuruan City
0.9396
0.0100
0.0008
0.0496
Mojokerto City
0.8927
0.0181
0.0014
0.0878
Madiun City
0.7131
0.0476
0.0033
0.2360
Batu City
0.7095
0.0469
0.0032
0.2404
Pasuruan
0.0340
0.8473
0.0032
0.1155
Sidoarjo
0.0564
0.8077
0.0135
0.1224
Gresik
0.0255
0.8837
0.0023
0.0885
Kediri City
0.2236
0.3723
0.1308
0.2733
Surabaya City
0.0002
0.0004
0.9991
0.0003
Malang
0.1149
0.0946
0.0030
0.7876
Jember
0.1688
0.0452
0.0020
0.7840
Banyuwangi
0.0299
0.0123
0.0004
0.9574
Mojokerto
0.0183
0.0114
0.0003
0.9699
Bojonegoro
0.0427
0.0171
0.0006
0.9396
Tuban
0.0901
0.0170
0.0007
0.8922
Malang City
0.0711
0.0353
0.0011
0.8925
Before obtaining the ranking results of each
region, the centroid of cluster was first ranked using
the TOPSIS method (see Eq. (10)) with the aim of
distinguishing regional rankings in the regions that
entered the cluster and were determined with the
results are in Table 3. The centroids of the clusters
provide the information required for this analysis. For
economic criteria, the closeness coefficients
indicatethat the most desirable cluster is cluster 4,
followed by clusters 1, 2, and 3.
The results of grouping the economic, social and
environmental criteria using the FCM method based
on membership degrees were used to identify regions
based on the equation of variable characteristics, which
aims to combine information on the implementation of
sustainable regional development in East Java more
precisely. The results of the classification are found
in Table 4, where each district/city is defined as an
advanced, potential, developing and underdeveloped
region.
Table 3: Ranking of Centroid for ClusterEconomic
Criteria using TOPSIS
Centroid of Cluster
T
Ranking
Cluster 1
0.6339
2
Cluster2
0.6151
3
Cluster3
0.3597
4
Cluster4
0.7084
1
Table 4: Interpretation of Clustering Results Using Fuzzy
C-Means
District / City
Criteria
Economic
Social
Enviroment
Pacitan
Under
developed
Under
developed
Developing
Ponorogo
Under
developed
Under
developed
Developing
Trenggalek
Under
developed
Developing
Developing
Tulungagung
Under
developed
Developing
Developing
Blitar
Under
developed
Advanced
Potential
Kediri
Under
developed
Advanced
Developing
Malang
Developing
Under
developed
Advanced
Lumajang
Under
developed
Developing
Potential
Jember
Developing
Underdevelop
ed
Advanced
Banyuwangi
Developing
Potential
Potential
Bondowoso
Underdevel
oped
Under
developed
Developing
Situbondo
Underdevel
oped
Underdevelop
ed
Developing
Probolinggo
Under
developed
Under
developed
Potential
Pasuruan
Potential
Developing
Potential
Sidoarjo
Potential
Developing
Under
developed
Mojokerto
Developing
Developing
Developing
Jombang
Under
developed
Developing
Developing
Nganjuk
Under
developed
Developing
Developing
Madiun
Under
developed
Developing
Developing
Magetan
Under
developed
Developing
Developing
Ngawi
Under
developed
Under
developed
Developing
Bojonegoro
Developing
Under
developed
Potential
The Implementation of Multi Criteria Decision Making (MCDM) for the Evaluation of Sustainable Regional Development in East Java by
Using the Fuzzy C-Means Method and Technique for Order Preference By Similarity To Ideal Solution (TOPSIS)
285

Tuban
Developing
Developing
Advanced
Lamongan
Under
developed
Developing
Advanced
Gresik
Potential
Advanced
Developing
Bangkalan
Under
developed
Under
developed
Potential
Sampang
Under
developed
Developing
Potential
Pamekasan
Under
developed
Developing
Developing
Sumenep
Under
developed
Developing
Advanced
Kediri City
Potential
Under
developed
Under
developed
Blitar City
Under
developed
Under
developed
Under
developed
Malang City
Developing
Under
developed
Under
developed
Probolinggo City
Under
developed
Under
developed
Under
developed
Pasuruan City
Under
developed
Under
developed
Under
developed
Mojokerto City
Under
developed
Under
developed
Under
developed
Madiun City
Under
developed
Under
developed
Under
developed
Surabaya City
Advanced
Developing
Under
developed
Batu City
Under
developed
Under
developed
Under
developed
The next step determined the ranking of each
region using TOPSIS from the results of the FCM
membership degree and centroid of cluster ranking in
Table 3. This was determined by the calculation of
the proximity coefficients by using the TOPSIS
algorithm and shown on Table 5 for the ranking of
economic criteria. The same method was used to
obtain the overall ranking of districts/cities based on
economic, social, environmental criteria, and all
criteria obtained, as seen on Table 6.
Table 5: Ranking of Economic Criteria using TOPSIS
District / City
T
Economic
Pacitan
0.3677
25
Ponorogo
0.3679
24
Trenggalek
0.3673
30
Tulungagung
0.3781
12
Blitar
0.3729
17
Kediri
0.3831
10
Malang
0.3907
2
Lumajang
0.3692
22
Jember
0.3925
1
Banyuwangi
0.3695
6
Bondowoso
0.3673
29
Situbondo
0.3666
33
Probolinggo
0.3707
20
Pasuruan
0.3814
36
Sidoarjo
0.3835
35
Mojokerto
0.3684
7
Jombang
0.3684
11
Nganjuk
0.3676
26
Madiun
0.3671
31
Magetan
0.3668
32
Ngawi
0.3675
27
Bojonegoro
0.3711
5
Tuban
0.3764
3
Lamongan
0.3780
13
Gresik
0.3768
37
Bangkalan
0.3675
28
Sampang
0.3686
23
Pamekasan
0.3696
21
Sumenep
0.3731
16
Kediri City
0.4958
34
Blitar City
0.3737
15
Malang City
0.3760
4
Probolinggo City
0.3717
18
Pasuruan City
0.3711
19
Mojokerto City
0.3761
14
Madiun City
0.4085
9
Surabaya City
0.3660
38
Batu City
0.4095
8
The results of the ranking of overall criteria
shows that the district/cities in the top ten were the
Bojonegoro district, Banyuwangi district, Malang
city, Mojokerto district, Kediri city, Surabaya city,
Sidoarjo district, Pasuruan district, Gresik district,
and Malang district.
Table 6: Ranking of different perspectives using TOPSIS
District / City
Economic
Social
Enviroment
All
Criteri
a
Pacitan
25
12
28
32
Ponorogo
24
7
19
31
Trenggalek
30
22
21
25
Tulungagung
12
24
31
16
Blitar
17
35
12
13
Kediri
10
37
20
14
Malang
2
11
37
10
Lumajang
22
31
17
30
Jember
1
16
35
11
Banyuwangi
6
38
16
2
Bondowoso
29
3
25
36
Situbondo
33
13
27
35
Probolinggo
20
10
18
29
Pasuruan
36
34
15
8
Sidoarjo
35
23
1
7
Mojokerto
7
26
24
4
Jombang
11
20
33
15
Nganjuk
26
33
32
38
Madiun
31
32
26
27
Magetan
32
28
22
26
BEST ICON 2018 - Built Environment, Science and Technology International Conference 2018
286

Ngawi
27
1
23
37
Bojonegoro
5
4
11
1
Tuban
3
21
36
12
Lamongan
13
25
34
24
Gresik
37
36
30
9
Bangkalan
28
2
14
34
Sampang
23
29
13
28
Pamekasan
21
27
29
33
Sumenep
16
30
38
23
Kediri City
34
14
8
5
Blitar City
15
15
3
21
Malang City
4
6
10
3
Probolinggo
City
18
17
7
20
Pasuruan City
19
8
6
22
Mojokerto City
14
5
2
19
Madiun City
9
9
4
17
Surabaya City
38
19
9
6
Batu City
8
18
5
18
The success of district/city performance in
sustainable regional development in East Java shows
that the areas in the top ten positions tend to be high
industrial areas and have rich agricultural resources.
Malang District and Malang City are included in the
top ten regions because they have extensive natural
resources in the form of agriculture compared to the
other district/cities.
Mojokerto, Sidoarjo, Pasuruan, Gresik, and
Surabaya regencies were in the top ten positions in
the evaluation of sustainable development because
these districts/cities have the characteristics of
industrial cities where regional economic
development is fairly rapid, as well as having high
investment and balanced public services in the
regions. Although the Bojonegoro and Banyuwangi
Ditricts are large areas, they are further away from
the center of the industrial areas; however, their
public service facilities are proportionate according
to their regions.
From the results of this analysis, the
implementation of MCDM using the FCM and
TOPSIS methods can be used as an alternative for the
evaluation of sustainable regional development in
East Java Province because there are groupings and
rankings. This is also supported by research on the
typology of competitiveness of the districts/cities in
East Java (Suliswanto, 2017). This research
explained the economic conditions and the strength
of competitiveness of each district/city in East Java.
However, some district/city rankings also had non-
conformities. This was possible due to the
preferences of economic, social and environmental
criteria. Therefore, other approaches that utilize other
methods are needed to accommodate differences in
these criteria preferences.
5 CONCLUSION
The results of clustering based on the indicators
of sustainable regional development in East Java
from the economic, social, environmental aspects by
using the method of Fuzzy C-Means was
successfully built and is deemed usable. Fuzzy C-
Means was able to group as four clusters, namely as
advanced, potential, developing, and under
developed regional clusters. This was based on
empirical data from the clustering results according
to the existing district/city conditions.
The results of the ranking of each district or city
in the evaluation of sustainable regional development
in East Java based on cluster results using the
TOPSIS method show several conformities with the
research of typology of competitiveness of
districts/cities in East Java in 2017 by Suliswanto.
The ranking results of the top ten were: Bojonegoro
district, Banyuwangi district, Malang city,
Mojokerto district, Kediri city, Surabaya city,
Sidoarjo district, Pasuruan district, Gresik district,
and Malang district.
REFERENCES
Abdurrahman. (2003). Pembangunan
Berkelanjutan dalam Pengelolaan Sumber Daya
Alam Indonesia. Seminar Pembangunan Hukum
Nasional VII. Bali: badan Pembinaan Hukum
Nasional Departemen Kehakiman dan HAM.
Azadnia, A. H., Saman, M. Z., Wong, K. Y., &
Hemdi, A. R. (2011). Integration Model of Fuzzy C-
Means Clustering Algorithm and TOPSIS Method for
Customer Lifetime Value Assessment . Prociding of
the 2011 IEEE IEEM , 16-20.
Bai, C., Dhavale, D., & Sarkis, J. (2014).
Integrating Fuzzy C-Means and TOPSIS for
Performance Evaluation: An Application and
Comparative Analysis . Elsevier , 4186-4196.
Fauzi, A. (2004). Ekonomi Sumber Daya Alam
dan Lingkungan, Teori dan Aplkasi. Jakarta:
Gramedia Pustaka Utama.
Jaya, A. (2004). Konsep Pembangunan
Berkelanjutan. Bogor: Institut Pertanian Bogor.
Oktariani, D. (2017). Sistem Pendukung
Keputusan Dalam Pemetaan Prioritas Perbaikan
Jalan dan Jembatan Nasional Di Provinsi Bengkulu
Menggunakan Metode TOPSIS dan Fuzzy C-Means.
Bengkulu: Universitas Bengkulu.
Putra, S. P. (2013). Pemilihan Pemasok Terbaik
dengan Metode TOPSIS Fuzzy MCDM (Studi Kasus:
The Implementation of Multi Criteria Decision Making (MCDM) for the Evaluation of Sustainable Regional Development in East Java by
Using the Fuzzy C-Means Method and Technique for Order Preference By Similarity To Ideal Solution (TOPSIS)
287

CV. Becik Joyo). Surabaya: Institut Teknologi
Surabaya.
Rani, C., Nessa, M., Faizal, A., & Samawi, M.
(2014). Aplikasi Metode Multycriteria Decision
Making(MCDM) dengan Teknik Pembobotan dalam
Mengidentifikasi dan Mendesain Kawasan
Konservasi Perairan Daerah di Kabupaten Luwu
Utara, Provinsi Sulawesi Selatan. Jurnal IPTEKS
PSP, vol.1 (2) , 146-164.
Rao. (2004). Evaluation of Metal Stamping
Layout Using a Combined Multiple Attribute
Decision Making Method. IE(I).
Suliswanto, M. S. (2017). Tipoogi Daya Saing
Kabupaten/Kota di Jawa Timur. Seminar Nasional
dan Gelar Produk 2017 , 981-985.
Tabucanon, M. T. (1988). Multiple Criteria
Decision Making In Industry. Netherlands: Elsenes
Science Publising Company Inc.
Zhang, L., Xu, Y., Yeh, C.-H., Liu, Y., & zhou,
D. (2016). City Sustainability Evaluation Using
MCDM with Objective Weights of Interdependent
Criteria. Journal of Cleaner Production , 1-27.
BEST ICON 2018 - Built Environment, Science and Technology International Conference 2018
288
