
Diabetic Retinopathy: Severity Level Classification based on Object
Detection (Microaneurysms, Hemorrhages, and Hard Exudates)
using Mathematical Morphology and Neural Networks
Fifi Diah Rosalina
1
, Dian C. Rini Novitasari
1
, Ahmad Hanif Asyhar
1
, Abdulloh Hamid
1
, Muhammad
Firmansjah
2
1
Department of mathematics, UIN Sunan Ampel, Surabaya, Indonesia
5
Departement of medical eye, Airlangga University, Surabaya, Indonesia
Keywords : Diabetic retinopathy, Mathematical morphology, morphology reconstruction, backpropagation
Abstract : According to WHO, the number of people with diabetes had reached approximately 422 million people in
2014. Most cases of diabetes in the world occur as type 2 diabetes which can result in serious complications
of vital organs such as the eyes, kidneys, and heart, causing death. Complications of diabetes often causes
people with Diabetic Retinopathy (DR) to be unaware of the disease for several years, which can lead to
permanent blindness. Early detection of DR is indicated by the presence of microaneurysms, bleeding, and
hard exudates. Five DR severity classifications which include normal, mild-NPDR, moderate-NPDR, severe-
NPDR and proliferative DR are performed using the backpropagation method. Detection methods for
microaneurysms and hemorrhages are based on diamond disc and morphology opening methods, while
detection of hard exudate features is based on morphology reconstruction methods and minimal area of images.
The area and perimeter of each feature is applied as a backpropagation input with 80% of training data and
20% of test data from the total of 53 image data. Four inputs with 150 hidden layers are arranged as a network
structure capable of producing MSE values of 0.000190 and an accuracy rate of 90.90%.
1. INTRODUCTION
The non-communicable disease of Diabetes Mellitus
(DM) is one of the highest causes of death in the
world. DM has received special attention from the
World Health Organization (WHO) which proclaims
sustainable development on the 2030 agenda.
Sustainable development is aimed at reducing the
mortality rate of 1.5 million deaths that occurred in
2012 and it is estimated that approximately 422
million adults in 2014 suffered from diabetes
globally (WHO, 2016). Additionally, WHO states
that DM can lead to various serious complications
that can attack a number of vital organs which can
lead to heart attack, stroke, kidney failure, leg
amputation, vision loss, nerve damage and fetal death
in pregnant women. Diabetes belongs to a group of
metabolic diseases characterized by hyperglycemia
due to damage to insulin secretion, insulin reaction,
or both (American Diabetes Assosiation, 2010).
Diabetes is divided into 2 types, the first is 1 diabetes
(T1D), which occurs when the immune system has
severe damage in the endocrine pancreatic beta cells
that causes the hormone insulin to be deficient in
vitamins (Stitt, et al., 2015). However, according to
(WHO, 2016) the exact cause of type 1 diabetes is
unknown and cannot be prevented, hence type 1
diabetics cannot survive without insulin. Type 2
diabetes (T2D) according to (WHO, 2016) is caused
by abnormal pancreatic conditions that cannot
produce the insulin hormone to control blood sugar
levels. This disease may be left undiagnosed for
several years because the symptoms are less marked,
resulting in worsening complications. The majority of
diabetics in the world are type 2 diabetes. T2D
complications include DR due to abnormalities in the
eye (Manullang, et al., 2015) where the eye blood
vessels lack oxygen and cause nerve swelling in the
retinal nerve (Yun, et al., 2008).
Early detection for DR identification can be
performed by detecting microaneurysms, bleeding,
and features of hard exudates. The study by Neera
Singh and Ramesh Chandra Tripathi on automatic
272
Rosalina, F., Novitasari, D., Asyhar, A., Hamid, A. and Firmansjah, M.
Diabetic Retinopathy: Severity Level Classification based on Object Detection (Microaneurysms, Hemorrhages, and Hard Exudates) using Mathematical Morphology and Neural Networks.
DOI: 10.5220/0008906300002481
In Proceedings of the Built Environment, Science and Technology International Conference (BEST ICON 2018), pages 272-280
ISBN: 978-989-758-414-5
Copyright
c
2022 by SCITEPRESS – Science and Technology Publications, Lda. All rights reserved
early detection of diabetic retinopathy using image
analysis techniques applied the concepts of
mathematical morphology and fuzzy grouping
methods to obtain feature extraction from nerves in
the retina (Singh & Tripathi, 2010).
This research guideline by the author was based
on two studies. The first study was the identification
of the different stages of diabetic retinopathy using
retinal optical images with the application of the
backpropagation method. The four classifications of
DR are: normal, severe NPDR, moderate NPDR and
proliferative DR, which was able to produce
sensitivity values of 91.7% and specificity of 100%
and also predictive accuracy up to 84% (Yun, et al.,
2008). The second study was carried out by
Handayani Tjandrasa et al on the classification of
non-proliferative diabetic retinopathy based on hard
exudate using soft margin SVM with a segmentation
process that gives good results of hard exudate
segmentation (Tjandrasa, et al., 2013).
Based on the results of studies by Handayani
Tjandrasa on good segmentation on the identification
of hard exudates, and Wong Li Yun which was able
to provide predictive results of 84% using the
backpropagation classification, the title of this
research is “The Classification of Severity of Diabetic
Retinopathy based on Object Detection
(Microaneurysms, Hemorrhages, and Hard Exudates)
using Mathematical Morphology and
Backpropagation”. The two focus points in this study
are the emergence of DR objects into five
classifications. The five classifications include mild
Non-Proliferative Diabetic Retinopathy (mild NPDR),
moderate Non-Proliferative Diabetic Retinopathy
(moderate-NPDR), Severe Non-Proliferative
Diabetic Retinopathy (severe-NPDR), and
Proliferative. The second point is the application of
the backpropagation classification method. The
results of the feature extraction values are applied as
input to the backpropagation method as the value of
the area and perimeter object.
2. COMPUTATIONAL METHOD
AND THEORY
2.1 Diabetic Retinopathy (DR)
DR will appear as a long-term risk due to pancreatic
conditions that are not able to control the sugar levels
in the blood which is circulated as a source of energy
for cells. If there is a large consumption of
carbohydrates in the body while the insulin hormone
that controls blood sugar levels cannot be produced
properly, there will be a buildup of glucose in the
blood that will increase in the eye's blood vessels. The
appearance of microaneurysms, hemorrhages, and
hard exudates can disturb the oxygen supply which
will cause signs of ischemia or lack of oxygen in the
blood vessels of the eyes and cause bleeding. The
identification of the appearance of microaneurysms is
the first sign of DR. This condition can develop into
bleeding which is marked by the appearance of hard
exudates until the growth of new blood vessels is fast
and brittle.
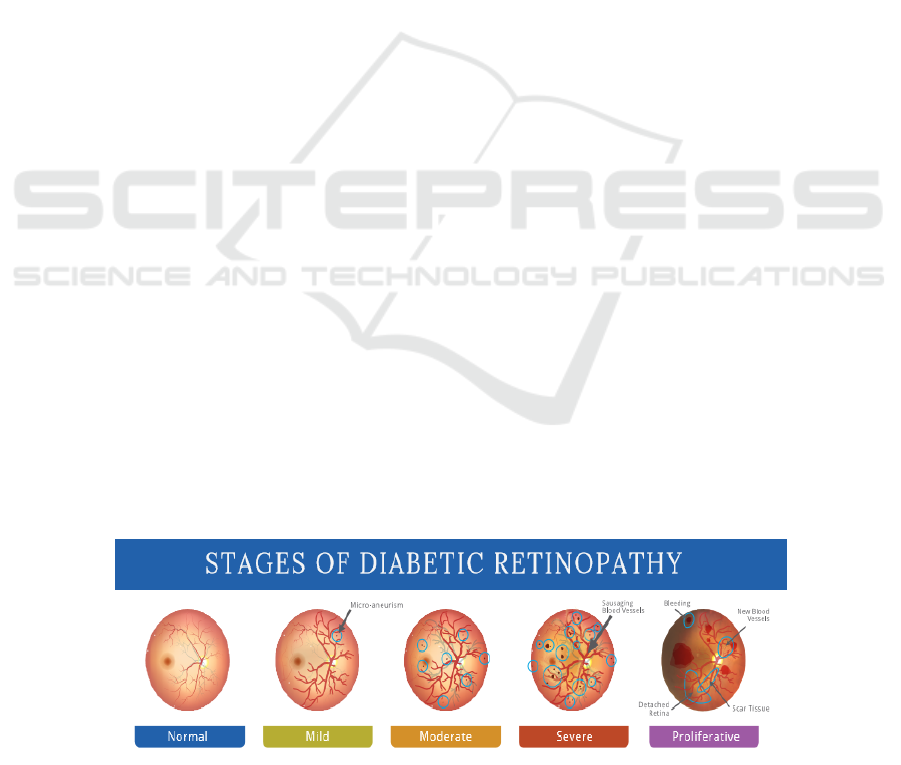
On a global scale, patients with DR are classified
into two types: NPDR and PDR. Whereas in this
study the two types of DR were divided into five
levels, as shown on Figure 2.1 (Dedeh, 2016). The
five levels of the DR are described as follows (Yun,
et al., 2008):
a. Normal: eye conditions are not impaired and are
functioning well so the normal eye structure does
not contain microaneurysms, bleeding or hard
exudates.
b. Mild-NPDR: at this stage, there will be a small
swelling in the retinal microvascular, called a
microaneurysm. Accuracy in detecting the
appearance of microaneurysms is a critical step
that determines the initial identification of DR
because the first abnormal condition that occurs in
the structure of the eye is the appearance of
microaneurysms (Dedeh, 2016).
Figure 1: Stages of DR
Diabetic Retinopathy: Severity Level Classification based on Object Detection (Microaneurysms, Hemorrhages, and Hard Exudates) using
Mathematical Morphology and Neural Networks
273

c. Severe NPDR: the number of microaneurysms are
rising, which causes the retinal area to lose blood
supply and cause signs of ischemia such as
bleeding. This stage is marked by the presence of
hard exudates.
d. PDR: this stage is the advanced stage of the DR
which is characterized by vasoproliferative results
from the retina which causes abnormal and brittle
growth of new blood vessels.
2.2 Adaptive Histogram Equalization
(AHE)
The histogram is a graphical display that is used to
show the distribution of data visually or how often
different values occur in a dataset (Kho, 2018). The
histogram provides information about variations in
the process and helps management in making
decisions as an effort to improve the sustainable
process (Murinto, et al., 2008). The image is
considered great if the gray level region has even
distribution on each pixel intensity value. To increase
image contrast from a small object texture, the AHE
method is applied to improve image quality to
increase the portion of the texture for the image
(Hadinegoro, et al., 2012).
Adaptive Histogram Equalization (AHE) is a
development of improved HE quality introduced by
Pizer (1987) that is applied to natural images and
medical images to provide better object clarity
(Lusiana, et al., 2014). The HE method will calculate
histogram equalization once for all images on each
block, then the AHE method for histogram
equalization is done several times for each block of n
× n image. The calculation for each image block is
solved by the following equation 1 to 3 (Woods, et al.,
2004).
,
1
2
0,1,2,…, 1
3
where :
: Range of gray degrees
: The biggest gray level
: Average of initial gray level
: Initialization of the histogram
: Amount of all pixels
: Average gray level (cumulative frequency)
: Result of equalization histogram
2.3 Morphology Opening
Morphology operation is the process of modification
of each point that corresponds to the modification of
the object being observed, or is an operation based on
a segment or part in the image that becomes the focus
of attention (Ekanita, 2004). Element structure in
morphology operations is the basis for determining
the accuracy of the results of object recognition in the
image. Element structure is defined as a set of small
sub-images that are used to recognize object shapes
in the image (Prasetyo, 2012).
Opening is an erosion process followed by
dilation. It is usually used to eliminate noise, make
the object boundary smoother, and be able to maintain
the size of the object with the actual size. Erosion is a
technique of reducing or eroding the edge of an object
with the calculation shown in Equation 4.
⊖
∈
|∈for∈
4
Dilatation is the opposite of erosion operations,
namely the technique of enlarging an image object by
adding layers around an object using the calculation
shown in Equation 5.
⊕
∈
|,∈,∈
5
Where :
A :State of the set of binary image elements, namely
the N dimension in black and white
B : Another set of binary image elements, namely the
N dimension in black and white
:Vector set (coordinates) in Euclid space
2.4 Morphology Reconstruction
Morphology reconstruction is a segmentation process
to distinguish objects observed with other objects.
Reconstruction is defined as the transformation of the
learning structure or form of objects based on two
images together with one element structure (Prasetyo,
2012). The two images are a starting point or marker
in the transformation process. Another image is a
mask or cover to resolve the constraints of the
transformation process. The element structure applies
to define connectivity for two images as a
reconstruction process.
The image as a mask is symbolized as and
as a marker in which morphology reconstruction
from as
is defined by the steps in the
following equation (Prasetyo, 2012).
a. Initialization of
as an image marker
b. Specify the structure of element to be applied
c. Repeat the calculation of Equation 6
⊕
∩6
d. Until the results are obtained like Equation 7
7
BEST ICON 2018 - Built Environment, Science and Technology International Conference 2018
274

Mask of must contain markers of or image
of marker must be part of , which is defined by
Equation 8
⊆ 8
The accuracy in determining the image that
applies as a mask and marker in binary or grayscale
images plays an important role in the results obtained
from the morphology reconstruction process on two
different images.
2.5 Backpropagation
The structure of the neural backpropagation network
has a training process to balance the network's ability
to recognize the patterns used during training. The
backpropagation method is able to provide the right
response to input patterns with training patterns, so
that weighting is carried out in the training process as
a digging factor from other input patterns. The steps
of the backpropagation algorithm are resolved as
follows:
a. Network Initialization (determines the activation
function)
2
1
19
b. Progressive propagation
1. Sum weight bias signal and the input value in the
hidden layer unit
10
11
Then dispatch the signal to all output units.
1. Each output unit Y
k
sum the weight of the input
signal to the output node
_
∑
12
_
13
c. backward propagation
1) Each unit of output Yk receives a target pattern
according to the pattern of training inputs and
calculates an error value
′
_
14
1
Calculation of correlation weighting and calculation
of bias correction
∆
15
∆
16
2) Add the delta input based on the errors in each
hidden unit to calculate the error factor δ
_
17
_
′
_
18
Calculate the weight correction using
∆
19
And calculate the correction bias with
∆
20
d. Weight changes
1) Weight changes of Y
k
and bias j
∆
21
Change the weight of each hidden unit
and bias
∆
22
2.6
Mean Square Error (MSE)
Mean Square Error (MSE) is a method that can be
used to evaluate the overall error rate of the output
value of the target value. MSE is the average value
that is obtained by summing all errors from the
difference in target value and output value.
The application of MSE in this study is used to
see the error rate of output values and targets of the
image classification used in training data. This
happens as a process of building a backpropagation
structure for the classification of diabetic retinopathy
images that have been validated at the Dr. Soetomo
Hospital before finally being applied to the testing
data.
The target classification value of the training
data is guided by the binary code in Table 2, which
consists of binary code for the classification of
normal to proliferative images. If the MSE obtained
from the training process gives the smallest possible
value, it can be interpreted that the error rate of the
output value with the target value towards the point
of error is minimal.
The smallest MSE value may indicate the
amount of training data that was correctly classified,
so that the best weighted stored can be applied to test
the classification of diabetic retinopathy images in
testing data.
3. RESEARCH METHOD
3.1 Data
The data used in this study were fundus images
obtained from the DIARETDB website and validated
by the ophthalmologist at Airlangga University.
Digital image data used in training and testing
amounted to 53 data where 80% of the data was used
in the training process, with 42 data used to obtain the
pattern in the classification process. 20% of the data
was tested with 11 image data to test the accuracy of
the designed system. The process of testing the
Diabetic Retinopathy: Severity Level Classification based on Object Detection (Microaneurysms, Hemorrhages, and Hard Exudates) using
Mathematical Morphology and Neural Networks
275
classification of the severity of DR was from the data
images of normal retinal conditions to those with
diabetic proliferative retinopathy or rise of swelling
and bleeding in the eye's nerves. The data was then
entered into five stages in a flexible image format and
was usually stored as 8 bits or 16 bits of each color R,
G, B.
3.2 Identification of Hemorrhages and
Hard Exudates
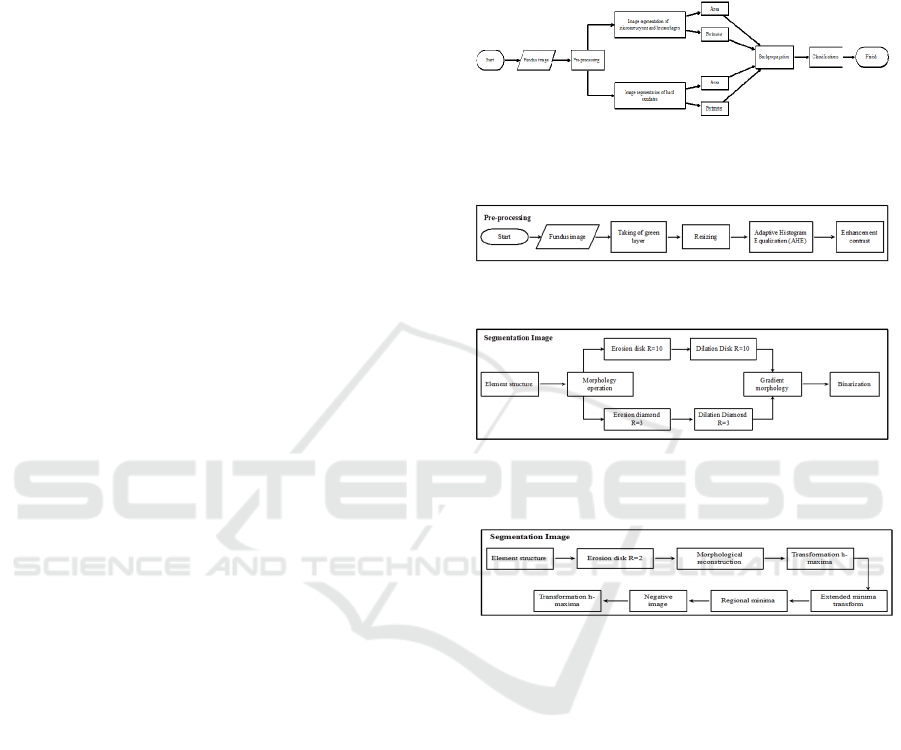
The identification of the three objects in this study
had different image properties. The image processing
carried out in this study was divided into two
segmentation processes. The first process was carried
out using opening morphology surgery for the
identification of microaneurysms and hemorrhages.
The second process applied morphology
reconstruction methods and minimal areas of imagery
that were applied to identify hard exudates. In general,
the completion algorithm for both processes is shown
on Figure 2.
3.3 Pre-Processing Images
The fundus image that was applied as input was an
RGB type image with a .tif data format. Resizing was
done due to the fundus image data having different
pixel sizes, so if it is still done then the calculation of
the area and perimeter values of the object would not
be equal. The level of object clarity on pre-processing
affects the segmentation process in distinguishing
objects from other objects.
3.4 Segmentation of Microaneurysms
and Hemorrhages
The two opening operation processes were reduced to
provide better clarity on the edges of the object and
binarized to obtain segmentation results in black and
white. A white image indicates the object being
observed, while black indicates the background of the
image. The area and perimeter values from the results
of this segmentation feature extraction processes that
apply as input to the backpropagation structure.
3.5 Segmentation of Hard Exudates
Image segmentation was used to identify hard
exudates based on the morphology reconstruction
methods from the two images. Two selected images
contributed to the accuracy of the segmentation
results obtained. The image acting as a marker was an
image of the contrast improvement effect using AHE,
while the image that acts as a mask is the image of the
result of erosion. After the segmentation process was
carried out, the area and perimeter values of the
segmentation results apply as input to the
backpropagation method.
Figure 2: Flowchart of the identification of microaneurysms,
hemorrhages, and hard exudates
Figure 3: Flowchart of pre-processing images
Figure 4: Flowchart of segmentation microaneurysms and
hemorrhages
Figure 5: Flowchart segmentation of hard exudates
3.6
Classifications of Backpropagation
The backpropagation method is applied to study the
input pattern and the intended target based on the
number of hidden layers, learning rate, and the
number of iterations that have been determined.
Quantization of area features and perimeter
microaneurysm extractions, hemorrhages, and hard
exudates was applied as input with a number of five
outputs as shown on Figure 6. A decision was made
from the results of classification of the
backpropagation and built with the binary code that
determined the five classifications of DR.
BEST ICON 2018 - Built Environment, Science and Technology International Conference 2018
276
1
2
3
4
1
2
3
4
5
6
7
8
9
10
1
2
3
4
5
Input area Ma
dan Hm
Input perimeter
Ma dan Hm
Input area Ha
Input perimeter
Ha
Hidden layer
Normal
Mild-NPDR
Moderate-NPDR
Severe-NPDR
Proliferative DR
1
1
Figure 6: Structure of backpropagation classification
4. RESULTS AND DISCUSSION
The results were segmented based on the stages in
Figure 4 based on the extraction of area features and
perimeter of the microaneurysm objects,
hemorrhages, and eye blood vessels. This condition
occurs because the eye blood vessels were not
eliminated in the segmentation process due to
requiring additional methods. Microaneurysms,
hemorrhages, and eye blood vessels were calculated
as area values and perimeter objects were applied to
the backpropagation input.
Figure 7: Original images of identification of micro-
aneurysms and hemorrhages
Figure 8: Perimeter identification of microaneurysms and
hemorrhages
The identification process of hard exudates was
then carried out to detect the existence of hard
exudates. Pre-processing was carried out in the same
way as the detection of microaneurysms and
hemorrhages because the initial results and image
quality improvement can provide better results to
show hard exudates. However, the segmentation
process was carried out using morphology
reconstruction methods and a minimum area of image
that separates hard exudates into black levels
.
Figure 9: Original images of the identification of hard
exudates
Figure 10: Perimeter of the identification of hard exudates
The segmentation process of hard exudates in
Figure 10 provides identification with great results for
the identification of small objects. Optical disks that
have the same color intensity as hard exudates are
segmented as observed objects because the
elimination of optical disk is not performed because
it requires additional methods. This condition will
Diabetic Retinopathy: Severity Level Classification based on Object Detection (Microaneurysms, Hemorrhages, and Hard Exudates) using
Mathematical Morphology and Neural Networks
277
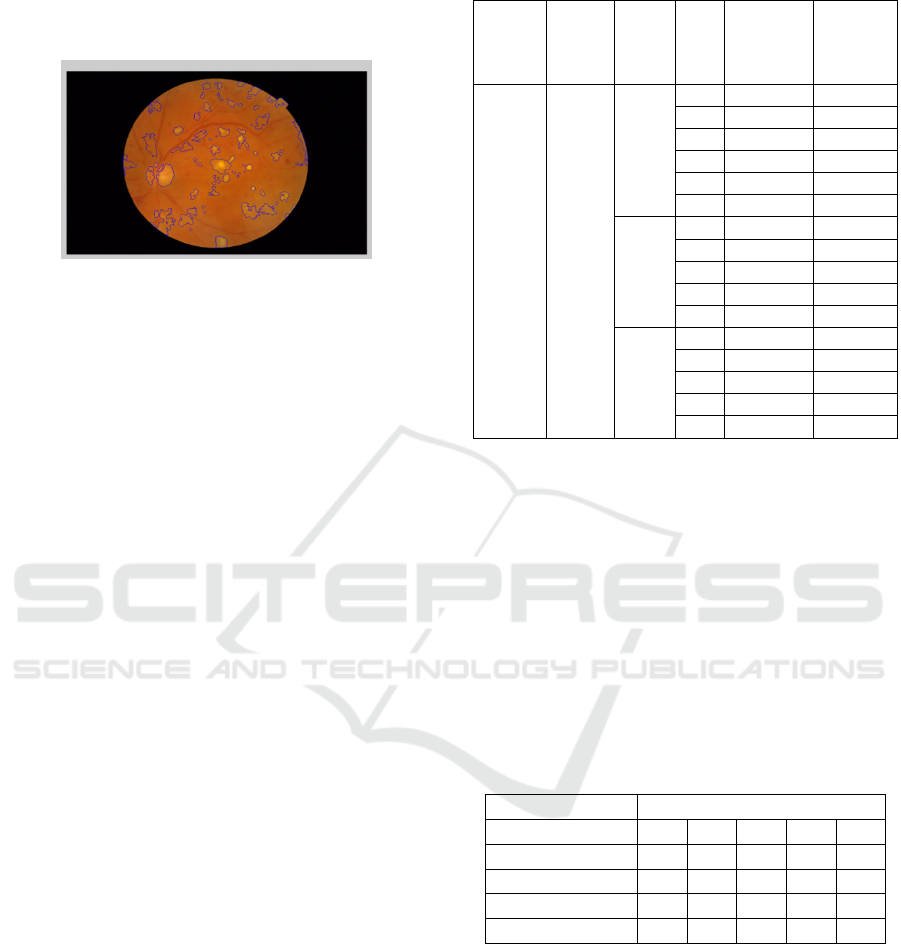
certainly bring the area and perimeter of the hard
exudates. A comparison between hard exudates with
the initial image can be seen on Figure 10.
Figure 11: Perimeter of the hard exudates in the original
image
The number of transformations of the hidden
layers and LR values are applied as guidelines to
obtain the best pattern recognition generated from the
specified backpropagation structure. The
backpropagation structure and results of the training
and testing processes of the three objects are
identified for the five classifications, as shown on
Table 1.
From the the results of training and testing in
Table 1, it can be concluded that the more hidden
layers are used, the error value obtained from the
training results will also be smaller, but a small error
value of the training results does not always
determine that the results of testing accuracy are
getting better.
Furthermore, the preparation of backpropagation
structures of different LR and HL values of 25 to 150
show different MSE results. Table 1 provides an
explanation that the smaller LR value in the
backpropagation structure learning process towards
the specified target value (binary code in Table 2) can
produce a smaller MSE value, where at LR 0.1 the
largest accuracy value was 54.55%, LR 0.01 was
72.72% and the smallest LR 0,001 was given
accuracy to 90.90%. The smaller the LR value and the
greater the number of HL, the better the learning
process of the target value can be implied to the small
error value and the opportunity to attain better
accuracy.
The accuracy values in Table 1 represent the
number of testing data that was correctly classified
from all 11 testing data. The magnitude of the
accuracy value obtained shows that more and more
testing images were correctly classified.
Table 1: Training and testing of the five classifications
Data
trainin
g
80%
Data
testin
g
20%
LR HL MSE Accurac
y (%)
42
data
11
data
0,1 25 0,0901 45,45
50 0,0410 45,45
75 0,0288 45,45
100 0,0281 45,45
125 0,00683 54,55
150 0,000783 54,55
0,01 50 0,0326 45,45
75 0,00756 45,45
100 0,00305 72,72
125 0,00397 45,45
150 0,000792 54,54
0,001 25 0,0854 36,36
75 0,00826 36,36
100 0,00405 45,45
125 0,0205 72,72
150 0,000190 90,90
Image classification from the results of the
training and testing of backpropagation structures
resulted in a total output of five and was determined
based on binary code. The binary code that was
formed for the classification of the five levels of
severity is shown on Table 2. The binary code was
applied as a target of the backpropagation structure
that resulted in the five different output values. The
largest backpropagation output value is represented
by the binary code 1, while the other is 0, so that the
numbers 1 and 0 represent the results of certain
classifications of the tested image.
Table 2: Binary code
Binary code
Mild-NPDR 1 0 0 0 0
Moderate-NPDR 0 1 0 0 0
Normal 0 0 1 0 0
Proliferative 0 0 0 1 0
Severe-NPDR 0 0 0 0 1
The percentage of the correctness level of the DR
severity classification was obtained by dividing the
classified data by the total number of tested images.
The best accuracy results based on Table 1 were
formed in the backpropagation structure of LR 0.001,
HL of the amount of 150 with MSE of 0.000190 and
an accuracy of 90.90%.
The results of the backpropagation classification
on 11 data testings resulted in 10 data that was
classified correctly and 1 data that was classified
incorrectly. True classified images include two mild-
BEST ICON 2018 - Built Environment, Science and Technology International Conference 2018
278

NPDR images, 3 moderate-NPDR images, one
normal image, two proliferative images, and 2 images
of severe-NPDR.
Area and perimeter values from feature extraction
that were applied as backpropagation inputs allowed
mild classes to enter the range value of moderate
classes. This condition also occured in the classes
from other classifications. Several studies on the
classification or identification of many DR
complications tend to focus on one type of object such
as microaneurysms or hard exudates. If the DR
severity classification was based on the three objects
as in this study, the segment will only produce
objects that are detected without involving optical
disks, eye veins and other objects that were not
observed. From the classification process, only
results in the observed object segmentation of DR
severity will achieve the best results.
The best process of image processing to produce
object segmentation was determined by the accuracy
of the classification results and was built on the
backpropagation structure which impacted the size of
the MSE value and the value of accuracy. As
observed on Table 1, the smaller MSE values tend to
produce better accuracy values, but also depend on
the value of the feature extraction area and perimeter
which was applied as input for the classification of
the severity of diabetic retinopathy. This allows MSE
training results with a small value, but results in a test
accuracy value that is not large enough; this condition
is influenced by each image data which has different
lighting, image contrast, image structure to the level
of clarity of different objects.
5. CONCLUSION
Based on the identification of microaneurysms,
hemorrhages and hard exudates, the classification of
the three objects according to the five severity levels
of DR is described as the following three points:
1. The disk mathematical morphology method of
10 and diamond of 3 can be applied to
visualize the object being observed with the
background of the image
2. The hard exudates segmentation in this study
resulted in the identification of objects observed
in the black level criteria. However, the next step
of using regional minima results shows that the
exudates in the area was not segmented as an
object. Therefore the process of using regional
minima can be replaced by other methods to better
visualize the exudates
3. The best accuracy results were directly
proportional to the number of correctly identified
images obtained in the specified backpropagation
structure and achieved an accuracy of 90.90%.
The highest accuracy values were obtained with
10 correctly classified images from the 11 images
tested.
REFERENCES
Akram, M. U. et al., 2013. Detection and classification of
retinal lesions for grading of diabetic retinopathy.
Computers in Biology and Medicine, Elsevier, Volume
45, p. 162.
American Diabetes Assosiation, 2010. Diagnosis and
Classification of Diabetes Mellitus. Diabetes Care,
33(1), p. 562.
Dedeh, M., 2016. Image of Ruostejarvi.org. Diabetes and
Blindness, 9 October.
Ekanita, D., 2004. Operasi morfologi pada suatu berkas
citra monokrok*.BMP menggunakan perangkat lunak
Matlab versi 6.5. In: Skripsi. Yogyakarta: Universitas
Sanata Darma, pp. 33-35.
Hadinegoro, Ahmad, N. & Arifyanto, 2012. Metode
Histogram Equalization untuk Perbaikan Citra Digital.
Semantik, p. 440.
Kho, B., 2018. Ilmu Management Industri. Pengertian
Histogram dan Cara Membuatnya, Januari, pp. 1-2.
Lusiana, Hartono, B. & Veronica, 2014. Analisa Teknik
Adaptive Histogram Equalization dan Contrast
Stretching untuk Perbaikan Kualitas Citra. Teknologi
Informasi Dinamik, p. 3.
M. Usman Akram, d., 2013. Detection and classification of
retinal lesions for grading of diabetic retinopathy.
Computers in Biology and Medicine, Elsevier, Volume
45, p. 162.
Manullang, Y. R., Rares, L. & Sumual, V., 2015. Prevalensi
Retinopati Diabetik Pada Penderita Diabetes Melitus Di
Balai Kesehatan Mata Masyarakat (Bkmm) Propinsi
Sulawesi Utara Periode Januari – Juli 2014.
Murinto, Putra, W. P. & Handayaningsih, S., 2008. Analisis
perbandingan histogram equalization dan model
Logarithmic Image Processing (LIP) untuk image
enhancement. Informatika, 2(2), pp. 4-6.
Prasetyo, E., 2012. Pengolahan Citra Digital dan
Aplikasinya menggunakan Matlab. s.l.:Teknik
Informatika.
Singh, N. & Tripathi, R. C., 2010. Automated Early
Detection of Diabetic Retinopathy Using Image
Analysis Techniques. International Journal of
Computer Applications, 8(2), p. 4.
Stitt, A. W. et al., 2015. The progress in understanding and
treatment of diabetic retinopathy. In: Progress in
Retinal and Eye Research. Northern Ireland, UK: s.n.,
p. 5.
Tjandrasa, H., Putra, R. E., Wijaya, A. Y. & Arieshanti, I.,
2013. Classification of Non-Proliferative Diabetic
Diabetic Retinopathy: Severity Level Classification based on Object Detection (Microaneurysms, Hemorrhages, and Hard Exudates) using
Mathematical Morphology and Neural Networks
279

Retinopathy Based on Hard Exudates sing Soft Margin
SVM. IEEE, p. 278.
WHO, 2016. Global Report On Diabetes, France: WHO
Library Cataloguing-in-Publication Data.
Woods, Gonzalez, R. C. & Richard, E., 2004. Digital Image
Processing Second Edition. New York: Prentice Hall.
Yun, W. L. et al., 2008. Identification of different stages of
diabetic retinopathy using retinal optical images.
Information Sciences, ScienceDirect, 178(2008), p. 1.
BEST ICON 2018 - Built Environment, Science and Technology International Conference 2018
280
