
Oil Spill Simulation for Analysis of Environmental Mitigation in
Cilacap Coastal Areas
Mauludiyah
1
and Mukhtasor
2
1
Department of Marine Science, Universitas Islam Negeri Sunan Ampel, Jl. A Yani 117, Surabaya, Indonesia
2
Department of Ocean Engineering, Institut Teknologi Sepuluh Nopember, Surabaya, Indonesia
Keywords: simulation, oil spill, mitigation, Cilacap.
Abstract: The frequency of oil spills in Cilacap coastal area is high enough to cause ecological and economic
consequences. Based on data from various sources, during the period 1989-2015, there were 17 cases of oil
spills occurred in Cilacap coastal area, 12 were due to tanker accidents and 5 cases due to leaked pipes. Oil
spills often result in both environmental damage and social and economic losses. The main objective of this
work is to do simulation of an oil spill in Cilacap area under different environmental conditions to facilitate
the mitigation for oil spill emergencies at sea by local authorities. To estimate the distribution of oil, referring
to the King Fisher case which occurred on 1 April 2000 in Cilacap area, a spill with 2,500 ton of crude oil
was simulated by MoTum from January to December. The model approach was done by taking into account
the effects of wind, tide, bottom friction, and turbulence. The simulation results reveal that the trajectory of
the oil depends on hydrodynamic forces and highly depends on meteorological conditions, such as wind. The
simulation results also show that Teluk Penyu area, the eastern part of Nusakambangan Island, and Donan
River estuary are area with a high probability of pollution. The mitigation associated with accidental spills
can use one or several approaches, i.e., technology, socio-cultural-economic and institutional and stakeholder
approaches.
1 INTRODUCTION
Accidental large oil spills are one of the disasters and
become important problems that occur in marine and
coastal areas. Accumulatively, an oil spill usually has
a huge impact on marine and coastal environment.
This will directly or indirectly affects fisheries
productivity which is very dependent on
environmental quality. The economic losses will be
greater if the oil spills occur in areas that have high
fisheries production, such as Cilacap coastal areas. It
will mainly impact fishermen who depend on marine
and coastal resources.
Based on data compiled from various sources,
during the period of 1989-2015, there were 17 oil spill
cases that occurred in Cilacap coastal areas, with 12
cases were caused by ship accidents and 5 cases were
due to pipe leakage. Some of the oil spills that have
occurred have shown that Cilacap coastal areas are
vulnerable to oil pollution. Moreover, the traffic
intensity of tankers carrying crude oil as well as oil
refinery produced by Pertamina Refinery Unit IV
Cilacap to Tanjung Intan Port is quite high, with an
average of 70 ships per month.
Oil spills that often occur in Cilacap coastal areas
will have an impact on the marine and coastal
resources. In addition, oil spill will also affect the
economic life of the community which depends on
the location around the occurrence of oil spills. The
Ministry of Environment stated that economic losses
due to the King Fisher ship accident in Cilacap coastal
areas in 2000 reached 272 billion rupiah
(Jayawardana, 2006). For this reason, an
environmental mitigation effort is needed related to
the risk of oil spills in the Cilacap coastal area.
In general, environmental mitigation is an effort
to prevent negative impacts that are expected to occur
or have occurred due to the planning of an activity.
Environmental mitigation can also mean efforts to
overcome the negative impacts that arise as a result of
an activity. According to Law of The Republic of
Indonesia Number 24 of 2007, mitigation is defined
as a series of efforts to reduce disaster risk, both
through physical development and awareness and
capacity building to face disaster threats.
Mauludiyah, . and Mukhtasor, .
Oil Spill Simulation for Analysis of Environmental Mitigation in Cilacap Coastal Areas.
DOI: 10.5220/0008905700002481
In Proceedings of the Built Environment, Science and Technology International Conference (BEST ICON 2018), pages 361-366
ISBN: 978-989-758-414-5
Copyright
c
2022 by SCITEPRESS – Science and Technology Publications, Lda. All rights reserved
361
Mitigation is done to minimize or to reduce the
possible impacts of a disaster. Therefore, mitigation
can reduce and/or eliminate victims and losses that
may arise. Mitigation must be carried out for all types
of disasters, both those included in natural and man-
made disaster, including oil spills.
In order to prevent and mitigate the risk of oil
spills in the Cilacap coastal area, this study aims to
simulate an oil spill under different environmental
conditions that will provide predictive distribution of
oil when spilled in the Cilacap coastal areas. The
results of the analysis are expected to minimize the
impact, both environmental and socio-economic
impact, that will be caused by oil spill.
2 METHODS
2.1 Simulation Model
In order to estimate the distribution of oil spills in
Cilacap coastal areas, MoTuM (Modul Tumpahan
Minyak) developed by Muin was used. This software
is used to simulate hydrodynamics and the movement
of oil spilled in open seas, straits, bays, or estuaries.
The software generates a series of outputs after the
simulation: the hydrodynamic model, the spread of
oil particles and thickness/oil concentration (fates and
trajectory model), the probability of the stochastic
model, and the probability of the location of oil
pollution sources (receptors model).
MoTuM uses the methodology of combining the
Three-Dimensional Model of Non-Orthogonal
Hydrodinamic Curvilinear Coordinat Technique and
the Oil Spill Model. Hydrodynamics model is based
on tides, current and wind databases. This model is
able to simulate the pattern of three-dimensional
ocean currents due to tides, wind, density, and
influence of rivers. Model applications have been
carried out in several locations such as Fundy Bay
(Canada), Narraganset Bay and Savannah River
(United States), and Ajkwa (PT Freeport Indonesia).
2.2 Model Input Parameters
Data input used in the hydrodynamic model is
bathymetric map, tides, wind speed and direction,
eddy viscosity value, and seabed roughness
coefficient. Bathymetry data from the study area were
obtained from the Pushidrosal (Hydrography and
Oceanography Center, Indonesian Navy). Tidal data
used in this study are the tidal constituent at the
Cilacap Tidal Station from Geospatial Information
Agency with Formzahl number 0.3436, which
indicates that mixed tides, prevailing semidiurnal, are
predominant in the Cilacap coastal areas. Wind data,
in the form of direction and speed, used were 2010
wind data that were obtained from Meteorological,
Climatological, and Geophysical Agency.
In this study, it was assumed that eddy viscosity
was considered constant, 1 m2/s and 0.001 m2/s for
horizontal and vertical direction, respectively. This
parameter is not a fluid property but flow property so
that the value is very dependent on the current and
roughness of the seabed (Muin, 2005). The average
value of seabed roughness coefficient, which is
commonly used in the application of marine
hydrodynamic models, ranges from 0.001 to 0.005.
Therefore, the value of 0.002 was adapted in this
study.
Furthermore, the oil spill model requires a series
of parameters of different kind. Some of the spill
parameters required are geographical coordinates of
the spill, type and quantity of the spill. In addition,
environmental parameters are also included, i.e., eddy
diffusivity, temperature of the sea and air, and
sediment concentration.
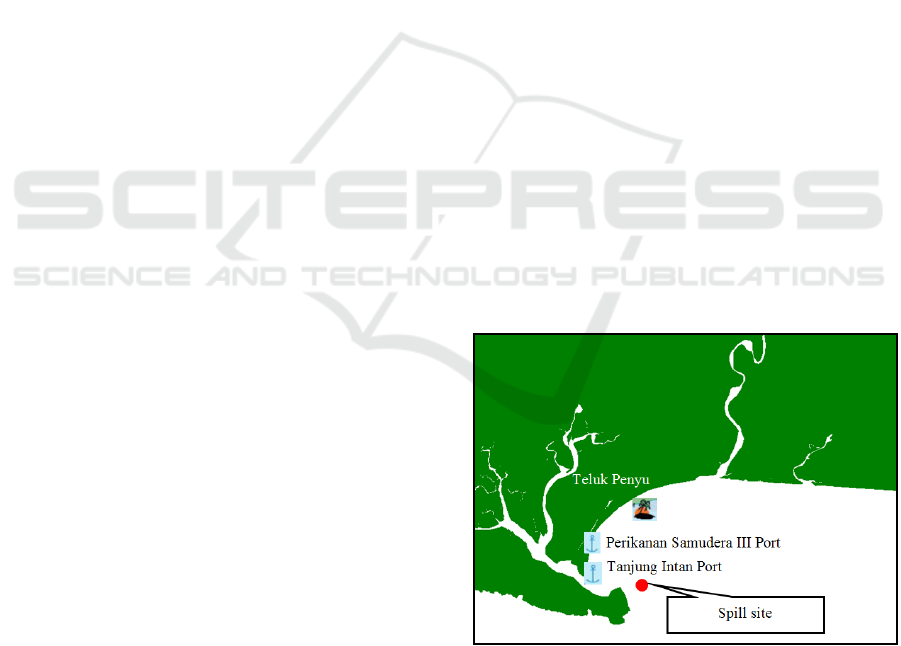
The location of the oil spill is 109˚02'57.9" and
07˚45'09" in longitude and latitude, respectively,
referring to the location of the King Fisher oil spill
that occurred in the Cilacap coastal area in 2000
(Figure 1). The simulation was done with a volume of
2,500 tonnes of crude oil in 12-month period, from
January to December. The value of 2,500 tonnes was
chosen based on the average volume data of oil spills
that occurred in Indonesia.
Figure 1. The location of the King Fisher spill
In this study, eddy diffusivity value is determined
at 100 m2/s which is the value of the diffusion
coefficient for the open bay (Joseph, et al., 1998 in
Butyliastri, 2009). Sea water temperature in the
simulation was 27˚C (BAPPEDA Cilacap &
BEST ICON 2018 - Built Environment, Science and Technology International Conference 2018
362
Diponegoro University, 2001). The air right above the
water was assumed to have the same temperature as
the water surface. The sediment concentration in this
study was assumed to be 5 ppm. According to
Hartami (2008), suspended sediments concentration
ranging from 5 to 25 ppm is considered to be good in
marine aquaculture ecosystems and Cilacap coastal
areas were well known for their marine fishery
production.
2.3 Model Evaluation
Before being used to model the distribution of oil
spills in Cilacap coastal areas, the model was first
evaluated with field case. The field case used in this
evaluation is the oil spill data from the MT King
Fisher, which occurred on April 1, 2000 at 16.00 in
Cilacap coastal areas. MT King Fisher, the Maltese-
flagged tanker, ran aground after crashing into the
reefs in 3 and 5 buoys of the Port of Tanjung Intan
Cilacap in the eastern tip of Nusakambangan Island,
Cilacap. The location of the King Fisher oil spills is
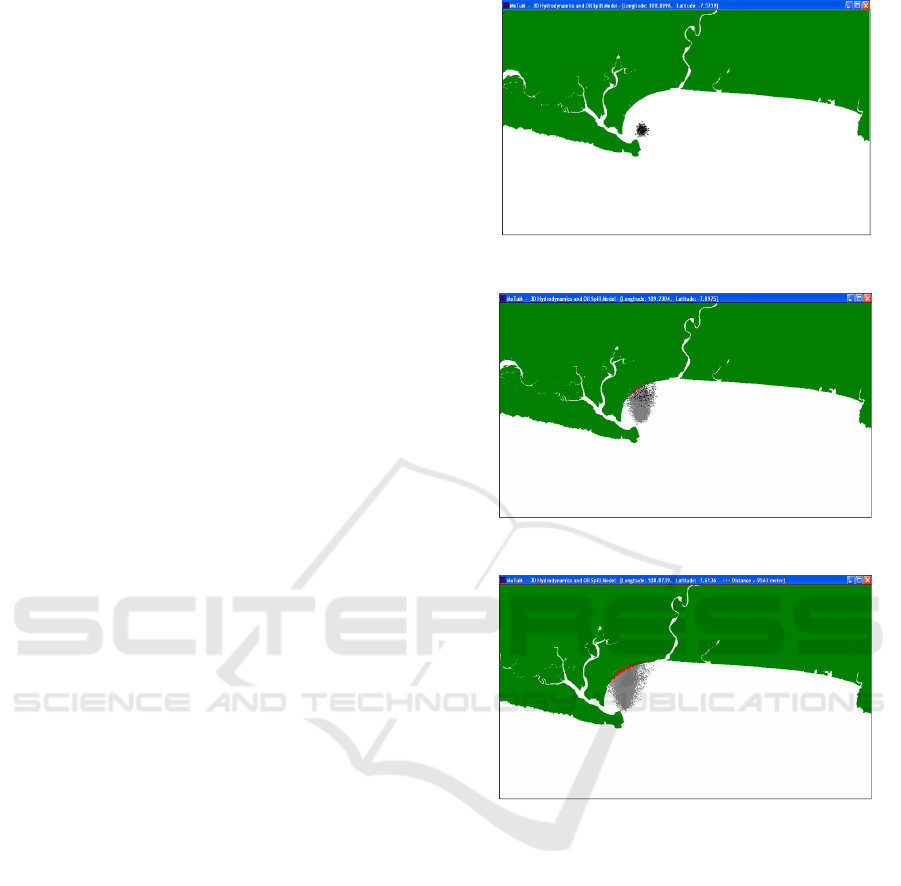
given in Figure 2.
The simulation began at 16.00 with a volume of
4000 barrels of crude oil. When the King Fisher oil
spill occurred on April 1, 2000, Meteorological,
Climatological, and Geophysical Agency informed
that the wind blowing from the south with velocity of
10 knots. Figure 2 shows the trajectory of the oil spill
that occurred after 1 hour. The oil spill began to move
northward. This movement was influenced by the
direction of the wind that blew from the south. Figure
3 shows the oil spill has reached the coast after 6
hours and 40 minutes of simulation. After 24 hours,
the area of the oil spill gets larger and the distance of
the oil spill is also further away, as shown in Figure
4.
MoTum simulation results show that the length of
the coastline affected by the oil spill is 9567 m (Figure
4). Meanwhile, the news related to the King Fisher oil
spill informed that the oil spill was spread over 10
kilometers from Area 70 (Cilacap Village), Teluk
Penyu coast, Nusakambangan Fishing Port, to Tegal
Katilayu and Lengkong coast. This result showed a
reasonable agreement between simulation result and
field case.
Figure 2. King Fisher spill position after 1 hour.
Figure 3. King Fisher spill has reached the coast.
Figure 4. King Fisher spill position after 24 hours.
3 APPLICATIONS AND RESULTS
The first objective of this work is to do a series of
simulation of crude oil of Cilacap coastal area, of
which geographical coordinates belong to a latitude
of 07˚45'09" and a longitude of 109˚02'57.9”,
referring to the King Fisher case. Simulations are
done with 2500 tonnes for crude oil. Twelve
simulations were done considering the hypothetical
cases explained above.
As it can be observed, the model shows the most
probable trajectory of the spill depends on the current
and wind pattern as the oceanographic and
meteorological conditions. From the simulation
results, it was found that the contribution of surface
wind to the distribution of oil spills was quite large.
Oil Spill Simulation for Analysis of Environmental Mitigation in Cilacap Coastal Areas
363
Consequently, it is possible to know if the spill
reached the coast and, in this case, when and where it
would impact the coast.
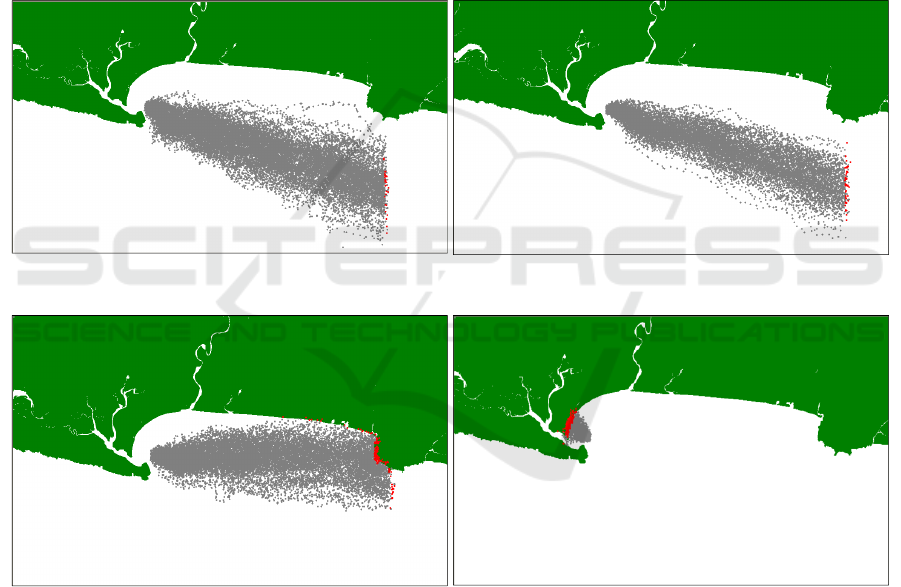
Simulation results showed that in January, oil
spills spread to the southeast (Figure 5). In February
and March, oil spills spread eastward (Figures 6 and
7). In April, oil spills spread to the northwest (Figure
8). In May and June, oil spills spread to the west and
the south (Figures 9 and 10). Oil spills spread
westward in July, August, September, and October
(Figures 11-14). Whereas in November and
December, oil spills spread to the southeast (Figures
15 and 16).
The simulation results also show that the coastal
area of Teluk Penyu, the eastern end of
Nusakambangan Island and the estuary of the Donan
River are the area that have the highest polluted
probability level. In addition, Widarapayung Beach
and Ketapang Indah Beach also have risk of being
contaminated by oil spills. It can be known from
simulation results in the March scenario, as shown in
Figure 7.
These areas have high biodiversity and are tourist
destination in Cilacap Regency so that if the area is
contaminated by oil, the potential for economic losses
will be very high. The areas that have the probability
of oil contamination are shown in Figure 17.
Figure 5 and 6. Simulation results in January and February, respectively.
Figure 7 and 8. Simulation results in March and April, respectively.
BEST ICON 2018 - Built Environment, Science and Technology International Conference 2018
364
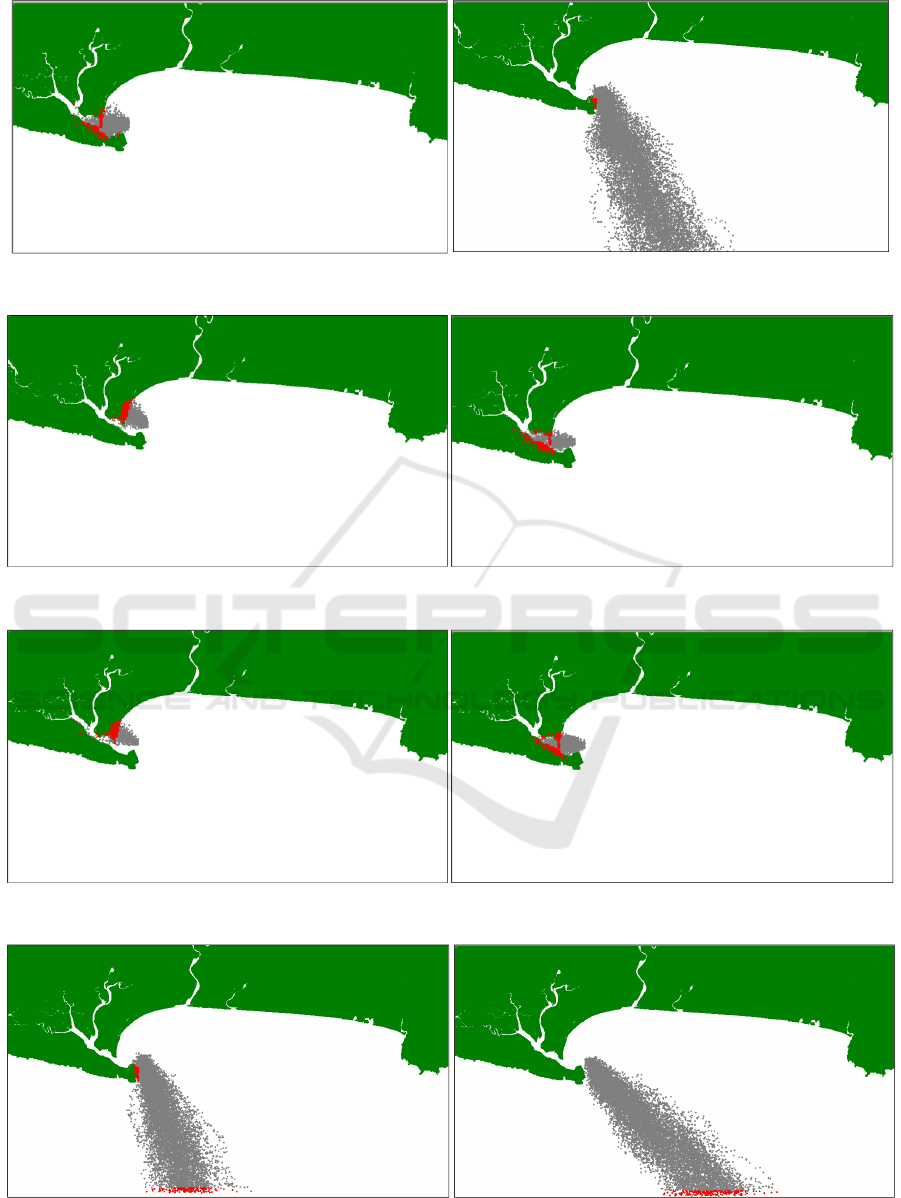
Figure 9 and 10. Simulation results in May and June, respectively.
Figure 11 and 12. Simulation results in July and August, respectively.
Figure 13 and 14. Simulation results in September and October, respectively.
Figure 15 and 16. Simulation results in November and December, respectively.
Oil Spill Simulation for Analysis of Environmental Mitigation in Cilacap Coastal Areas
365

Figure 17. The most polluted area: a) The eastern end of
Nusakambangan, b) Teluk Penyu beach area, c) Donan
River estuary, and d) Widarapayung and Ketapang Indah
Beach
The impact of the oil spill on the Donan River
estuary, which is a mudflat with high biodiversity,
will be different from the impact of the oil spill on the
coastal area in Cilacap, which is a sandy coastal plain.
Productive areas, such as estuary areas, when it is
exposed to an oil spill, will experience a long-term
impact. On the other hand, the sandy beach area also
has a high economic value because it is used, among
others, for beach tourism, docks, and building
materials/mineral resources/mining materials. In
addition, sandy beach area is a habitat for various
flora and fauna. Likewise, the clean-up of oil spills in
estuary areas will be different from it is in sandy
coastal plains.
For this reason, in the context of preventing or
reducing the risk of oil spill while minimizing the
impact caused by oil spill, oil spill mitigation can use
one or several approaches, i.e., technology, socio-
economic culture, institutions, and stakeholders.
As an example, in technology approach, one of
the mitigation efforts can be carried out by widening
and dredging the shipping channel periodically to
reduce the potential for the tanker to be docked. In
addition, the application of technological instruments
to this mitigation effort can also take the form of
applying double hull requirements for oil tankers to
minimize the risk of accidental oil spills.
In addition, mitigation through a technology
approach also means using technology to minimize
the impact caused by oil spills. The application of the
right method in tackling oil spills will be very
effective in reducing oil in the environment, be it the
physical method of using a boom, absorbent,
skimmer, use of dispersants (chemical methods),
bioremediation (biological method), or burning. The
method to deal with oil spills can be used in one
method or in a combination of several methods,
according to the location of the incident, the type of
oil spilled, and the volume of oil spills.
4 CONCLUSIONS
The simulation of the oil spills based on the 3D model
of non-orthogonal hydrodynamic curvilinear
coordinate technique and the oil spill model of
Cilacap coastal areas was investigated. It can be
concluded that the Teluk Penyu beach area, the
eastern end of Nusakambangan Island, and the Donan
River estuary under the present study are the areas
with the highest probability of contamination in
regard to oil spills risk. This research finding may be
able to be utilized for preventing and mitigating the
risk of oil spills in Cilacap coastal area.
ACKNOWLEDGEMENTS
The authors would like to thank PERTAMINA
Indonesia Surabaya office for the permission to use
the MoTum software.
REFERENCES
BAPPEDA (Badan Perencanaan Pembangunan Daerah
Kabupaten Cilacap) – Universitas Diponegoro, 2001.
Pemetaan Wilayah dan Sumberdaya Pesisir Kabupaten
Cilacap. Research Report.
Butyliastri, Sulistyaningsih, 2009. Prediksi Laju
Sedimentasi di Muara Kali Lamong Menggunakan
Model Matematis Aliran dan Angkutan Sedimen.
Thesis. Institut Teknologi Sepuluh Nopember.
Hartami, Prama, 2008. Analisis Wilayah Perairan Teluk
Pelabuhan Ratu untuk Kawasan Budidaya Perikanan
Sistem Keramba Jaring Apung. Thesis. Institut
Pertanian Bogor.
Jayawardana, Trigunawan, 2006. Penilaian Terpadu
Dampak Tumpahan Minyak di Perairan Balikpapan
(Studi Kasus Tumpahan Sludge Oil dari Kapal MT
Panos G.). Thesis. Program Studi Ilmu Lingkungan,
Universitas Indonesia.
Muin, Muslim, (n.d.). Manual MoTum (Model Tumpahan
Minyak) dengan Sistem Informasi Geografi. LAPI ITB
– PERTAMINA.
Muin, Muslim, 2005. Penerapan Sel Mangrove dalam
Pemodelan 3D Hidrodinamika Laut NBOF (Non-
Orthogonal Boundary Fitted) dengan Studi Kasus
Estuari Ajkwa. Jurnal Teknil Sipil, Vol. 12, No. 2.
a
d
c
b
BEST ICON 2018 - Built Environment, Science and Technology International Conference 2018
366
