
A Study on The Operational Performance and Satisfaction with the
Service Quality of Trans Mebidang Buses in Corridor 1 and Corridor
2 based on Passengers’ Perception
Cok Nando Panondang
1
, Roesyanto
2
and Medis Sejahtera Surbakti
2
1
Postgraduate Student Civil Engineering, Faculty of Engineering, Universitas Sumatera Utara, Indonesia
2
Lecturer at Civil Engineering Department, Faculty of Engineering, Universitas Sumatera Utara, Indonesia
Jl. Perpustakaan No.1 Kampus USU Medan
Keywords: Transportation; Operational Performance; Service Quality.
Abstract: As one of the metropolitan cities in Indonesia, Medan has an increasingly acute level of traffic congestion.
To create a better, orderly, efficient, effective transportation condition, it is recommended that people
should use public transportation. In 2014, the Provincial Administration of North Sumatera issued a public
transportation policy on the operation of the Trans Mebidang Bus Rapid Transit (BRT) to minimize the
problems of traffic congestion in Medan and surrounding areas. The purpose of this study was to know the
operational performance of Trans Mebidang buses and the level of satisfaction of the public as users of the
Trans Mebidang bus service. Measurement of operational performance was carried out through a dynamic
survey, and measurement of Trans Mebidang bus service quality was carried out using the Importance-
Performance Analysis (IPA) method. The results of the overall weighting in this study show that the
operational performance of the Trans Mebidang buses in corridor 1 and corridor 2 in this study had yet to
fulfil the expectations of the passengers, with an average value of suitability between performance and
expectations based on the 22 question items in the questionnaires distributed of -1.41. The performance and
quality of the service provided by the operator management need to be maintained to keep the passengers
use the public transportation.
1 INTRODUCTION
Transportation is the movement of people and goods
from one place to another. Movements of people and
goods have always been fundamental components of
human societies. As one of the metropolitan cities in
Indonesia, Medan has an increasingly acute level of
traffic jams. The number of motor vehicles is
continuously increasing to the extent that the road
facilities in Medan are no longer capable of
accommodating the number of motor vehicles,
which are predominantly privately owned. The use
of a great number of private motor vehicles in
Medan causes the road capacity to be decreasing.
One of the efforts made by the Medan
Government to deal with this problem is broadening
the road surface. In consequence, land area dwindles
because it is used for road widening and parking
lots. People are also reluctant to use public
transportation since the services in network, facility,
infrastructure, etc. are poor. The bad quality of
public transportation services in terms of security,
comfort, feasibility, simplicity, and efficiency,
which gives inconveniences and insecurity to urban
public transportation passengers, has encouraged the
passengers to use private motor vehicles.
To create a transportation condition which is
better, more orderly, more efficient, and more
effective, it is recommended that people should use
public transportation. This is one of the ways to
reduce the problems of traffic congestion in Medan
and its surrounding. The Provincial Administration
of North Sumatera issued a policy on Bus Rapid
Transit (BRT)-based public transportation in 2014 to
cope with transportation problems in North
Sumatera Province, particularly in Medan, Binjai,
and Deli Serdang (Mebidang).
Trans Mebidang BRT is a bus transportation
system which is expected to be fast, comfortable,
safe, and punctual in terms of infrastructure,
vehicles, and schedule. Operationally, the Bus Rapid
148
Panondang, C., Roesyanto, R. and Surbakti, M.
A Study on the Operational Performance and Satisfaction with the Service Quality of Trans Mebidang Buses in Corridor 1 and Corridor 2 based on Passengers’ Perception.
DOI: 10.5220/0008904500002481
In Proceedings of the Built Environment, Science and Technology International Conference (BEST ICON 2018), pages 148-153
ISBN: 978-989-758-414-5
Copyright
c
2022 by SCITEPRESS – Science and Technology Publications, Lda. All rights reserved
Transit (BRT) in North Sumatera is managed by
Perum Damri.
For a city, good performance and services of
public transport will make its traffic better and
support its economic activities efficiently and
effectively. The operation of Trans Mebidang buses
under a mass transportation system is expected to
directly or indirectly shift the use of private vehicles
to public transportation vehicles to reduce the
congestion that began to be felt in Medan-Binjai and
Medan-Lubuk Pakam stretches.
Passengers' satisfaction is defined as a judgment
that a product or service is provided at a pleasurable
level of consumption-related fulfilment. The growth
of the passenger road transport and the adequacy of
the transport sector focus more on the supply and
demand situations. The demand can be seen from the
passengers’ side and the supply is from the side of
operators. On the other hand, it shows the ease of
use of the supply and demand of transport and other
related issues in the sector. Passengers’ satisfaction
is one of the important issues, and it may be
challenged by different factors. Identifying these
factors from both sides and forwarding intervention
mechanisms for the problems are necessary to
provide quality transportation service.
The purposes of our research were (1) to review the
operational performance of Trans Mebidang buses and
(2) to include the IPA model to measure the levels of
passengers' satisfaction with the service quality.
2 METHODS
As it has been clearly stated in the introduction
section, the main purpose of this study was to assess
the operational performance, and the level of
passengers’ satisfaction with, the service delivery of
Trans Mebidang buses in the public transport sector.
To attain this objective, the researchers used a
dynamic survey to specify the operational
performance of the buses and a descriptive survey in
the research design to specify the service quality
from the passengers' perception. In carrying out this
research, the researchers contacted some bus
passengers. Respondents were randomly chosen and
given forms at bus stops or on buses. The survey
was targeted mostly at people who used public
transport. The total sample size was 100. The
identified variables were the demographics of the
respondents and the respondents’ perception of the
experience (satisfaction) taking the Trans Mebidang
buses.The level of satisfaction with the public
transport service was measured with a five-point
Likert scale. The respondents were asked to rate 22
items relating to effectiveness based on their
experiences using the Trans Mebidang bus service.
The twenty-two satisfaction items were gleaned
from a literature review and a pilot study that
reflected the respondents’ experiences and problems
faced when commuting by Trans Mebidang buses.
The descriptive statistics from a total of 22 questions
outlining the various statements of the level of
service quality from passengers' perception can be
analysed.
Public bus transport enables mobility for people
within urban areas throughout the world. In
analyzing transportation performance, there are
some parameters that can be used. The indicators for
the analysis of transportation performance and the
data input needed are as follows.
In this study, the following is the levels of
transportation performance established:
G = Good
R = Regular
A = Average
B = Bad
VB = Very Bad
Table 1: The Indicator for Analysing the Transportation Performance (World Bank, 1987).
Parameters Units Standard
Criteria
G R A B VB
Journey Time hour 1–3 ≤ 3 1–1.30 2–2.30 2.30–3 > 3
Load Factor % ≤ 100 100–90 90–80 80–70 70–50 < 50
Trip Length bus/day ≥ 8 7 6 5 < 5
Distance Traveled by Buses km 230– 260 ≥ 260 260–230 230–200 200–170 < 170
Cycle Time hour ≤ 2:09 2:10–2:38 2:39–3:07 3:08–3:36 > 3:36
Number of Passengers/Buses/Day 250–300 ≥ 250 249–187 186–124 123–61 < 62
Availability Factor % 80–90 ≥ 90 90–60 60–40 40–20 < 20
Circulation Time hour ≤ 2:22 2:01–2:50 2:51–3:25 3:26–3:40 > 3:00
5 4 3 2 1
A Study on the Operational Performance and Satisfaction with the Service Quality of Trans Mebidang Buses in Corridor 1 and Corridor 2
based on Passengers’ Perception
149
The discussion on the operational performance of
Trans Mebidang bus transportation includes journey
time, load factor, trip length,
distance travelled by
buses, cycle time, number of passenger/bus/day,
availability factor, and circulation time, which were
used to know the standard of public transport
service. This can be used as the basis for the
identification of the needs for Trans Mebidang bus
transportation to serve the demand well.
2.1 Bus Service Quality Management
The term service quality in transport literature has
long been investigated and defined in many forms. It
has been defined as the quality criteria and the
accurate measures for which the providers are
responsible to provide, the measurements process of
how the service quality level delivered matches the
customer satisfaction, the measurements that reflect
users` perceptions towards the service, the pre-defined
standard of service attributes relative to the actual
service quality, and the measuring of customer
expectation on a constant service standard base.
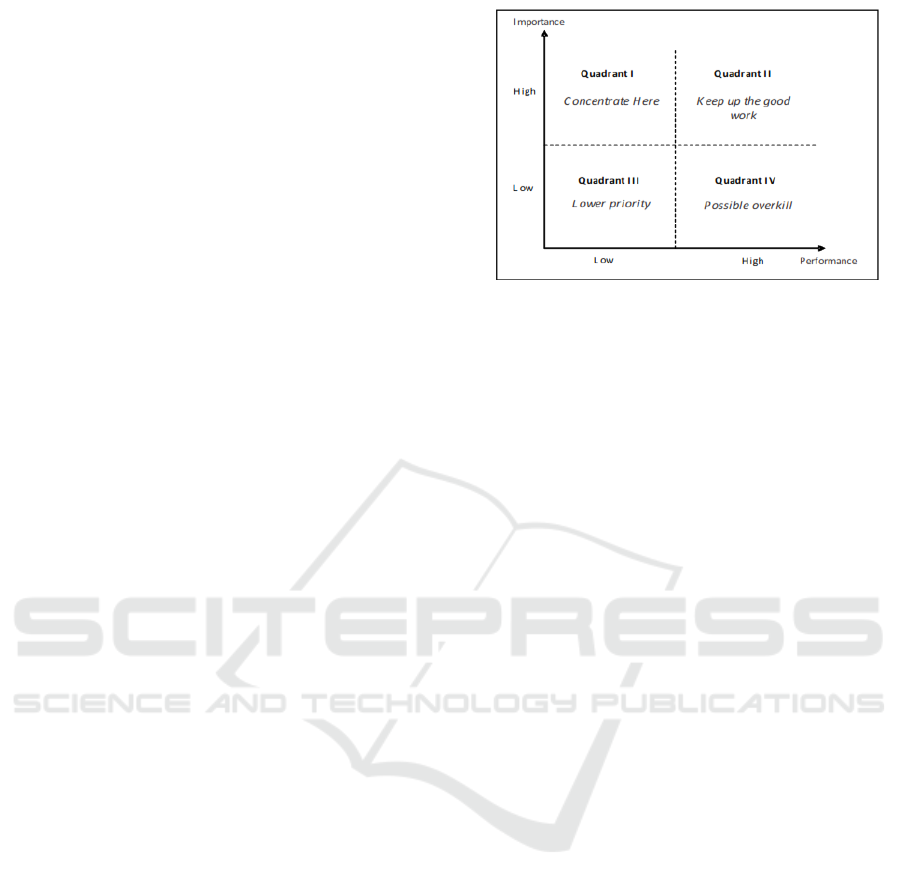
2.2 Importance-Performance Analysis
(IPA)
Importance-Performance Analysis (IPA) was
formulated by Martilla and James (1977). This simple
technique has been a popular tool for understanding
customer satisfaction and prioritizing service quality
improvements. It is a powerful evaluation tool for
practitioners and academics to find out attributes that
are doing well and attributes that need to be
improved, which require actions immediately. In
short, this IPA evaluation tool is used to prescribe the
prioritization of attributes for improvement, and it can
also provide guidance for strategic development. In
principle, IPA combines dimensional measurements
to the expectations and importance two grids, then
both dimensions were plotted into it. Importance
value is plotted as the vertical axis, while the expected
value is plotted as the diagonal axis by using the mean
value contained in importance and expectation
dimensions as the centre line cutting. The diagram
consists of four quadrants that show the level of
importance to service attributes. In this research,
Importance-Performance Analysis (IPA) was used to
assess the levels of importance and satisfaction of bus
service quality from the passengers' perception. The
instruments used in this research were 22-question-
item questionnaires that measured service quality
attributes. An example of an IPA grid is shown in
Figure 1.
Figure 1: This caption has one line so it is centered.
3 RESULTS AND DISCUSSION
With regard to gender of the respondents, 48% were
men, and 52% were women. As for the age of the
respondents, 31% were 15–24 years old, 28% were
25–34 years old, 25% were 35–44 years old, and
16% were 45–54 years old. With regard to the
number of bus usages a week, 38% used less than 3
times a week, 29% used 4 times a week, 19% used 5
times a week, and 14% used more than 5 times a
week. In terms of occupation, 34% were students,
23% were private employees, 17% were civil
servants, 14% were enterprisers, and 12% were out-
of-works.
3.1 Operational Performance
The operating performance of Trans Mebidang
buses was evaluated using the World Bank’s
performance measuring parameters, namely journey
time, load factor, trip length, distance travelled by
buses, cycle time, number of passenger/bus/day,
availability factor, and circulation time. This section
tries to address the extent to which the available
fleets were utilized by the public through a survey of
buses. Utilization normally varied between different
times of the day (i.e. between peak and off-peak
periods), different days of the week, and different
times of the year.
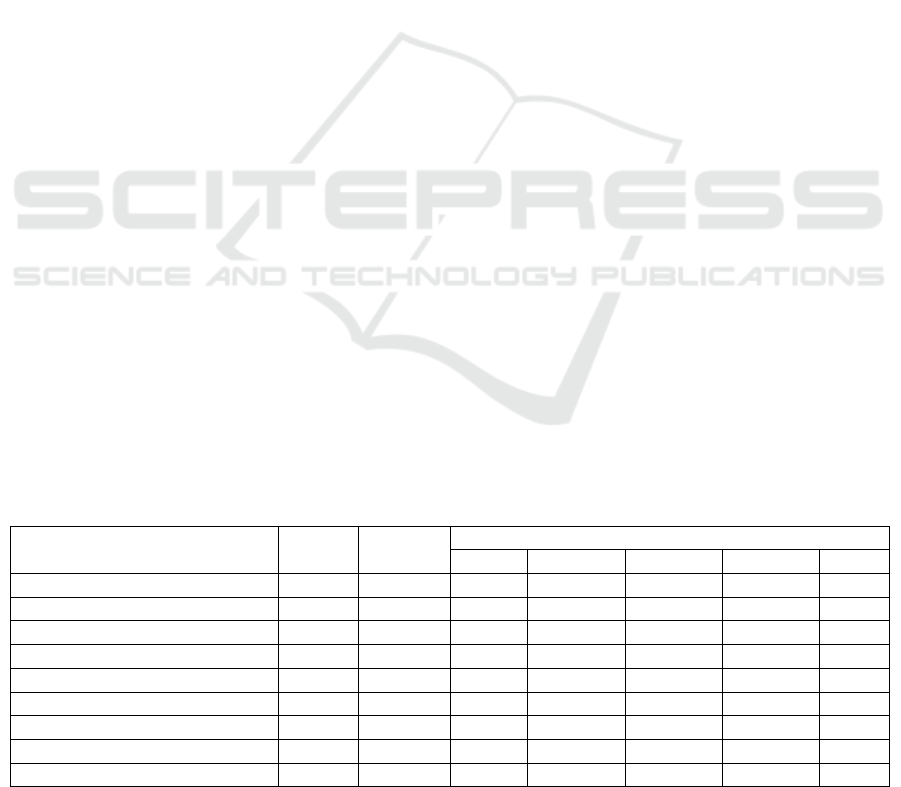
Table 2 shows the weighting results of the Trans
Mebidang buses of the Pusat Pasar-Binjai route and
the Pusat Pasar-Lubuk Pakam route.
Overall weighting results, operational
performance of Trans Mebidang buses on corridor 1
and corridor 2 according to World Bank standard
with the result of dynamic survey, operational
performance of Trans Mebidang buses in category 3,
Average category.
BEST ICON 2018 - Built Environment, Science and Technology International Conference 2018
150
Table 2: The Weighting Results of Trans Mebidang Buses.
Parameters Units Standard
Pusat Pasar-Binjai Route Pusat Pasar-Lubuk Pakam Route
Monday-
Thursday
Saturday Sunday
Monday-
Thursday
Saturday Sunday
Journey Time hour 1–3 1 1 1 1 2 2
Load Factor % ≤ 100 4 5 5 2 2 4
Trip Length
buses/
day
4 4 4 3 3 3
Distance Traveled by
Buses
km
230–260 2 2 3 3 3 4
Cycle Time hour 1 1 1 2 3 3
Number of
Passengers/Buses/Day
250–300 5 5 5 5 5 5
Availability Factor % 80–90 3 4 4 3 3 3
Circulation Time hour 1 1 1 3 4 4
Average hour 3 3 3 3 3 4
Score A A A A B B
Table 3: Expectations and Perceptions of Passengers of Service Quality Dimensions.
Variables Dimensions Perception Expectation Gap
Security on the Bus
Reliability
3.12 4.22 -1.1
Rapidness 2.56 4.17 -1.61
Consistency and the Suitability with the Predetermined
Schedule
2.80 4.29 -1.49
Congestion Solution 2.79 4.17 -1.38
Cheap Rates
Responsive
ness
3.70 4.48 -0.78
Availability of Travel Time Information 3.61 4.34 -0.73
Officers’ Readiness to Lift Passengers’ Excess Baggage
onto the Bus
3.04 4.29 -1.25
The Bus Driver’s Dropping Off and Picking Up Passengers
on the Passengers’ Request
3.04 4.40 -1.36
Good Driver Skills
Assurance
3.21 4.59 -1.38
Convenience in the Bus 2.93 4.57 -1.64
Whether or not the Concierge Had Good Engineering Skills
in the Event of Bus Breakdown
3.00 4.37 -1.37
Availability of Insurance 1.69 3.40 -1.71
Whether or Not the Officer Will Aid Passengers
Empathy
2.52 4.02 -1.50
Complaint Contact 2.47 4.16 -1.69
Maintenance of Good Relationship with Passengers 2.54 3.96 -1.42
Operational Hours Suiting Passengers’ Needs 2.65 4.05 -1.40
Decent Condition of the Bus
Tangibles
2.85 4.48 -1.63
Support Facilities 3.14 4.47 -1.33
Condition of Station/Bus Stop 2.70 4.49 -1.79
Cleanliness Station/Bus Stop 2.73 4.62 -1.89
Well-Functioning Aircon Facilities on the Bus 3.40 4.47 -1.07
Bus Seating Conditions 3.32 4.81 -1.49
-1.41
3.2 Bus Services Quality Management
The data from this study were analysed using the
Statistical Package for Social Science (SPSS) software.
Firstly, an exploratory data analysis in which the data
were examined and cleaned was conducted. A
descriptive analysis was conducted for each variable.
This section presents the results of the analysis of the
specific expectations versus perceptions for each of the
five dimensions of service quality.
A Study on the Operational Performance and Satisfaction with the Service Quality of Trans Mebidang Buses in Corridor 1 and Corridor 2
based on Passengers’ Perception
151
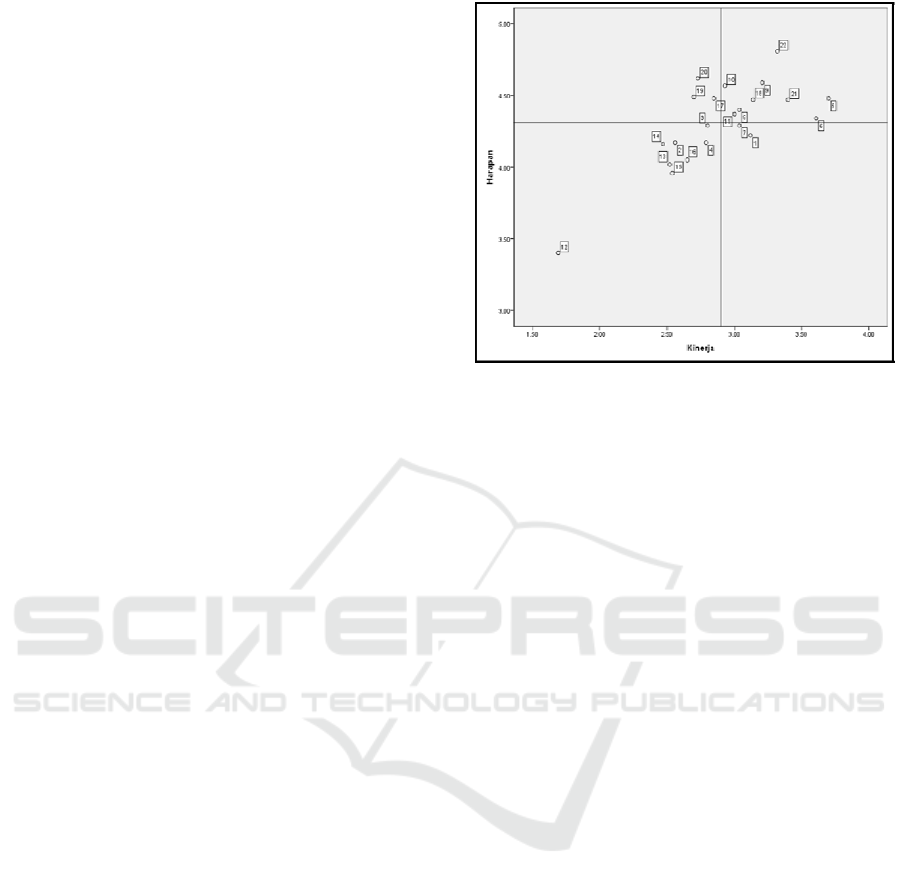
Importance-Performance Analysis (IPA) for
Service Quality
The IPA method has helped divide the public
transportation service quality according to the
passengers’ perceptions into four identifiable
quadrants, so that the bus operators as decision
makers will be better able to understand how
passengers perceive their services. This is a useful,
effective way for decision makers to identify what
problems exist. A Cartesian diagram in this research
is shown in Figure 2.
Quadrant I:
Quadrant I shows that the handling of the
attributed variables which influenced the satisfaction
of the users of Trans Mebidang buses with the
service provided by the operators of the Trans
Mebidang buses should have been prioritized
because the existence of these attributed variables
was very important, while the performance was still
not satisfactory. This condition indicates that the
variables performance/service provided by the
operators of the Trans Mebidang buses was worse
than what had been expected by the passengers, so it
should be improved optimally.
Quadrant II:
Quadrant II shows that the handling of the
variables which influenced the satisfaction of the
passengers of Trans Mebidang buses with the
service provided by the operators of the Trans
Mebidang buses should have been maintained
because the level of performance was generally in
accordance with the expectation/interest of the
passengers of the Trans Mebidang buses.
Quadrant III:
In Quadrant III, the attributed variables which
influenced the satisfaction of the passengers of Trans
Mebidang buses with the service provided by the
operators of the Trans Mebidang buses were
regarded unimportant by the passengers as users of
the service, while the quality of its implementation
was considered common.
Quadrant IV:
Quadrant IV shows that the attributed variables
influenced the satisfaction of the passengers of Trans
Mebidang buses with the service provided by the
bus operators. The passengers considered that the
performance in this quadrant was very good, but it
should be improved so that it would meet what had
been expected by the passengers as users of the
service.
Figure 2: Importance-Performance Analysis (IPA) of the
Service Quality.
4 CONCLUSIONS
Based on the results of the research and the
discussion, and referring to the problems and the
objectives of the research, it could be concluded that
The overall weighting results show that the
operational performance of the Trans Mebidang
buses in corridor 1 and corridor 2, according to the
World Bank’s standard and the results of the
dynamic survey, fell into category 3 (Average). As
of the quality of the Trans Mebidang bus service in
this study has not fulfilled the expectations of
passengers, with an average value of the suitability
level between performance and expectations based
on the 22 questions items in the questionnaires
distributed of -1.41. The negative mark indicates that
the service quality had yet to meet the expectations
of the passengers.
ACKNOWLEDGEMENTS
I would like to express my sincere gratitude to my
supervisor Prof. Roesyanto and co-supervisor Medis
Sejahtera Surbakti, PhD. for their constant support,
guidance, and motivation. It would never have been
possible for me to take this work to completion
without their incredible support and encouragement.
This research was a part of the author’s study at
Universitas Sumatera Utara.
BEST ICON 2018 - Built Environment, Science and Technology International Conference 2018
152

REFERENCES
Adebambo, S. & Adebayo, I., 2009. ‘Impact of bus rapid
transit system (BRT) on passengers’ satisfaction in
Lagos Metropolis, Nigeria’, International Journal of
Creativity and Technical Development.
Andriansyah., 2015. Manajemen Transportasi Dalam
Kajian dan Teori. Penerbit FISIP Universitas Prof. Dr.
Moestopo Beragama. Jakarta.
Departemen Perhubungan., 2001. Panduan Pengumpulan
Data Angkutan Umum Perkotaan. Jakarta: Direktorat
Bina Sistem Lalu Lintas dan Angkutan Kota.
Gary L. B., 2002. Public Journal of Transportation,
Volume 5, No.2. Center for Urban Transportation
Research (CUTR). University of South Florida.
Hensher, D., Stopher, P. & Bullock, P., 2003. ‘Service
quality: Developing a service quality index in the
provision of commercial bus contracts’, Journal of
Transport Research 37.
Iles, R., 2005. Public transport in developing countries,
Elsevier, Amsterdam.
J. Martilla, and J. James., 1977. “Importance-Performance
Analysis,” Journal of Marketing, vol. 41, no. 1, pp. 77-
79.
Keputusan Direktur Jenderal Perhubungan Darat Nomor:
SK.687/AJ.206/DRDJ/2002. Pedoman Teknis
Penyelenggaraan Angkutan Penumpang Umum di
Wilayah Perkotaan Dalam Trayek Tetap dan Teratur.
Jakarta; Departemen perhubungan RI.
Levinson, H., Zimmerman, S., Clinger, J., Gast, J.,
Rutherford, S. & Bruhn, E., 2003. Bus rapid transit
implementation guidelines, TCRP Report 90,
Transport Research Board, Washington, DC.
Mason, R.D., dan Douglas, A.L., 1999. Teknik Statistika
Untuk Bisnis dan Ekonomi. Jilid 2 Edisi 9, Erlangga.
Jakarta.
Mobereola, D., 2009. Africa’s first bus rapid transit
scheme: The Lagos BRT-lite system, Sub-Saharan
Africa Transport Policy Program Discussion Paper 9,
SSATP, Lagos.
P. Agarwal, and A. Singh., 2010. “Performance
improvement of urban bus system: Issues and
solutions”, International Journal of Engineering
Science and Technology 2(9), 4759-4766
Sugiyono., 2009. Statistics for Research. Alfabeta
Publisher. Bandung.
Tamin, O. Z., 2008. Perencanaan Dan Pemodelan
Transportasi, Edisi 2. Penerbit ITB. Bandung.
Tjiptono, F., 2012. Service Management Mewujudkan
Layanan Prima (Edisi Kedua). Penerbit Andi.
Yogyakarta.
World Bank. (1987). Bus Services: Reducing Costs and
Raising Standards. World Bank Technical Paper No.
68. Washington, DC
A Study on the Operational Performance and Satisfaction with the Service Quality of Trans Mebidang Buses in Corridor 1 and Corridor 2
based on Passengers’ Perception
153
