
Service Life Design for Infrastructure under Indonesian
Environmental Exposure
Mochamad Hilmy
1
, Herry Prabowo
1
1
Laboratory for Construction, Innovative Structures, and Building Physics,
Department of Architecture, Politeknik Negeri Pontianak, Jl. Ahmad Yani, Pontianak 78124, Indonesia
Keywords: Service Life Design, Infrastructure, Indonesian Tropical Climate, Concrete Durability, Chloride Ingress
Abstract: Reinforced concrete material is the most common material used in construction. This is due to its high
durability which makes concrete classified as one of the world building materials having the longest service
life. On the other hand, many research studies claimed that the application of concrete also has many durability
problems. This is even worse for extreme environments such as sea due to its high chloride ion concentration.
Environmental parameters such as temperature, humidity, and carbon dioxide concentration also have direct
effects on the deterioration of concrete structures. Nowadays, the Indonesian Government builds much
infrastructure which uses reinforced concrete as its main construction material. Concrete is chosen since its
constituents are abundant in Indonesia. Deterioration mechanisms of concrete structures can be divided into
the mechanism of concrete material deterioration and the mechanism of reinforcing bar corrosion. The
corrosion of reinforcing bar is the most dangerous mechanism and the most difficult one to control. Chloride
ions commonly coming from seawater become the main factor resulting in severe corrosion. This paper was
aimed to give suggestions for several durability-related parameters such as cement type, water-cement ratio,
concrete cover, etc. under Indonesian tropical climate.
1 INTRODUCTION
Indonesia, the world’s largest archipelagic state, has
a gigantic maritime domain of about six million
square kilometers. It consists of more than 17,000
islands with five largest islands being Sumatera, Java,
Kalimantan, Sulawesi, and Papua. Being located in
proximity to the equator line, Indonesia is influenced
mainly by the tropical rainforest climate. This climate
is typically denoted by its high temperature, heavy
rainfall, and high humidity. Its temperature is quite
stable over the year, ranging between 23 °C to 28 °C
spread from coastal plains to higher mountainous
areas. It shows only a small fluctuation from season
to season. Indonesia only has two main seasons,
namely wet or rainy season and dry season. Most
areas have their rainy season from September until
March, which reaches its peak in January and
February. Lowland areas have rainfall ranging
between 1800 to 3200 mm per year. These values
increase with the elevation of the area up to an
average of 6000 mm in some mountainous regions. In
a dry season, the rainfall decreases to 1800 mm
annually. This dry season occurs from April to
August with its driest peak occurring in July. The
relative humidity varies between 70% and 90% (Logt,
2016).
Nowadays, the Indonesian Government has more
focus on infrastructure development. It is achieved by
improving ports and maximizing inter-island
connectivity, and, in the end, it is hoped that
Indonesia becomes a “Global Maritime Axis”. The
priority of this infrastructure development plan is in
the infrastructure of the maritime sector. It is
considered to be a project of nationally strategic
importance given that Indonesia is the largest
archipelago in the world (Carruthers, 2016).
There are many seaports having been built
recently. Concrete is chosen to be their main
construction material since its constituents are
abundant in Indonesia. It is no wonder that reinforced
concrete becomes very popular. Its high durability
capacity makes concrete classified as one of the world
building materials having the longest service life. On
the other hand, many research studies claimed that the
application of concrete also has many durability
problems. This is even worse for extreme
environments such as sea due to its high chloride ion
Hilmy, M. and Prabowo, H.
Service Life Design for Infrastructure under Indonesian Environmental Exposure.
DOI: 10.5220/0008904000002481
In Proceedings of the Built Environment, Science and Technology International Conference (BEST ICON 2018), pages 133-138
ISBN: 978-989-758-414-5
Copyright
c
2022 by SCITEPRESS – Science and Technology Publications, Lda. All rights reserved
133

concentration. Environmental parameters such as
temperature, humidity, and carbon dioxide
concentration also have direct effects on the
deterioration of concrete structures. Deterioration
mechanisms of concrete structures can be divided into
the mechanism of concrete material deterioration and
the mechanism of reinforcing bar corrosion. The
corrosion of reinforcing bar is the most dangerous
mechanism and the most difficult one to control.
Chloride ions commonly coming from seawater
become the main factor resulting in severe corrosion.
2 LITERATURE REVIEW
Seawater is one of the external sources of chloride
ions which are corrosive to concrete reinforcing steel
other than internal sources coming from concrete
mixtures (Nguyen, et al., 2016). Corrosion due to
chloride ions is one of the main basis of deterioration
of reinforced concrete structures in chloride-exposed
environments. This results in reduced service and
security structures while increasing repair and
maintenance costs (Bastidas-Arteaga & Schoefs,
2015).
Tutti’s model (Figure 1) is widely accepted as a
conceptual model in the modelling of structural
deterioration. The model clearly shows the time of
corrosion initiation to the time of corrosion
propagation. In the initiation phase, chloride ions
diffuse from concrete to reinforcing steel. When this
phase ends, the initial corrosion of steel
reinforcement begins when the chloride ion
concentration reaches the threshold value. The
propagation phase is defined as the time when the
corrosion begins to the critical point of the loss of the
function of the reinforcing steel. In this case, the
service life of the structure is the sum of the initiation
phase and the propagation phase (Wu, et al., 2015).
Service life of structures means that the structure
will fulfil the performance requirements under
defined repair and maintenance within a specified
time period (Verma, et al., 2014). The estimation of
service life of reinforced concrete structures in the
marine environment is usually done by using a simple
basic model of chloride diffusion. This model is
popularly known as Fick’s second law of diffusion. It
is stated as follows.
Figure 1: Reinforced concrete structure deterioration
Process due to corrosion.
( ) ( )
2
2
,,C x t C x t
D
t
x
=
(1)
3 METHODS
An estimation of the service life of reinforced
concrete structures exposed to chloride ions is carried
out by means of chloride diffusion models. There are
three models used here namely empirical diffusion
model, long-term chloride concentration model, and
modified diffusion model.
3.1 Empirical Chloride Diffusion Model
This empirical chloride diffusion model is derived
from Fick’s second law of diffusion. The chloride
profile in concrete is obtained by assuming that the
governing transport mechanism is one-dimensional
diffusion. The mathematical solution of this problem,
equation (1), yields equation (2) as follows:
,
1
2
x t s
x
C C erf
Dt
=−
, (2)
where C
x,t
is the concentration of chloride at depth x
within time t, C
s
is the concentration of chloride at the
concrete surface, x is the depth from surface, t is time,
and D is the coefficient of apparent chloride diffusion.
Simplifying using parabolic function, equation (2)
reads as equation (3) (Khan, et al., 2017).
( )
2
,
0.5
1
23
x t s
x
CC
Dt
=−
. (3)
BEST ICON 2018 - Built Environment, Science and Technology International Conference 2018
134
The coefficient of apparent chloride diffusion, D,
is defined by (Fib, 2006) as follows:
, ,0
()
app c e RCM t
D k D k A t=
,
(4)
where ke is the environmental transfer variable,
D
RCM,0
is the chloride migration coefficient (table 1),
kt is the transfer parameter (set to 1), and A(t) is the
sub-function considering the ageing.
11
exp
ee
ref real
kb
TT
=−
, (5)
where be is the regression variable, Tref is the
reference temperature (193 K = 20 °C), and Treal is
the temperature of the ambient air or structural
element.
Table 1: D
RCM,0
parameter quantification for different
concrete mixtures.
1
equivalent water-cement ratio, hereby considering FA (fly
ash) or SF (silica fume) with the respective k-value
(efficiency factor). The considered contents were as
follows: 22 wt.-%/cement; SF: 5 wt.-%/cement.
2
n.d.–chloride migration coefficient RACC,0-1 has not
been determined for these concrete mixes.
( )
0
a
t
At
t
=
, (6)
where t
0
is the reference point of time (chosen to be
0.0767 year = 28 day), and t is the time in year.
Table 2: Ageing exponent,a
e
, parameter quantification.
Concrete
Ageing exponent a
e
[-]
5
Portland cement concrete
CEM I; 0.40≤w/c≤0.60
Beta (m
1
= 0.30; s
2
= 0.12;
a
3
= 0.0; b
4
= 1.0)
Portland fly ash cement
concrete f≥0.20z; k=0.50;
0.40≤w/c
eqv
≤0.60
Beta (m
1
= 0.60; s
2
= 0.15;
a
3
= 0.0; b
4
= 1.0)
Blast furnace slag cement
concrete CEM III/B;
0.40≤w/c≤0.60
Beta (m
1
= 0.45; s
2
= 0.20;
a
3
= 0.0; b
4
= 1.0)
1
m = mean value,
2
s = standard deviation,
3
a = lower bound,
4
b = upper bound,
5
quantification can be applied for the
exposure classes: splash zone, tidal zone, and submerged
zone.
This chloride diffusion model can be utilized to
predict the chloride-induced corrosion initiation time.
It is assumed that C
x,t
is the critical chloride
concentration (C
crit
), t is the time of initiation, and x
is the concrete cover thickness (a). The equation (3)
now reads as follows.
( )
2
1
0.5
1
12
1
crit s
a
t
D
CC
=
−
(7)
In this research, the values of C
crit
and C
s
are taken
0.3 and 0.6, respectively.
3.2 Chloride Diffusion Model
Incorporating Time Effect
A model reported by (Lei, et al., 2018) incorporating
the effect of time in the chloride diffusion model is as
follows:
,
1
1
2
1
x t s
m
x
C C erf
D
t
m
−
=−
−
,
(8)
where m is a constant of time decay factor.
A constant of time decay factor, m, depends on
ratio of concrete mix and ambient surroundings. This
paper assumes that m equals to 0.69, which is taken
based on (Lei, et al., 2014).
2
,
0.5
1
1
3
2
1
x t s
m
x
CC
D
t
m
−
=−
−
.
(9)
Analogous to equation (7), equation (10) can be
derived in the same manner, which results in the
following equation:
( )
2
1
2
0.5
1
12
1
m
crit s
ma
t
D
CC
−
−
=
−
.
(10)
Service Life Design for Infrastructure under Indonesian Environmental Exposure
135
3.3 Chloride Diffusion Model
Incorporating Linear Stress
Distribution
This model of chloride diffusion is gained by
considering the linear stress distribution on a
sectional structure. It is considered that the cross-
sectional stress is under pure axial compressive load
(Lei, et al., 2018). The resulting formula can be seen
as follows:
( )
,
2
01
1
2
x t s
ss
x
C C erf
D A A t
=−
++
,
(11)
where A
0
and A
1
are the considered cross-sectional
areas, and σ
s
is the cross-sectional stress. In this
paper, A
0
= 0.56, A
1
= 0.38, and σ
s
= 0.32 MPa.
( )
( )
2
,
0.5
2
01
1
23
x t s
ss
x
CC
D A A t
=−
++
.
(12)
Equivalent to equation (7), equation (13) can be
derived in the same manner, which yields the
following equation:
( )
( )
2
3
0.5
2
01
1
12
1
ss
crit s
a
t
D A A
CC
=
++
−
.
(13)
Those three formulas of corrosion initiation time,
equations (3), (9), and (12), are then compared to each
other taking into account parameters such as cement
type, water-cement ratio, and concrete cover suitable
for Indonesian construction practices.
4 RESULTS AND DISCUSSION
The prediction of reinforced concrete structures’
service life is performed to study the effect of the use
of each diffusion model on how long the initiation
time will last. These simulations are carried out for
several parameters such as water-cement ratio,
cement type, and temperature. Every simulation uses
the three model of chloride diffusion, which are
equations (3), (9), and (12). The results of the
simulations are then plotted in “concrete cover” vs
“initiation time of corrosion” graphs (Figure 2 until
Figure 5).
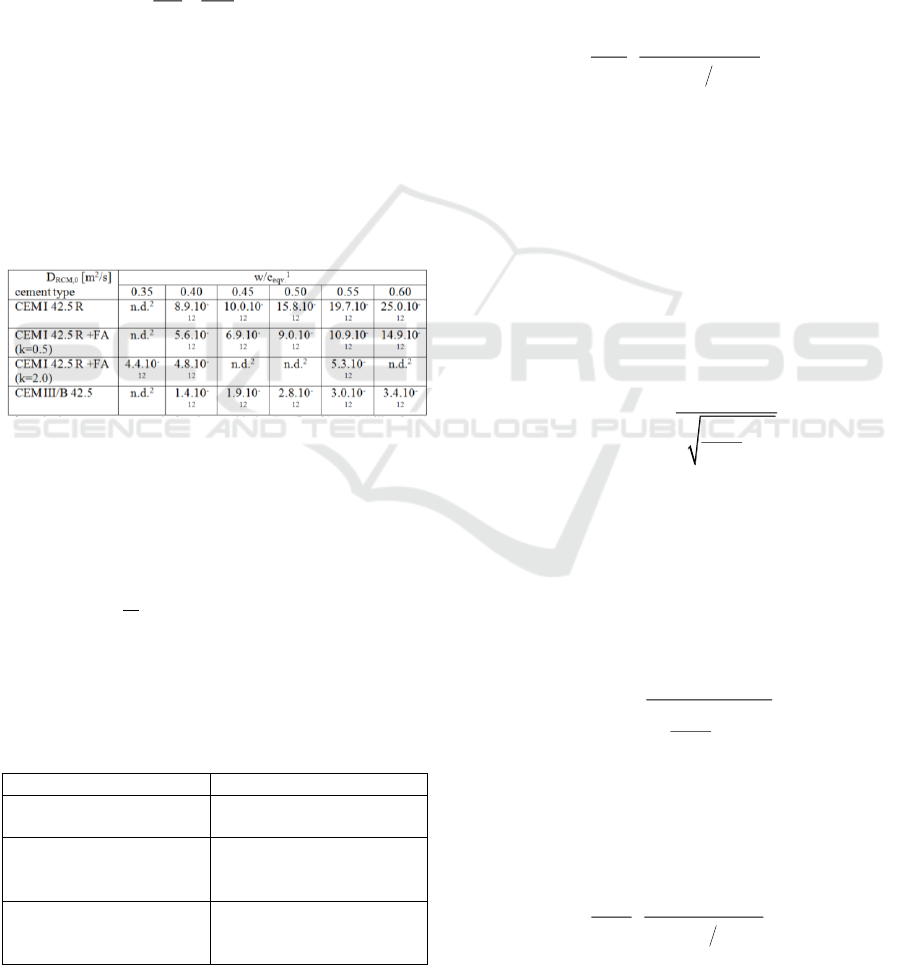
Figure 2: Concrete cover vs. initiation time of corrosion—
three models.
Figure 2 depicts the relation between concrete
cover and the initiation time of corrosion
incorporating three models of chloride diffusion. The
models are empirical diffusion model, long-term
chloride concentration model, and modified diffusion
model, which are indicated as t1, t2, and t3,
respectively. As can be observed, the initiation time
of corrosion is longer for thicker concrete cover.
For common interior structural elements, the
concrete cover is usually 40 mm thick. This value
corresponds to initiation time of corrosion in around
20 year for models t1 and t3 and 50 years for model
t2. In general, chloride diffusion models t1 and t3
coincide with each other, while model t2 tends to
deviate from the other models. For concrete cover
ranging from 0 mm to 25 mm, all three models result
in almost similar initiation time. When concrete cover
reaches 30 mm, model t2 yields initiation time values
which are higher than those of the two other models.
Overall, model t2 predicts higher values of initiation
time.
Figure 3: Concrete cover vs. initiation time of corrosion—
w/c ratio.
It is obtained that t2 deviates a lot from other two
models and yields illogical values of initiation time of
corrosion for higher concrete cover. It is, thus,
reasonable to choose t1 and t3 for the rest of the
simulations. Having known that the results from t1
and t2 are coinciding, it is easier to use t1 model as
the governing model. The relation between concrete
cover and initiation time of corrosion which
0
50
100
150
200
250
300
0 10 20 30 40 50 60 70 80
Concrete Cover (mm)
Initiation Time of Corrosion
(year)
t1
t2
t3
0
50
100
150
200
250
0 10 20 30 40 50 60 70 80
Concrete Cover (mm)
Initiation Time of Corrosion
(year)
wc 0.35
wc 0.40
wc 0.45
wc 0.50
wc 0.55
wc 0.60
BEST ICON 2018 - Built Environment, Science and Technology International Conference 2018
136
incorporates various water-cement ratio parameters
can be seen in Figure 3. In general, all plotted graphs
are giving the same curve trends. The simulations
take five water-cement ratios (w/c): 0.40; 0.45; 0.50;
0.55; and 0.60. There are two groups of water-cement
ratios that are close to each other. These two groups
are w/c ratios from 0.40 to 0.45 and w/c ratios from
0.50 to 0.60. Taken as a whole, the w/c ratio 0.40
predicts the highest time of initiation, while the w/c
ratio 0.60 yields the lowest initiation time of
corrosion.
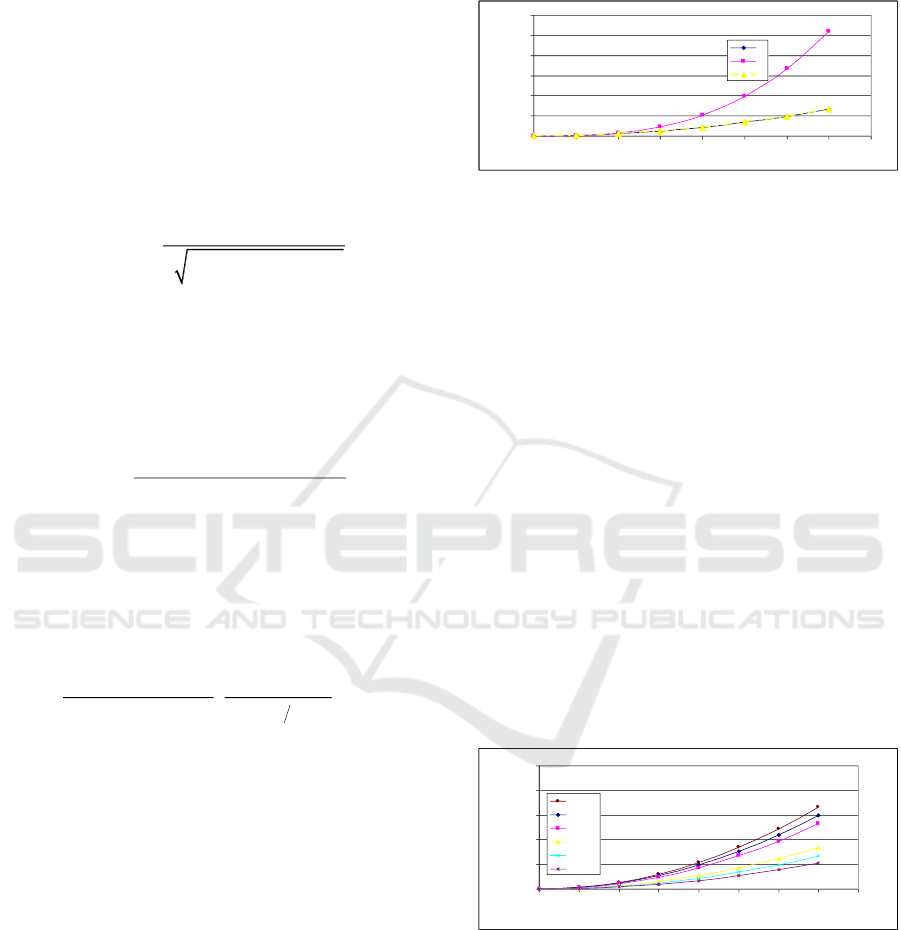
Figure 4: Concrete cover vs. initiation time of corrosion—
cement type.
Figure 4 simulates the relation between concrete
cover and initiation time of corrosion taking into
account different cement types. These cement types
include CEM I, CEM I + FA, CEM I + SF, and CEM
III/B. From the simulations, it can be noted that the
highest prediction values of corrosion initiation time
are given by CEM III/B. On the other hand, CEM I
gives the lowest values.
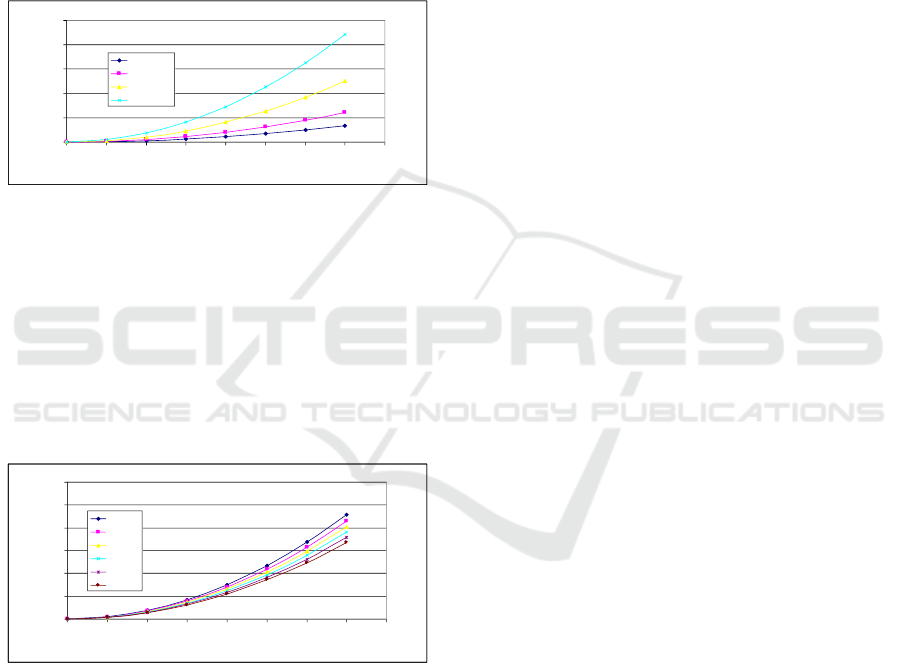
Figure 5: Concrete cover vs. initiation time of corrosion—
temperature
In order to give insight into Indonesian tropical
climate’s parameter, figure 5 illustrates the relation
between concrete cover and initiation time of
corrosion taking into consideration temperature
effect. The temperatures are simulated from 23 °C to
28 °C. For concrete cover ranging from 0 to 25 mm,
all six graphs give almost similar initiation time.
When concrete cover reaches 30 mm, each model
gives values of initiation time which are slightly
different.
5 CONCLUSIONS
A service life estimation of reinforced concrete
structures exposed to chloride-induced corrosion has
been performed using three models of chloride
diffusion. These models are empirical diffusion
model, long-term chloride concentration model, and
modified diffusion model. Several relevant
parameters are included in the service life simulations
in order to predict deterioration behavior under
Indonesian climate. Some important parameters in
reviewing initiation time of corrosion such as
concrete cover, water-cement ratio, and cement type
are calculated. Based on the results, the following
conclusions are achieved:
1. Empirical diffusion model and modified diffusion
model simulate similar trends and values in
predicting initiation time of corrosion.
2. Concrete cover parameter should be chosen
carefully so that it is not too thick (considering the
influence of the weight and performance of the
structure and the economical aspects of the
construction) or even too thin that it will
accelerate corrosion. The ideal concrete cover for
the Indonesian marine environment based on the
simulations is 70 mm. Figure 5 shows that all of
the values of initiation time of corrosion are over
60 years. They are higher than the design service
life of Indonesian common buildings, which is
only 50 years.
3. It is important to regulate and keep the water-
cement ratio parameter low in order to hamper the
speed of the migration process of chloride ions.
This not only helps postpone the corrosion
process but also affects the control of volumetric
deformation of concrete material, for example, the
phenomenon of creep and shrinkage. The ideal
value for water-cement ratio is 0.35. Figure 3
shows that the w/c ratio of 0.35 in conjunction
with 70-cm cover is enough to give the concrete
structures life of more than 150 years.
4. It is also important to observe the predefined
values in the formulation, especially its
compatibility aspects with Indonesian
construction practices and the Indonesian climate
condition in most cases.
ACKNOWLEDGEMENTS
The authors would like to acknowledge the financial
support from the Indonesian Ministry of Research,
Technology, and Higher Education
0
100
200
300
400
500
0 10 20 30 40 50 60 70 80
Concrete Cover (mm)
Initiation Time of Corrosion
(year)
CEM I
CEM I + FA
CEM I + SF
CEM III
0
20
40
60
80
100
120
0 10 20 30 40 50 60 70 80
Concrete Cover (mm)
Initiation Time of Corrosion (year)
TC 23 C
TC 24 C
TC 25 C
TC 26 C
TC 27 C
TC 28 C
Service Life Design for Infrastructure under Indonesian Environmental Exposure
137

(KEMENRISTEKDIKTI) of fiscal year 2018. The
assistance or encouragements from colleagues and
extraordinary works by technical staffs are also
gratefully acknowledged.
REFERENCES
Bastidas-Arteaga, E. & Schoefs, F., 2015. Sustainable
maintenance and repair of RC coastal structures.
s.l., s.n.
Carruthers, A. M., 2016. Developing Indonesia’s Maritime
Infrastructure: The View from Makassar.
Perspective.
Fib, 2006. Fib Bulletin 34 - Model Code For Service Life
Design Of Concrete Structures. s.l.:Fib.
Khan, M., Ahmad, S. & Al-Gahtani, H., 2017. Chloride-
induced Corrosion of Steel in Concrete: An
Overview on Chloride Diffusion and Prediction of
Corrosion Initiation Time. International journal of
corrosion.
Lei, M. et al., 2018. Modified chloride diffusion model for
concrete under the coupling effect of mechanical
load and chloride salt environment. AIP Advances,
Volume 8.
Lei, M., Peng, L. & Shi, C., 2014. An experimental study
on durability of shield segments under load and
chloride environment. Tunnelling and
Underground Space Technology, Volume 42, pp.
15-24.
Logt, P. v. d., 2016. Climate Change Profile: Indonesia,
s.l.: Netherlands Commission for Environmental
Assessment.
Nguyen, P., Bastidas-Arteaga, E. & El Soueidy, C., 2016.
An efficient chloride ingress model for long-term
lifetime assessment of reinforced concrete
structures under realistic climate and exposure
conditions. International Journal of Concrete
Structures and Materials, 11(2), pp. 199-213.
Verma, S., Bhadauria, S. & Akhtar, S., 2014. Probabilistic
Evaluation of Service Life for Reinforced Concrete
Structures. Chinese Journal of Engineering.
Wu, L., Zhou, Y., Kou, X. & Jiang, M., 2015. Reliability-
based service life prediction of existing concrete
structures under marine environment. Journal of
Central South University, Volume 22, p.
3608−3614.
BEST ICON 2018 - Built Environment, Science and Technology International Conference 2018
138
