
Estimated Optimum Internal Illuminance Distribution based on
Standard Deviation and Mean of Variation of Window Opening
Position in a Room
Gramandha Wega Intyanto
1
, Yose Rizal
3
, Eko Mulyanto Yuniarno
2
,
and Yoyon Kusnendar Suprapto
1
1
Department of Electrical Engineering, Institut Teknologi Sepuluh Nopember (ITS), Surabaya, 60111, Indonesia
2
Department of Computer Engineering, Institut Teknologi Sepuluh Nopember (ITS), Surabaya, 60111, Indonesia
3
Department of Architecture Engineering, Universitas Lancang Kuning, Pekanbaru, 28265, Indonesia
Keywords: Daylight, Internal Illuminance, Sky Component, Standard Deviation.
Abstract: Lighting system is one of the factors that affect the psychological comfort and user activity of a building.
Lighting in a room during the day is obtained from the sunlight, diffusion of light in the sky (cloud
overcast), and reflection of light from the surrounding environment. The light received indoors is influenced
by window openings, which should meet the size requirement under the SNI (Indonesian National Standard)
of at least 1/6 of the room area. Previous research only discussed the optimal size of window openings of a
room. This time the researchers sought the ideal window opening position of three different window
opening positions in one spatial field. Investigation of internal illuminance distribution was carried out by
calculations of sky component on the daylight factor. The internal illuminance distribution investigation
results obtained from the sky component calculations were later analyzed with standard deviation and
average. According to the analysis in this study, the greater the average and the smaller the standard
deviation, the better the distribution value of the room. From the analysis in the simulations carried out by
the researchers based on calculations, it can be concluded that the window’s position in the middle of the
wall has the optimal distribution. Further research is expected to be useful to architects in window position
decision-making in accordance with activity requirements to optimize energy saving by minimizing the use
of artificial lights at the daytime.
1 INTRODUCTION
Natural lighting is the most influential spectrum of
adaptation of human vision. Daylight consideration
in a room is based on human activity in the room.
The most important thing of natural lighting is that it
can affect the psychology of the inhabitants indoors.
It also allows for energy saving through the
reduction of the use of artificial light (Looman,
2017). The distribution of natural lighting in a room
depends on three factors: the geometry of the room,
the placement and orientation of the window as well
as other openings, and internal surface
characteristics (Code et al., 2001).
An opening can be oriented to receive direct
sunlight in certain times of day. The dimensions of a
window or openings can control the amount of light
that enters the room. Apertures can be oriented away
from direct sunlight and receive very strong lighting
from the dome of the sky (Acosta et al., 2015). The
dome of the heavens is a very constant source of
light, even in cloudy skies. In addition, cloudy sky
conditions can soften the direct sunlight and provide
balanced distribution of lighting levels in the room
(Phillips, 2004).
The amount of light can be measured using the
luminace value (flux, lighting), i.e., by assuming the
light from the outside and calculating the lighting
inside an interior space or using the amount of
relative daylight factor, i.e., by calculating the
lighting ratio at the indoor measurement point with
outdoor lighting (Rizal, Robandi and Yuniarno,
2016). The value of the daylight factor remains—the
illumination outside the room corresponds to the
indoor illumination; if it is dim outside, the indoors
will be dim too. To figure out the optimum
illumination in a room among different variants of
window opening positions, the researchers
conducted research by looking for mean and
standard deviation. The space with the largest
Intyanto, G., Rizal, Y., Yuniarno, E. and Suprapto, Y.
Estimated Optimum Internal Illuminance Distribution based on Standard Deviation and Mean of Variation of Window Opening Position in a Room.
DOI: 10.5220/0008903900002481
In Proceedings of the Built Environment, Science and Technology International Conference (BEST ICON 2018), pages 5-10
ISBN: 978-989-758-414-5
Copyright
c
2022 by SCITEPRESS – Science and Technology Publications, Lda. All rights reserved
5
average and the smallest standard deviation was
considered the optimal one.
2 DAYLIGHT FACTOR AND
WINDOW OPENING
2.1 Daylight Factor
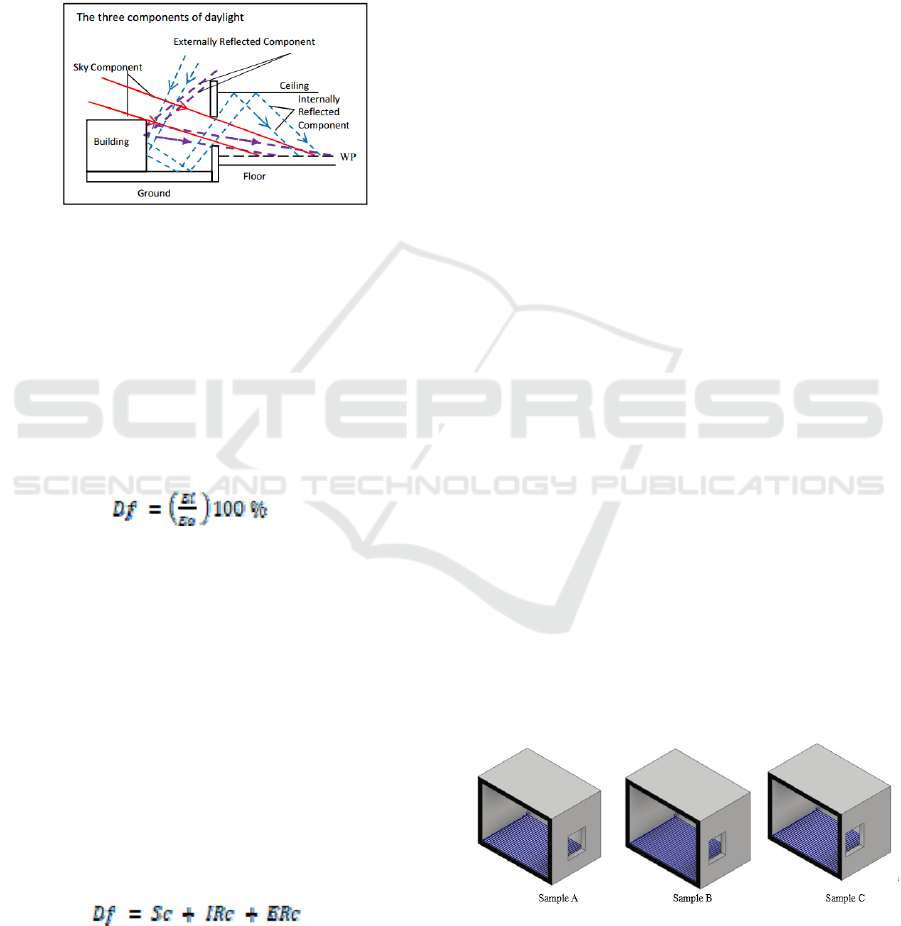
Figure 1: Daylight factor (Rizal, Robandi and Yuniarno,
2016).
Daylight factor is the ratio of the internal
illuminance value at the reference point in the room
and the external illuminance. These values are
obtained in the state of daylight as shown in Figure 1
(cloudy sky conditions or conditions of no sunlight
and at the same time) (Rizal, Robandi and Yuniarno,
2016). The definition of daylight factor is
represented in equation (1).
(1)
Factors that influence the daylight factor at a
point in a room are as follows:
• Sc, the illuminace that reaches the reference
point in the room directly from the sky;
• ERc, the illuminace that reaches the reference
point in the room, which is influenced by the
reflection of existing surfaces outside the room,
such as buildings and streets; and
• IRc, the illuminace that reaches the reference
point in the room, which is influenced by the
reflection of the surface in the room, such as
material, wall color, etc.
The sum of the above three factors produces Df
as represented in equation (2) (Code et al.,
2001)(Cibse, 1999).
(2)
2.2 Window Opening Composition
Window is a component that is often used in
buildings and has a great influence in regulating the
entry of light in the room. Functional design and
shapes of a window have the advantage of
maximizing incoming light in a room that affects the
activity of the occupant or user in the room. In
addition, window has the advantage of minimizing
the use of artificial lighting. Window size, position,
characteristics, and relationship with the wall surface
can define the light in the room. For this task, the
development of façade technology sets the most
important window element to ensure the quantity of
natural light in the room, followed by two elements
of window composition, namely the size and
position of the window placement (Acosta,
Campano and Molina, 2016).
Window dimensions and positions affect the
amount, distribution or penetration, as well as the
diversity of natural light. Dimensions (height and
width) of exposed walls on facades with window
positions affect the transition of natural light
(Iversen et al., 2013). High positioning of a window
will affect the natural light penetrating the room,
while the width of the window affects the evenness
of the distribution of natural light in the room (IEA,
2000).
3 ESTIMATED OPTIMAL
INTERNAL ILLUMINANCE
DISTRIBUTION
3.1 Window Opening Variants
In this paper, the estimation of internal illuminance
distribution was performed on window opening
variants of a 12 m
2
(4 m long and 3 m wide) room.
For the window to meet the size requirement of 1/6
of the room area, it should have the size of 2 m
2
(1.33 m wide and 1.5 m tall). There were 3 variants
differentiated by the position of the window
openings horizontally.
Figure 2: Three variants of window openings horizontally.
(A: against the corner of the window, B: against the
intersection of the window opening, C: against the outer
window).
BEST ICON 2018 - Built Environment, Science and Technology International Conference 2018
6
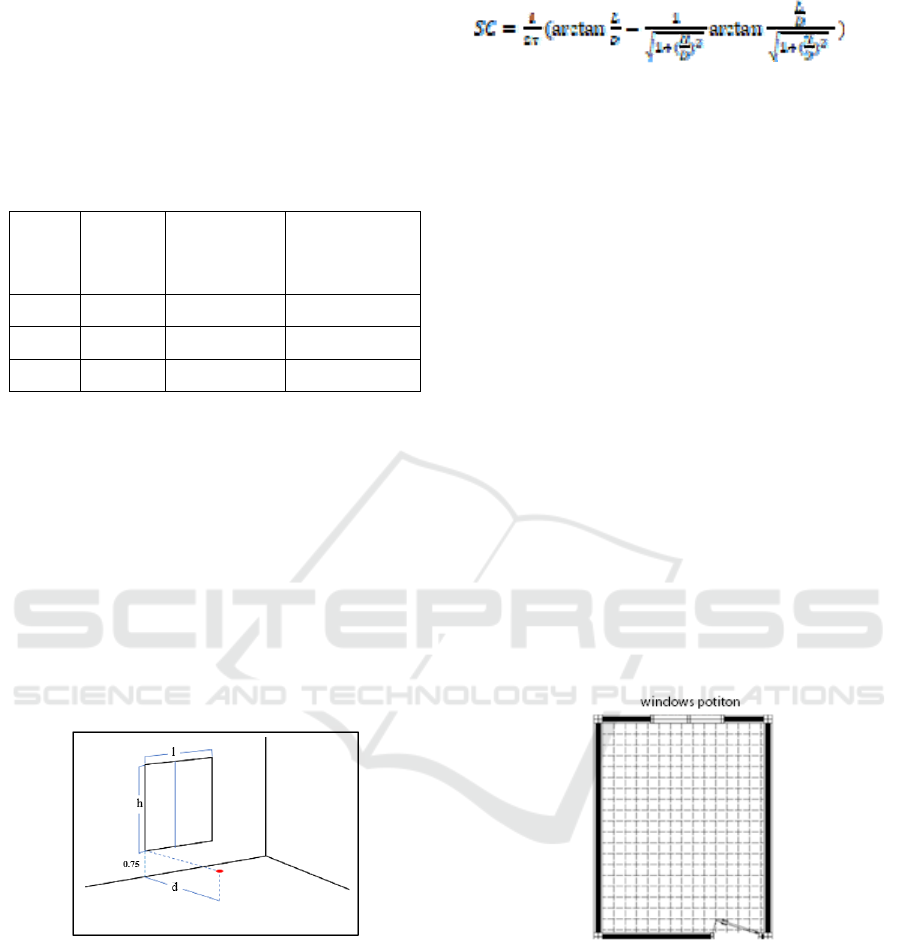
The window position was horizontally shifted to
the middle position (Sample A), the edge position
(Sample B), and the corner position (Sample C). The
positions of the window openings can be seen more
clearly in Figure 2. Meanwhile, the size and position
of the window landing against the room are outlined
in Table 1.
Table 1: Three variants of window opening horizontally
Sample
Window
Position
Distance of
the bottom of
the window
to the floor
Distance of the
right side of
the window to
the wall
A Middle 0.75 0.835
B Edge 0.75 0.435
C Corner 0.75 1.67
3.2 Calculation of Sky Component
Sky component is the most influential in daylight
factor as seen in equation (2). The calculation of the
sky component value in this paper was derived from
the calculation of window dimensions (rectangular-
shaped) and the distance to the floor point in the
room by utilizing the BRE table (Cie Standard
Overcast Sky) (Mangkuto, 2017). The dimensions of
the window in question include the window height,
width, and distance to the point representing the
average of the surrounding area on the floor as
shown in Figure 3.
Figure 3: Three-variable calculation
The point on the floor generated by the sky
component is called a reference point. The value at
this reference point will be used to distribute the
internal illuminance. The reference point was
obtained by determining the minimum distance limit
under the window to the floor, namely 0.75 m. If the
distance of the bottom of the window to the floor
exceeded 0.75 m, the additional distance would be
calculated. The sky component estimate was based
on the reference point against the window angle as
shown in equation (3).
(3)
3.3 Calculation of Sky Component
After obtaining the sky component value as
described in equations (3) and (4), we distributed the
internal illuminance in accordance with the
condition of the room area. The internal illuminance
distribution was performed in several stages. The
first stage was dividing the room in a grid. The grid
value was filled from the reference point of the sky
component and represented the average distance
value of the grid area. In the next stage, the internal
illuminance value was input into the daylight factor
formula in equation (5).
3.3.1 Grid Distribution
Prior to estimating the internal illuminance
distribution based on the sky component (Sc), a grid
was first made to determine the 0.2 m
2
grid spacing
reference point. Grid preparation in each room had
the purpose to include the internal illuminance value
at each midpoint of the grid based on the sky
component at the reference point. The internal
illuminance value was the average of the grid area
(0.2 m
2
) as shown in Figure 4.
Figure 4: Grid Distribution
3.3.2 Entry of the Sky Component Value on
Each Grid
The value of component sky was derived from the
window dimensions. This value is one of the most
influential in daylight factor. In addition, the value
of daylight factor is and , but the value of both was
ignored. This is because the effect of reflection in
the room, such as refraction of the color of the walls,
objects in the room, materials, among others, was
Estimated Optimum Internal Illuminance Distribution based on Standard Deviation and Mean of Variation of Window Opening Position in a
Room
7
not used, and neither was the influence of the
reflection outside the room, such as the reflection of
buildings and objects outside. So the only factor
affecting Df that was considered in this paper was Sc
as seen in equation (4).
(4)
3.3.3 Calculating Internal Illuminance
After the daylight factor value based on sky
component was obtained, the Ei (internal
illumination) value was found with equations (4) and
(5), that is Daylight Factor ratio. The daylight factor
value was derived from the sky component value.
The external illumination was 3000 lux. This value
was obtained under the average external illumination
condition in Indonesia in April. Then, the internal
illuminance value was obtained as seen in equation
(5).
(5)
Afterwards, the internal illuminance distribution
in the room based on the window variants was
obtained as seen in Table 2.
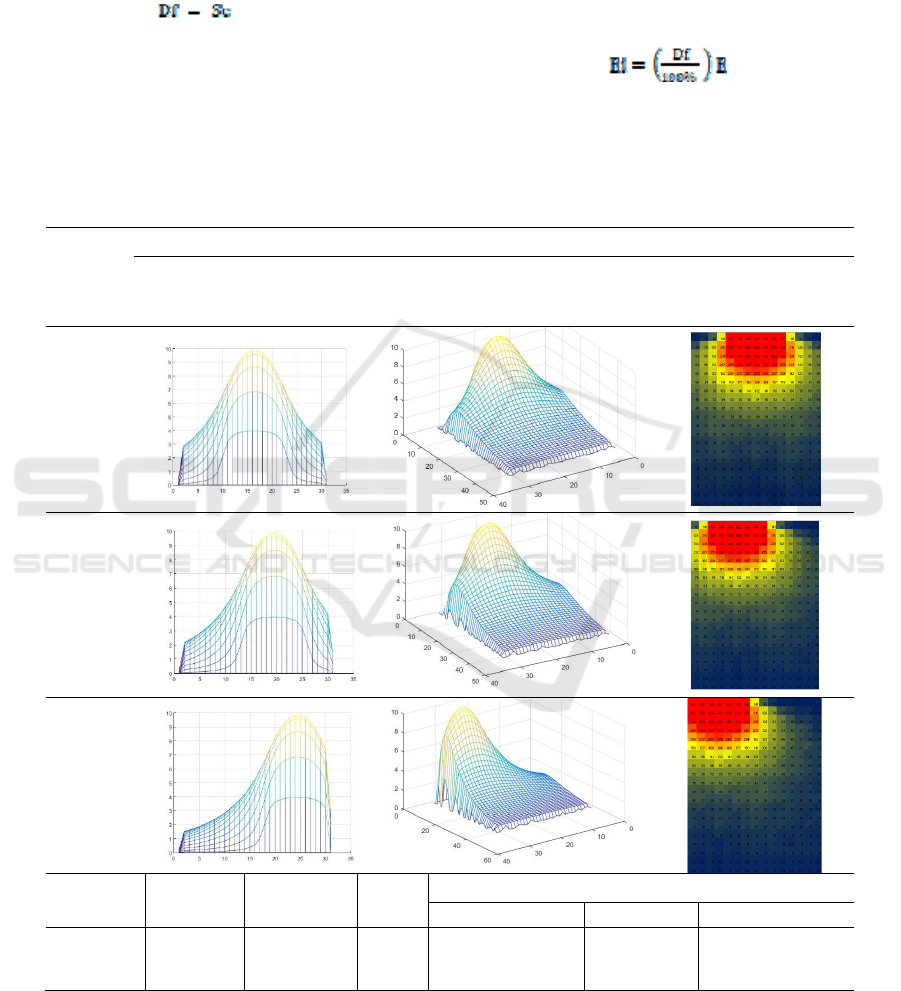
Table 2: Results of the analysis of the illumination distribution for three window opening variants
Sample
of
Room
Room View
The front
(Window Opening)
(Df in Room (%))
The back side
(Df in room (%))
The top position
(Ei in Room (lux))
A
B
C
Sample
To
Window
Position
Standard
Deviation
Mean
Internal illuminance Percentage Value
High (%) Average (%) Low (%)
A middle 148.1 95.58 10 27 63
B edge 148.8 93.46 9.7 24.3 66
C corner 149.5 86.2 9 20 71
BEST ICON 2018 - Built Environment, Science and Technology International Conference 2018
8

4 RESULTS AND ANALYSIS
4.1 Analysis of the Internal illuminance
distribution
After the internal illuminance distribution value of
the sky component was obtained, it was then
analysed to determine the optimal window variant
among the three variants of the window positions.
The analysis of the distribution used standard
deviation and mean equations. The standard
deviation of the internal illuminance in a
predetermined room was found using equation (6).
(6)
Meanwhile, the mean of the internal illuminance
in the room was found using equation (7).
(7)
4.2 Internal illuminance distribution
Results
The results of the analysis of the internal
illuminance distribution was illustrated using colors
(Table. 2), with the lowest illuminance of 0–65 lux
being represented by dark blue-yellowish blue,
medium illuminance of 66–237 lux being
represented by yellow-orange, and the highest
illuminance of 238–822 lux being represented by
orange-bright red. The analysis of the window
samples is described below.
4.2.1 Sample A
The room with a window in the middle had three
areas, namely one with the lowest illuminance of 0–
65 lux (63% dark blue area-yellowish blue), one
with medium illuminance of 66–237 lux (27%
orange), and one with the highest illuminance of
238–822 lux (10% orange-bright red), with
illumination tending to be distributed in front of the
window. From the 300 reference points in the
sample area, a mean (AEi) of 86.2 lux and a
standard deviation (SEi) of 149.5 lux were obtained.
4.2.2 Sample B
The room with a window located on the edge had
three areas, namely one with the lowest illuminance
of 0–65 lux (66% dark blue-yellowish blue), one
with medium illumination of 66–237 lux (24.3%
orange), and one with the highest illuminance of
238–822 lux (9.7% orange-bright red), with
illumination tending to be distributed in front of the
window. From the 300 reference points in the
sample area, a mean (AEi) of 93.46 lux and a
standard deviation (SEi) of 145.8 lux were obtained.
4.2.3 Sample C
The room with a window located in the corner had
three areas, namely one with the lowest illuminance
of 0–65 lux (71% dark blue-yellowish blue), one
with medium illuminance of 66–237 lux (20%
orange), and one with the highest illuminance of
238–822 lux (9% orange-bright red), with
illumination tending to be distributed in front of the
window. From the 300 reference points in the
sample area, a mean (AEi) of 86.2 lux and a
standard deviation (SEi) of 149.5 lux were.
Based on the description of Sample A, Sample B,
and Sample C, we show the results of the
explanation in the Df and illumination value on the
number of sides of the 3D reconstruction (from the
simulation we created) as in Table 2.
5 CONCLUSIONS
Based on the standard deviation and mean values,
the room with the biggest mean and the smallest
standard deviation of the three sample rooms was
the room which had the most optimal value of
internal illuminance distribution. It can be concluded
that in this study, of the three room samples studied,
the position of window openings that had the
optimal internal illuminance distribution value was
one of Sample A, with the window opening
positioned in the middle of the wall plane.
The more the window opening position is away
from the side of the wall, the smaller the value of the
internal illuminance distribution, meaning that if the
room is far apart, the opening of the window will
darken. On the contrary, if the wall is closer to the
window opening, the value of the internal
illuminance distribution will be greater, meaning
that the room will be brighter.
This research proves quantitatively that the
position of window openings can affect the value of
sky component on daylight factor and internal
illuminance. This is evidenced when the window
openings in the room are shifted, the value of
Estimated Optimum Internal Illuminance Distribution based on Standard Deviation and Mean of Variation of Window Opening Position in a
Room
9

daylight factor and internal illuminance at the
reference point will change.
REFERENCES
Acosta, I. et al. (2015) ‘Analysis of the accuracy of the
sky component calculation in daylighting
simulation programs’, Solar Energy, 119, pp. 54–
67. doi: 10.1016/j.solener.2015.06.022.
Acosta, I., Campano, M. A. and Molina, J. F. (2016)
‘Analysis of Energy Savings and Visual Comfort
Produced by the Proper Use of Windows’,
International Journal of Engineering and
Technology, 8(5), pp. 358–365. doi:
10.7763/IJET.2016.V8.913.
Cibse (1999) ‘Daylighting and window design.’, CIBSE,
Publicaciones IDAE, LG10_1999, pp. 8–98.
Code, N. E. et al. (2001) Tata cara perancangan sistem
pencahayaan buatan pada bangunan gedung ., Sni
03-6575-2001.
IEA (2000) ‘Daylight in Buildings’, Task 21/ ECBCS
Annex 29, 03(3), p. 262. doi:
10.1001/jama.1936.02770020010056.
Iversen, A. et al. (2013) Daylight calculations in practice.
Looman, R. (2017) Architecture and the Built
environtment. Available at:
http://www.nrel.gov/docs/fy00osti/28049.pdf.
Mangkuto, R. A. (2017) ‘Akurasi Perhitungan Faktor
Langit dalam SNI 03-2396-2001 Tentang
Pencahayaan Alami pada Bangunan Gedung The
Accuracy of Sky Component Calculation in SNI
03-2396-2001 on’, (December 2016).
Phillips, D. (2004) Daylighting. Natural Light in
Architecture., Industrial medicine & surgery. doi:
10.1016/j.enbuild.2006.03.005.
Rizal, Y., Robandi, I. and Yuniarno, E. M. (2016)
‘Daylight Factor Estimation Based on Data
Sampling Using Distance Weighting’, Energy
Procedia. The Author(s), 100(September), pp. 54–
64. doi: 10.1016/j.egypro.2016.10.153.
APPENDIX NOMENCLATURE
Daylight factor
Internal illuminance
External illuminance
Sky component
Internal reflection component
External reflection component
Window opening height
Window opening width
Distance of the window opening to the
reference point
The mean of internal illuminance
Standart deviation total internal illuminance
Reference point
Total reference point
BEST ICON 2018 - Built Environment, Science and Technology International Conference 2018
10
