
Institutional Analysis of Agribusiness Marketing in North Sumatra
Agriculture Production Center
Muhammad Ilham Riyadh
Faculty of Agriculture, Program Study of Agribusiness, Islamic University of North Sumatera,
Jalan KaryaWisata Gedung Johor Medan, Indonesia
Keywords: Institutional, Marketing, Agribusiness, Production Centers, Multiple Regression.
Abstract: Farmers are still difficult to escape from intermediary traders. They are often as the smallest party in the
marketing system of agricultural production centers. The objectives of this research is to identify various
forms of agribusiness marketing institutions, to analyze the factors that influence the use of agribusiness
centers, and to develop model for agribusiness marketing institutional development policies. The research
populationsarefarmers, traders and consumers in 6 regencies in North Sumatra. Sample was collected using
convenience sampling and snowball sampling methods. There are 130 farmers 50 traders, 6 commodities
namely: rice, corn, cabbage, red chili, orange and meat with. The data wereanalyzed by using multiple
regression method. Parameters such asfarmer’sage, education level, farmer’sknowledge on agribusiness
centers, farmers’informal ties with nonagribusinesscenter institutions and farmers participation in
counseling havepositive value, while products volume and distance to agribusiness center have negative
value.Farmer’s decision to utilize the agribusiness center was significantly influenced by farmer’s
knowledge on the agribusiness center and informal ties with non agribusiness center institutions. Marketing
institutions in this agriculture production centers are establishment of agribusiness units by involving input
traders, farmer groups,and tradersunder the same management control, the development of production and
commodity markets information systems and partnership development.
1 INTRODUCTION
Marketing institutions in agricultural commodities
are including farmers, collector,
intermediary/wholesaler traders and retailers
(Kuma'at, 1992). Problems that faced by marketing
system is among other inefficient marketing
activities, that is not yet able to deliver agricultural
product from farmers to consumers at a low cost and
provide fair compensation from the last total
consumer price to all participant parties in
production and marketing of agricultural
commodities. Such fair distribution is remuneration
distribution of marketing functions according to the
contribution of each marketing institution
(Mubyarto, 1989).
As so far, process of production and commodity
handling still emphasizes on individual abilities and
skills. Processes that involving some institutions
such as organization, norms or the arrangements, are
generally still focused on collecting and marketing
process at certain scale. For most regions,roles of
agricultural institutions and farmers do not exist yet.
In fact, there are various functions of agricultural
institutionsincluding as driver, collectors and
suppliers of production facilities, generating interest
and attitudes, and others.
Due to the reason, one of agribusiness
development problems in agriculture production
center in North Sumatra is the institutions have not
functioned and run as they should in the agribusiness
system. On the other hand, the existence of
agricultural institutions is a necessity and
prerequisite for the success of agribusiness activities.
Through agribusiness system implementation, it is
expected that there will be optimal integration
among strategic agribusiness subsystems namely the
subsystem of means of production, production
processes, post-harvest and commodity processing
and marketing.
The purpose of this study is to: 1) Identify the
form or model of agribusiness marketing institution
in agriculture production centers of North
Sumatra.2) identify the factors that influence the use
182
Riyadh, M.
Institutional Analysis of Agribusiness Marketing in North Sumatra Agriculture Production Center.
DOI: 10.5220/0008887101820187
In Proceedings of the 7th International Conference on Multidisciplinary Research (ICMR 2018) - , pages 182-187
ISBN: 978-989-758-437-4
Copyright
c
2020 by SCITEPRESS – Science and Technology Publications, Lda. All rights reserved
of agribusiness centers in North Sumatra, and 3).
develop model for agribusiness marketing
institutional policies.
2 RESEARCH METHODS
Six regencies as agriculture production center in
North Sumatera was selected for research namely
Simalungun, Serdang Bedagai, Karo, Dairi, Langkat
and Batubara. The populations are farmers, traders
and consumers in the six (6) regencies. Sample
(respondent) was collected using convenience
sampling and snowball sampling methods. The
sample is 130 farmers and 50 traders and also 6
commodities namely rice, corn, cabbage, red chili,
orange and meat. The data was analyzed using
multiple regression method.
3 RESULTS AND DISCUSSION
3.1 Development of Food Commodity
Prices in North Sumatra
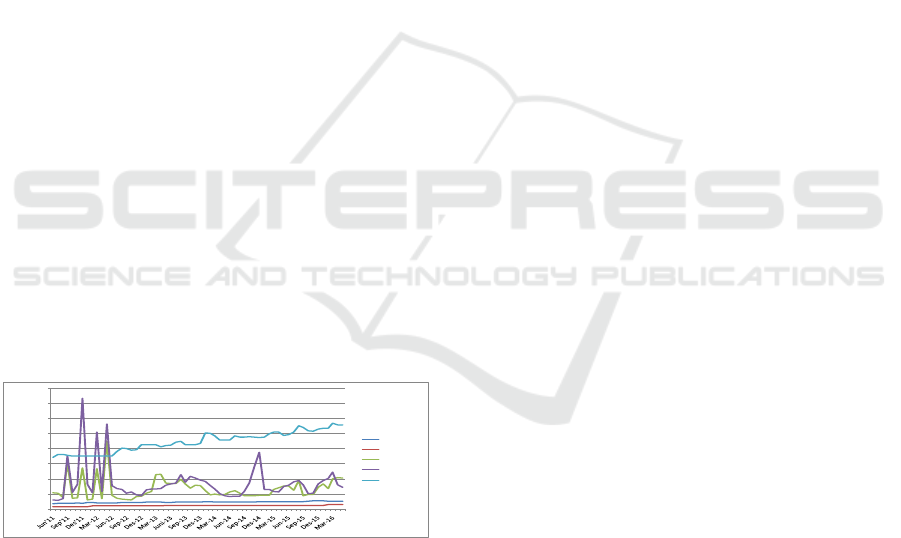
Average price of basic stuff in 33 Regencies/Cities
of North Sumatra in the first week of February 2016
(01-06 February 2016) is as follow. Kuku Balam
Rice is Rp. 11,420/kg, Jongkong Ir 64 Rice is Rp.
10,500/kg, Pure Beef is Rp. 110,830/kg. Dry Corn
Rp.4,870 / kg, Imported Onion Rp. 24,290/kg, Local
Onion Rp. 29,130 / kg, and white onion Rp. 29,450 /
kg.
Figure 1:Growth of Strategic Food Price in North
Sumatera.
Information obtained from Market Centerof
Medan City is beef prices soared sharply, from
normal selling price Rp. 90,000-Rp. 95,000/kg, now
increase to Rp. 110,000/kg. This increase occurred
due to limited beef supply in Medan City which
made beef prices soared (Riyadh, 2017).
3.2 Distribution Channel analysis
In general, farmers make sales to trade institutions
such as agents, middlemen, mills (rice), large traders
and retailers and directly to consumers. This can be
seen in the following description.
3.2.1 Rice Distribution Channel
a. Farmers - Agents - Sentosa Grinders-
Wholesalers - Markets - Retailers –
Consumers.
b. Farmers - Agents - Sentosa Grinders - Large
traders - Markets Center - Consumers.
3.2.2 Corn Distribution Channel
Farmers - Refineries - Collector traders -
Wholesalers - Retailers - Consumers.
3.2.3 CabbageDistribution Channel
a. Farmers - collectors - Large traders –
Consumers.
b. Farmers - Collector - Retailers – Consumers.
c. Farmers - Collectors – Exporters.
3.2.4 Red ChilliDistribution Channel
Farmers - Collectors - Retailers – Consumers.
3.2.5 OrangeDistribution Channel
a. Farmers - Collectors - Retailers – Consumers.
b. Farmers - Retailers – Consumers.
3.2.6 Beef Distribution Channel
Farmers - Collectors – Slaughter House – Market –
Consumers.
3.3 Market Behavior
1) Farmer distribution according to commodities
selling method at the research location
-
20.000
40.000
60.000
80.000
100.000
120.000
140.000
160.000
Beras
Jagung
Bawang
Cabai
Daging sapi
Institutional Analysis of Agribusiness Marketing in North Sumatra Agriculture Production Center
183
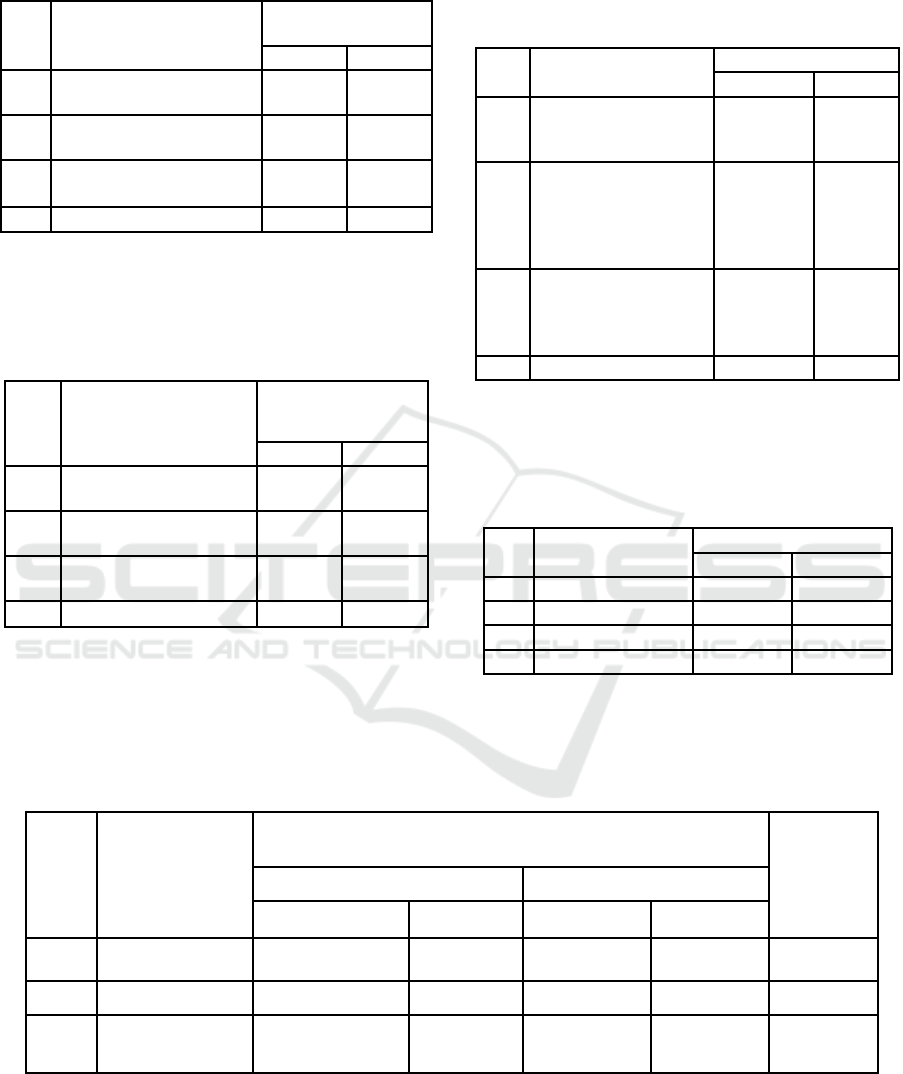
Table 1: Farmer distribution according to commodities
selling method at the research location.
No.
Selling Method
Number of
Farmers
Person
%
1.
Sold per unit on quality
basis
67
49,60
2.
Sold per unit on mixed
basis
38
28,10
3.
Sold on farmat harvesting
time
30
22,20
Total
135
100,00
2) Traders distribution according to commodities
selling method at the research location
Table 2: Traders distribution according to commodities
selling method at the research location.
No.
Selling Method
Number of traders
Person
%
1.
Sold per unit on quality
basis
34
68,00
2.
Sold per unit on mixed
basis
10
20,00
3.
Sold on farmat
harvesting time
6
12,00
Total
50
100,00
3) Pricing Institution
Table 3: Farmer’s distribution according to Pricing
Mechanism at the research location.
No.
Selling Method
Number of Farmer
Person
%
1.
Determined
unilaterally by the
buyer
24
17,80
2.
Set on mutual
agreement basis
without taking into
account the price
fluctuations
56
41,50
3.
Set on mutual
agreement basis by
taking into account
the price fluctuations
55
40,70
Total
135
100
4) Farmer distribution according to payment
method received at the research location
Table 4: Farmer distribution according to payment method
received at the research location.
No.
Selling Method
Number of Farmer
Person
%
1.
Cash
88
65,20
2.
Pay later
47
34,80
3.
Mixed
0
0,00
Total
135
100,00
5) Cooperation between Farmers and marketing
institutions
Table 5: Farmer distribution according to the relationship with buyer at the research location.
No.
Type of Buyer
Form of Relationship
Total
Free Buyer
Patronize
person
%
person
%
1.
Collector
64
60,37
42
39,63
106
2.
Wholesaler
22
81,48
5
18,52
27
3.
Partner Company
Contract
-
-
-
2
ICMR 2018 - International Conference on Multidisciplinary Research
184
6) Implementation of Marketing Function
Table 6: Respondent distribution according to post
harvesting activities at the research location.
No.
Description
Farmers respond
Person
%
1
Sorting
53
39,30
2
Grading
26
19,30
3
Storage without cooling
15
11,10
4
Storage with cooling
0
0,00
5
Milling
20
14,80
6
Packaging
21
15,60
Total
135
100,00
7) Marketing Performance
Table 7: Average of dominant commodity marketing
margin marketed by traders at the research location.
Commodity
Buying
Price
Average
Selling
Price
Average
Average Margin
Rp
Rp
(Rp)
(%)
Rice /grain
5.366,67
6.466,67
1.100,00
20,49
Corn
3.500,00
4.800,00
1.300,00
37,14
Cabbage
521,43
757,14
235,71
45,20
Red Chili
38.300,00
47.400,00
9.100,00
23,75
Orange
5.357,14
7.714,29
2.357,14
43,99
Beef
99.600,00
1.24520,00
24.920,00
25,02
8) Profit of Marketing Institution
Table 8: Average of trader profit for dominant commodity
at the research location.
Commodity
Buying
Price
Average
Selling
Price
Average
Average Margin
Rp
Rp
(Rp)
(%)
Rice /grain
1.100,00
762,50
337,50
30,68
Corn
1.300,00
724,38
575,62
44,27
Cabbage
235,71
171,43
64,28
27,27
Red Chilli
9.100,00
498,70
8.601,30
94,51
Orange
2.357,14
800,00
1.557,14
66,06
Beef
24.920,00
4740,00
20.180,00
80,97
9) Share Received for Farmer
Table 9: Average share received by farmers at the research
location.
Commodity
Buying
Price
Average
Selling
Price
Average
Average Margin
Rp
Rp
(Rp)
(%)
Rice /grain
5.366,67
6.466,67
82,98
30,68
Corn
3.500,00
4.800,00
72,91
44,27
Cabbage
521,43
757,14
68,86
27,27
Red Chili
38.300,00
47.400,00
80,80
94,51
Orange
5.357,14
7.714,29
69,44
66,06
Beef
99.600,00
124.520,00
79,98
80,97
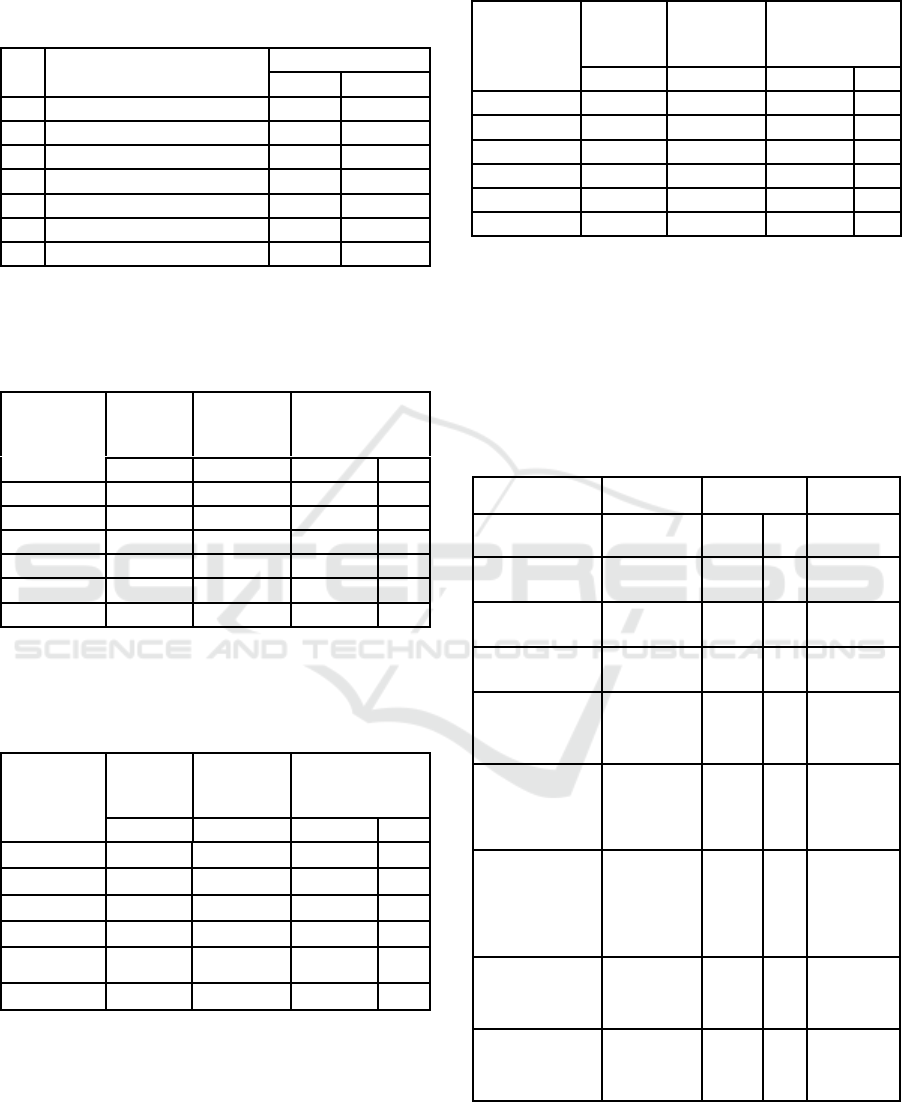
10) Factors Affecting the Utilization of
Agribusiness Center Areas by Farmers
Y = 0,0048 + 0,0002X1 + 0,0011X2 - 2,4715X3 -
0,0083X4 + 0,9036X5 + 0,0176X6 +
0,0066X7 + e (1)
Table 10: Factors Affecting the Utilization of
Agribusiness Center Areas by Farmers.
Predictor
Coefficient
Sig.
Note
Constant
0,0048
Farmer age (X
1
)
0,0002
0,8179
0,05
Not
Significant
Education level
(X
2
)
0,0011
0,8238
0,05
Not
Significant
Product Volume
(X
3
)
-2,4715
0,3262
0,05
Not
Significant
Distance to
agribusiness
center (X
4
)
-0,0083
0,6814
0,05
Not
Significant
Farmer
knowledge on
agribusiness
center (X5)
0,9036
0,0000
0,05
Significant
informal ties
between farmer
with non
agribusiness
center (X6)
0,0176
0,0217
0,05
Significant
Farmer
participation in
counseling (X7)
0,0066
0,679
0,05
Not
Significant
F testR.Square
145,1782
0,9998
0,05
Significant
11) Marketing Institution Development Policy for
Production Center Areas
Institutional Analysis of Agribusiness Marketing in North Sumatra Agriculture Production Center
185
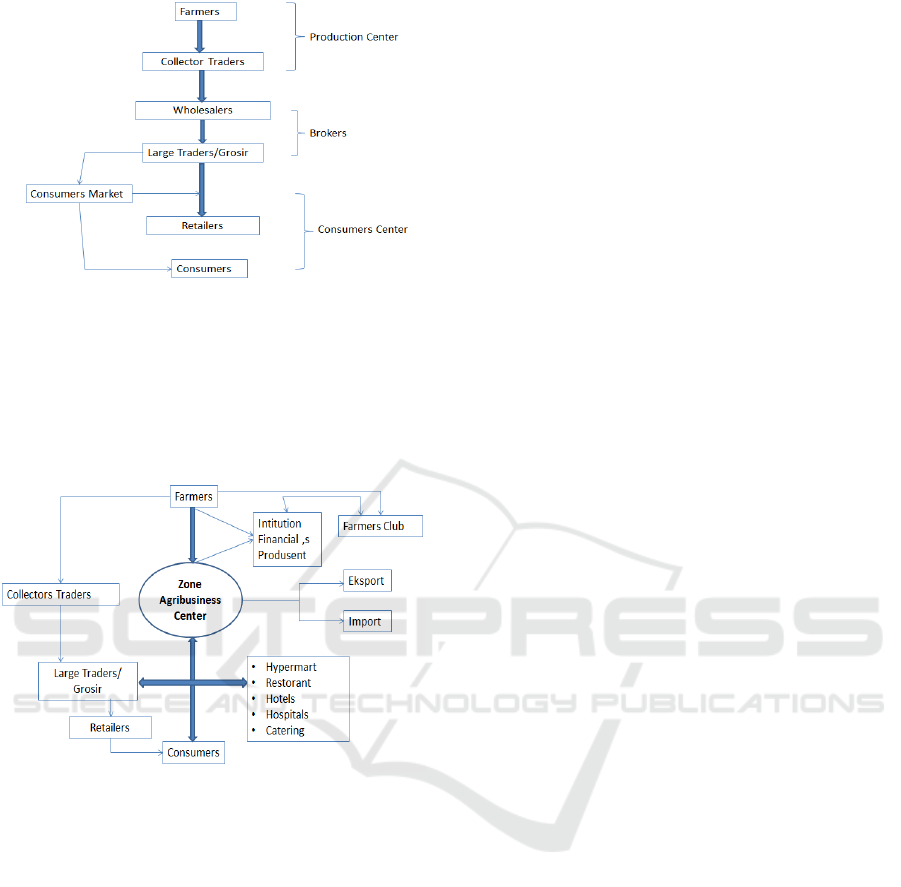
Figure 2: Marketing Channel in North Sumatera.
Agribusiness center area was developed to
increase farmers' income by cutting or shortening the
marketing chain, in turn achieve a better marketing
efficiency and margin distribution with a marketing
system. To the end, it can be developed as in the
following Figure.
Figure 3: System of Marketing to increase farmers'
income.
4 CONCLUSIONS AND
RECOMMENDATIONS
4.1 Conclusion
Some conclusions that can be drawn are as follows:
1. Coefficient of farmer age (X1), education level
(X2), farmers' knowledge about agribusiness
center area (X5), informal farmer ties with non
agribusiness center institutions (X6) and farmer
participation in counseling (X7) are positive
while the product volume (X3) and distance of
farmer's residence to the center area (X4) are
negative. Farmersdecision to take advantage on
agribusiness centers is significantly influenced
by farmers' knowledge on agribusiness centers
(X5) and informal farmer ties with non
agribusiness center institutions (X6).
2. The limitations of farming scale are
weaknesses in the bargaining position and
products marketing in North Sumatra, as
characterized by limitations in obtaining
transparent price information at a higher
market level, thus causing the level of prices
received by farmers lower than prevailing
prices on the market.
4.2 Recommendation
1. To increase the number and quality of
marketing institutions in agricultural
production centers in North Sumatra, local
governments (provinces and regencies/cities)
through relevant agencies should establish
agribusiness units in this centers by involving
input traders, farmer groups and agricultural
commodities based traders in one management
control.
2. Local governments (provincial and
regencies/cities) in North Sumatra should make
necessary improvements and develop
agricultural commodities marketing systems in
the production centers through the development
of production information systems and
commodity markets to determine data and
information about production, prices and
distribution chains in order to maintain stability
price of agricultural production.
ACKNOWLEDGEMENT
Thanks to the North Sumatra Research and
Development Agency (BALITBANGSU) for
providing fund in this research activity.
REFERENCES
Adyana dan Suryana, 1996.Pengkajian dan Pengembangan
Sistem SUP Berorientasi Agribisnis. Makalah
Disampaikan Pada Rakor Badan Agribisnis, Bogor.
Anindita, R., 2004. Pemasaran Hasil Pertanian. Penerbit
Papyrus, Surabaya.
Asmarantaka, R.W., 2009. Pemasaran Produk-produk
Pertanian. Bunga Rampai Agribisnis: Seri Pemasaran.
IPB Press, Bogor.
Badan Pusat Statistik Provinsi Sumatera Utara, 2015.
Sumatera Utara Dalam Angka 2015.
Downey W. David dan Steven P. Erickson, 1987.
Manajemen Agribisnis. Erlangga Jakarta.
ICMR 2018 - International Conference on Multidisciplinary Research
186

Fadhla T., B.A. Nugroho dan M.M. Mustajab, 2008.
Integrasi Pasar Komoditi Pangan (Beras, Kacang
Tanah Kupas Dan Kedelai Kuning) di Provinsi
Nanggroe Aceh Darussalam. Agritek, XVI (9).
Gujarati D. N., 2006.Dasar-Dasar Ekonometrika.
Terjemahan Mulyadi J.A. Penerbit Erlangga, Jakarta.
GumbiraSa'id E. dan A. HariztIntan, 2001. Manajemen
Agribisnis Indonesia. PT. Ghalia, Jakarta.
Heytens, P.J., 1986. Testing Market Integration.Food
Research Institute Studies, XX (1).
Kuma’at, 1992.Sistem Pemasaran Sayuran Dataran
Tinggi di Provinsi SulawesiUtara.Thesis MS –FPS
IPB, Bogor.
Kusnandar dkk, 2013. Rancang Bangun Model
Kelembagaan Agribisnis Padi Organik Dalam
Mendukung Ketahanan Pangan. Jurnal Ekonomi
Pembangunan Vol. 14 No. 1 Juni 2013. 92-101.
Kohls, R.L. and J.N. Uhl., 2002.Marketing of Agricultural
Products.A Prentice-Hall Upper Saddle River, New
Jersey.
Limbong W.H., 1999. Marketing System of Agricultural
Food Commodities in some Provence of
Indonesia.Journal of Agirculture and Resource Socio-
Economics, (Vol 12), IPB. Bogor.
Mubyarto, 1989.Pengantar Ekonomi Pertanian. Penerbit
LP3ES, Jakarta.
Ninuk Purnaningsih, 2007. Strategi Kemitraan Agribisnis
Berkelanjutan. Sodality:Jurnal Transdisiplin Sosiologi,
Komunikasi, dan Ekologi Manusia. Desember 2007, p
393-416 ISSN: 1978-4333, Vol. 01, No. 03.
Saragih Bungaran, 2001. Suara Dari Bogor: Membangun
Sistem Agribisnis. Yayasan USESE, Bogor.
Setiajie, I. 2004. Pengembangan Sub Terminal Agribisnis
(STA ) dan Pasar Lelang Komoditas Pertanian dan
Permasalahannya. Forum Penelitian Agro Ekonomi .
Vol. 22, Desember 2004 : 102-112.
Singarimbun dan Effendi 1995. Metode Penelitian Survey.
Penerbit LP3ES, Jakarta.
Syahza A, 2003. Paradigma Baru Pemasaran Produk
Pertanian Berbasis Agribisnis di Daerah Riau. Jurnal
Ekonomi, 8 (1): 1-11.
Syahza A, 2009. Model Pemasaran Produk Pertanian
Berbasis Agribisnis Sebagai Upaya Percepatan
Pertumbuhan Ekonomi Pedesaan. Jurnal Ekonomi, 85
(2): 1-12.
Institutional Analysis of Agribusiness Marketing in North Sumatra Agriculture Production Center
187
