
Image Analysis of Concrete to Detect the Potential of a Sequential
Rift
Fahmi, Jhoni Hidayat and Suherman
Department of Electrical Engineering, Faculty of Engineering, University of Sumatera Utara,
Jl. AlmamaterKampus USU Medan 20155 INDONESIA
Keywords: Crack detection, sequential, grayscale, median filter, edge detection, threshold, subtracted image.
Abstract. Concrete cracks in the construction world is a common phenomenon that occurs in all types of concrete
structures. Due to our ignorance of damage to concrete structures, small cracks are often ignored. In fact, a
small crack can cause a big disaster. Therefore, early detection of cracks in concrete itself is very important
that is expected to minimize the disaster caused. In detecting cracks of the concretesurface,a structure is
done by several methods. The purpose of this research is to detect the potential of cracking on the surface of
the concrete image with sequential digital image processing. In this research, crack detection is applied to
the concrete surface of concrete test result done by applying grayscale function, noise filter, edge detection,
threshold, followed by comparing the sequential image with image subtract method. Based on the research
data, the methods applied are able to detect the potential of crack in the sequential image with the
percentage of the result of True Positive Rate equal to 76.2% and False Negative Rate of 23.8%. The
applied methods can be used as one of the approaches to detect the potential of cracking on the surface of
concrete images in concrete press concrete sequentially.
1 INTRODUCTION
In the construction world, concrete is a composite
building material made from a combination of
aggregates and cement binders. In a concrete
structure, cracking is one of the serious problems
(Nishikawa, 2012). Although cracks are on the
surface, it is difficult to be visually detected if the
crack is small (Broberg, 2013). Each crack model
will result in damage and failure of various models
on concrete structures (Litorowitz, 2006). Each
concrete structure will surely have a crack, which
needs to be noticed is whether the crack can be
tolerated and is not at risk or cracks that harm the
overall structure of the building or not. Some of the
techniques used to check for cracks in concrete
include electron microscope scanners, fluorescent
optical microscopes. Percolation technique based on
liquid-based infiltration phenomena is based on
image processing (Yamaguchi, 2010). In recent
years, Micro-Computed X-ray Tomography (Micro-
CT) has emerged as a characterization tool because
of its ability to provide non-destructive three-
dimensional high-resolution images (Yu, 2016).
In this study, in detecting the potential of
sequential rupture, the authors applied a method
based on previous research on digital image
processing to detect cracks, then using subtract
image method to detect the potential of the crack.
2 MATERIAL AND METHOD
The implementation of the research begins by
identifying the problem and establishing the research
objectives. In the Research Design the Median Filter
method, Sobel edge, Otsu Threshold, Filter Area,
and Image Subtract Method are used. The observed
crack is a crack image that occurs on the specimen
when loaded by a compressive test machine. The
observed variables are image changes that occur
from the image comparison results during the test.
Sample data collection is done based on the
problem solved. The calculation of the sample data
test is required to obtain the performance results of
the applied method and draw conclusions.
Fahmi, ., Hidayat, J. and Suherman, .
Image Analysis of Concrete to Detect the Potential of a Sequential Rift.
DOI: 10.5220/0008881900310035
In Proceedings of the 7th International Conference on Multidisciplinary Research (ICMR 2018) - , pages 31-35
ISBN: 978-989-758-437-4
Copyright
c
2020 by SCITEPRESS – Science and Technology Publications, Lda. All rights reserved
31
2.1 Data Collection Process
The sample of concrete surface observed was
cylindrical concrete with diameter 15 cm, height 30
cm with concrete quality FC 41,5 (500 Kg / cm2).
FC 37.35 (450 Kg / cm2), FC 33.2 (400 Kg / cm2),
FC 29.05 (350 Kg / cm2) which is the material
available at the time of the study.
The data taken is the concrete surface image of
the compressive test, using Canon 60D DSLR
Camera with auto mode, equipped with external
tripod and shutter by sampling 1 frame in 2 seconds.
Data collection is done in the morning until the
afternoon from 10:00 to 15:00 pm in a laboratory
room with sunny weather conditions. The data taken
is expected to be static for each frame. The distance
between the camera and the test object is about 1
meter with sufficient lighting levels. The data
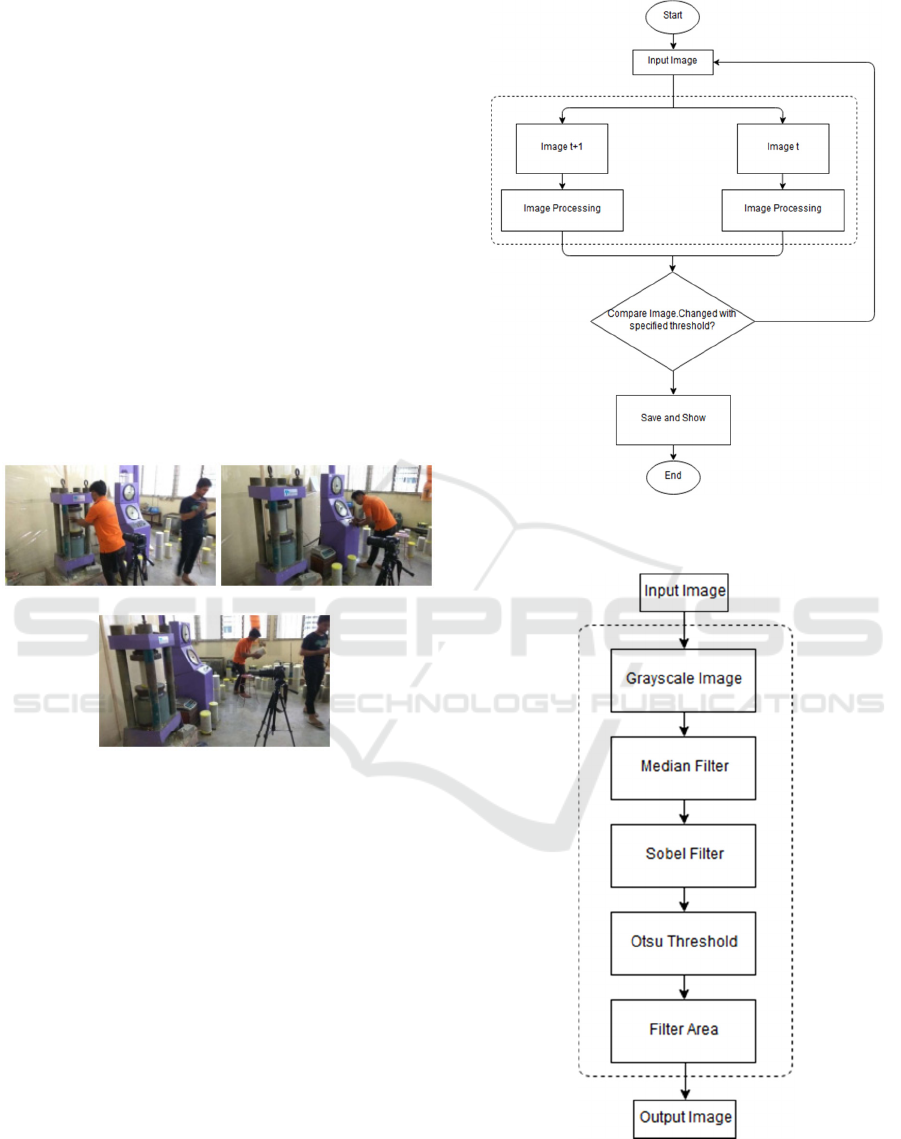
collection process is shown in Figure 1.
(a) (b)
(c)
Figure 1: Data collection process (a) Thespecimen put
into the test machine, (b) The process of loading the load
onto the specimen, (c) The process of retrieving the image
of the specimen.
2.2 Data Processing
Conducted data entry in the form of image t
0
and
image t
1
arethen processed through Processing Citra
with the application of functions and methods used
for data processing. Performingcomparison of pixels
per pixel between image t
+1
with image t, to find any
change in both images with a predetermined
threshold is done. If there is no change then re-
infiltrated is conducted until the final image, or until
the image changes above the specified threshold.
Then the changed image is saved and displayed. The
Data Processing Process can be illustrated through
the workflow diagram in Figure 2.
Figure 2: Diagram of the stage of data processing.
Figure 3: Diagram of image processing.
ICMR 2018 - International Conference on Multidisciplinary Research
32
2.3 Image Processing
From Sattar's research (Sattar,2016), in his
Processing method it is seen that the input image in
cropping or image cropping process at certain
coordinate is considered as a workarea and then
converted into a grayscale image, then re-processed
by noise filter that is by Median Filter method to
reduce noise on the image; then processed again for
edge detection using Sobel Filter, continued to Otsu
Thresholding with Filter Area. Image Processing
Process Diagram is shown in Figure 3.
2.4 Input Image
The input image is a digital image of a concrete
surface photo with a color image kernel (RGB) in
JPEG format with dimensions of 5184 x 3456
pixels. The input image is shown in Figure 4.
Figure 4: Input Image.
2.5 Grayscale Image
A grayscale image is a process done on a digital
image to change the original color of the image into
gray color. Input image in the form of the digital
image has 3 colors in each pixel: Red, Green, and
Blue, each with a different value. An illustration of
the RGB pixel values in the input image is shown in
Figure 5 and Figure 6.
Figure 5: The RGB value of the input image.
Figure 6: Grayscale changes in the input image.
2.6 Otsu Threshold
The next step is to determine the threshold using this
Otsu method. The Otsu method divides the image
into two groups, namely: target pixels and
background pixels (Sattar,2016 and Huang, 2015).
This method selects a threshold value based on the
minimization of intra-class variants (the variants in
the class). Minimizing intra-class variants is the
same as maximizing inter-class variants (Otsu 1979).
2.7 Measurement Parameters
The measurement of the performance results of the
method uses two parameters. The first parameter is
the True Positive Rate, i.e., the ratio of the number
of data features successfully detected, exactly
divided by the total number of sample data tested.
The second parameter is the False Negative Rate,
which is the ratio of the amount of data that is wrong
or failed to be detected by the total number of
sample data tested. Performance measurement
results of this method will be the conclusion of how
the success rate of the system is applied in research.
3 RESULTS AND DISCUSSION
The data used as the test sample are the drawings of
21 cylindrical concrete with the quality of FC 41.5,
FC 37.35, FC 33.2, FC 29.05 obtained from
laboratory tests taken sequentially with digital
cameras.Each concrete data has 15 or more images
taken in sequential. Before the image comparison
process is done, the sample data is a cropping
process or image cutting process at a certain
coordinate which is considered as a work area; then
proceeded to the image processing consisting of
grayscale process on the original image, filtering on
the grayscale image by using a median filter, edge
detection using Sobel and Otsuthreshold and filter
area to sample data shown in figure 7.
Image Analysis of Concrete to Detect the Potential of a Sequential Rift
33
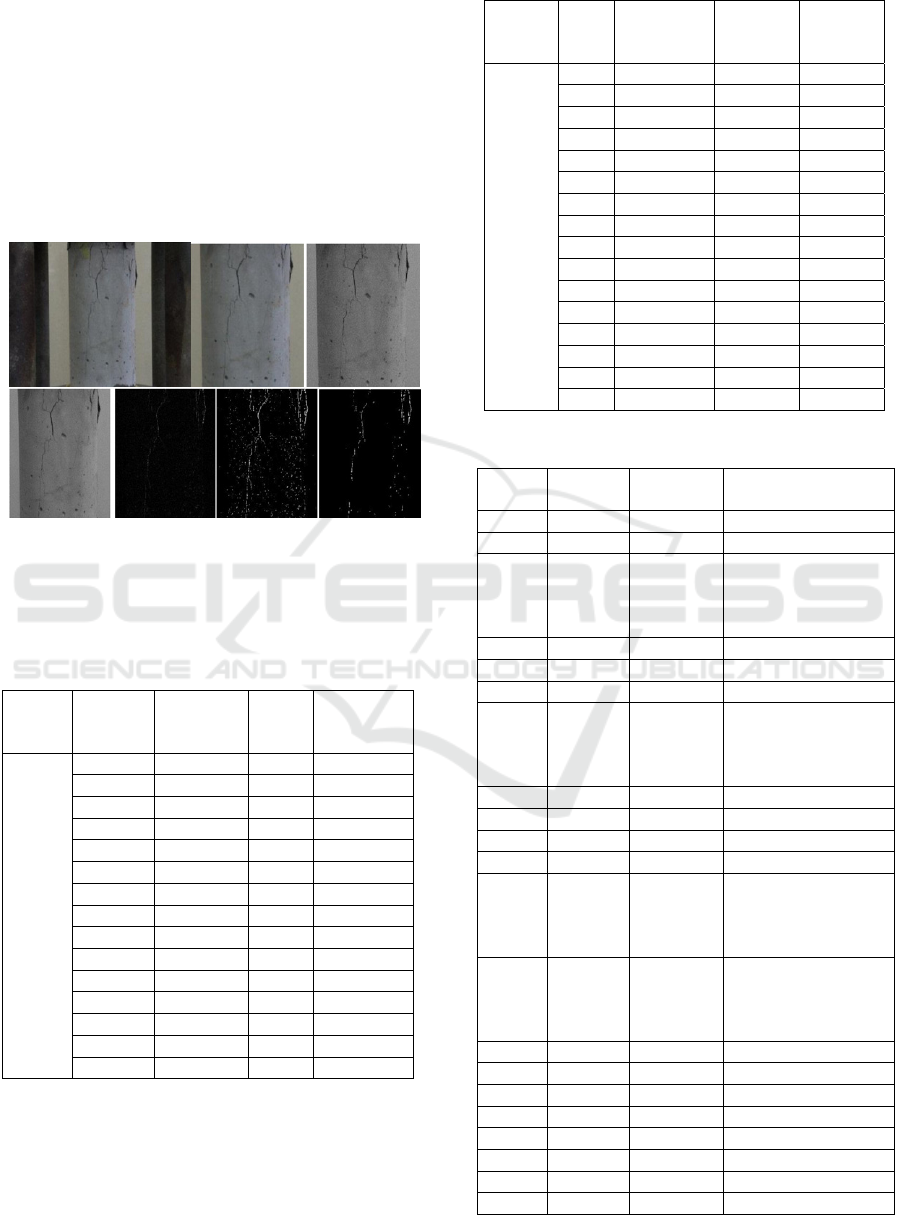
The test is performed on 21 test data, wherein
each test data has a sequential image data image
where objects with the number of an area less than
700 pixels are detected, considered as noise, then the
objects are removed. The value of the first test result
is obtained, considered an image that has the
potential to crack.
Table 1 and Table 2 show the test results of some
concrete by comparing the image after the image
before sequentially using the subtract image method
and the addition of the area filter function.
Figure 7: Results Process Image Processing(a) the
original image, (b) cropping the image for the work area,
(c) the grayscale image, (d) the image of the median filter,
(e) the filter result image, (f) the Otsu threshold image, (g)
filter area results.
Table 1: Results of concrete testing 1.
Concrete Time
Number of
Pixels
Image
Subtract
Testing with
area filter>
700
Con
crete 1
t0 887 - 0
t1 1103 1631 0
t2 971 1395 0
t3 1816 2751 0
t4 983 867 0
t5 1115 1576 0
t6 1116 1607 0
t7 1106 1470 0
t8 898 1127 0
t9 1020 1413 0
t10 754 1000 0
t11 875 1209 0
t12 1672 2867 1299
t13 1436 1053 0
t14 1270 1190 0
Table 2: Results of concrete testing 4.
Concrete Time
Number of
Pixels
Image
Subtract
Testing
with area
filter> 700
Con
crete 4
t0 2152 - 0
t1 3154 5258 0
t2 3400 5352 0
t3 2964 4413 0
t4 2973 5159 0
t5 2913 4730 0
t6 2447 4081 0
t7 2897 5230 0
t8 31421 64865 45068
t9 40358 64307 18133
t10 32173 44134 2522
t11 33265 50945 8938
t12 40813 59743 7734
t13 38260 51123 2385
t14 38299 54510 6793
t15 27825 39672 0
Table 3: Concrete Test Result.
Concrete
Total
Image
Test Result Description
1 15 True
2 15 True
3 15 False
The system does not
detect any cracks, but
cracks are seen in the
image t=13
4 16 True
5 16 True
6 16 True
7 16 False
The system detects a
crack in the image
t=5, but no visible
cracks
8 16 True
9 18 True
10 17 False
11 18 True
12 18 False
The system detects a
crack in the image t =
8, but the crack is seen
in the image t = 6
13 15 False
The system does not
detect any cracks, but
the crack is seen in the
image t = 12
14 15 True
15 18 True
16 18 True
17 18 True
18 15 True
19 18 True
20 18 True
21 18 True
ICMR 2018 - International Conference on Multidisciplinary Research
34

Based on Table 3 of the test results on 21
concrete, the results show the success of the
succession shown in Table 4
Table 4: Percent of Success.
Amount of
sample data
Number of
Testing True
True
Positive
False
Negative
21 16 76,2 % 23,8 %
From Table 4 based on the test data taken, the
result of the applied method is the ability to detect
precisely the potential of cracking in sequential
image with the percentage of result of True Positive
Rate equal to 76,2% and False Negative Rate equal
to 23,8%, where from 21 concrete tested, the number
of tests considered correct is 16 concrete.
4 CONCLUSION
From the research results obtained, the
conclusionsare as follows:
1. Methods in the research can be used as a
potential approach to the detection of cracks in
the image data sequentially concrete
compression test results.
2. From the research data, the applied method
resulted in a True Positive Rate is 76.2% and
from the 21 concrete tested, the correct test
amount is 16 concrete.
3. The method used can be applied to research
data with good image quality, adequate lighting
and static image of each frame of data retrieval
during research.
4. The success rate of detection depends on the
image capture process, as well as the quality of
the test image. The image quality and
illumination of the bad image will influence the
research result.
REFERENCES
B Yu, R S Bradley, C Soutis, and P J Withers, 2016. A
comparison of different approaches for imaging cracks
in composites by X-ray microtomography, in Royal
Society Publishing,
Broberg P, 2013. Surface crack detection in welds using
thermography, in NDT&E International, vol. 57,
pp.69-73.
Dorafshan Sattar , Maguire Marc , and Qi Xiaojun, 2016,
Automatic Surface Crack Detection in Concrete
Structures Using OTSU Thresholding and
Morphological Operations, in CEE Faculty
Publications.
EkaDodiSuryanto, 2015,
EkstraksiFiturHaralickMenggunakan Citra Mikroskop
Digital TrinocularUntuk Proses
IdentifikasiCacingPenyakit Kaki Gajah, in
TeknikElektro, FakultasTeknik, Universitas Sumatera
Utara.
Litorowicz A, 2006, Identification and quantification of
cracks in concrete by optical fluorescent microscopy,
in Cement and Concrete Research, vol. 36, pp. 1508-
1515
Nishikawa T, J Yoshida, T Sugiyama, and Y Fujino, 2012.
Concrete Crack Detection by Multiple Sequential
Image Filtering, in Computer-Aided Civil and
Infrastructure Engineering, vol. 27, pp. 29-47.
Sony NuryadinSyarifuddin, 2006, Analisis Filtering Citra
DenganMetode Mean
Filter dan Median Filter, in JurusanTeknikInformatika,
FakultasTeknikdan
IlmuKomputer, UniversitasKomputer Indonesia,.
Yamaguchi Tomoyuki and Shuji Hashimoto, 2010, Fast
crack detection method for large-size concrete surface
images using percolation-based image processing, in
Machine Vision and Applications, pp. 797 809.
Zhangcan Huang, Fan Xi, Liu HaiMing A.M.A. Talab,
2015, Detection crack in the image using Otsu method
and multiple filtering in image processing techniques,
in Optik - Int. J. Light Electron Opt.
Image Analysis of Concrete to Detect the Potential of a Sequential Rift
35
