
Coastline Dynamic in Belitung Timur: A Hydrodynamic and
Sediment Transport Model Approach
Hariyadi
1
, Pratomo Danar Guruh
2
, Handoko Eko Yuli
2
, Froditus Nicolody Ofirla Eflal
2
,
Wirasatrya Anindya
1
, Yusuf Muh
1
and Hutabarat Johanes
1
1
Department of Ocean Engineering, Faculty of Fisheries and Marine Sciences, University of Diponegoro,
50275, Semarang, Indonesia
2
Geomatics Engineering, Institut Teknologi Sepuluh Nopember, 60111, Surabaya, Indonesia
Keywords: The Coastline Dynamic, Belitung Timur, Hydrodynamic, Sediment Transport.
Abstract: This research developed a three-dimensional hydrodynamic model to simulate the flow and sediment transport
pattern in Belitung Timur coastal area. The hydrodynamic model was formed by sea level variations and river
discharges to generate the simulation of the flow pattern in the research area. Based on this simulation, a
sediment distribution pattern was modelled to understand the accretion and erosion processes in the research
area. The sediment transport model implemented non-cohesive and cohesive sediment classes. The advection-
diffusion algorithm was utilized to get the picture of suspended-sediment transport pattern in water column.
Flux formulations were implemented to understand the erosion and deposition of the sediment. The maximum
current magnitude is 0.3 ms-1 which occurs during spring tide period. The sediment transport rate is 18 x 10-
4 m2s-1 with alteration of the depth is approximately 0.2m up to 0.6m. The sedimentation processes in the
area could modify the coastline morphology and ultimately will affect the boundary definition in this area.
1 INTRODUCTION
The coastline is an area with unique ecosystems
which is interconnected with the beach. A coastal area
is a very dynamic area as well as its coastline
(Mukhtar, et.al, 2018). The coastal area in Belitung
Timur regency is active as many activities located in
this area. The regency contributes great revenue to the
state from the mining sector especially minerals.
Belitung Timur has a potential of a unique natural
resources especially sand, kaolin, quartz, and lead
mining activities (Natasia, et.al, 2016). These mining
activities, apparently, cause various effects on the
environment such as changes in the coastline.
In addition to mining activities, changes of
coastline also caused by the abrasion in the coastal
area because of the dynamics of the ocean. Here, the
hydrodynamics modelling was used to monitor the
alteration of the coastline in Belitung Timur. In this
research, a hydrodynamic model was utilized to
analyze changes in coastline due to the dynamics of
the ocean. The research attempted to investigate the
variations of the shoreline dynamic in Belitung Timur
due to mining activity based on the sediment
distribution pattern.
2 IMPLEMENTATION OF
RESEARCH
2.1 Research Area and Data
The location of this research is on the eastern coastal
area of Belitung Timur, Bangka Belitung province.
The geographical location of the area is 2˚20’00” S
and 108˚00’00” E to 3˚20’00” S and 108˚40’00” E,
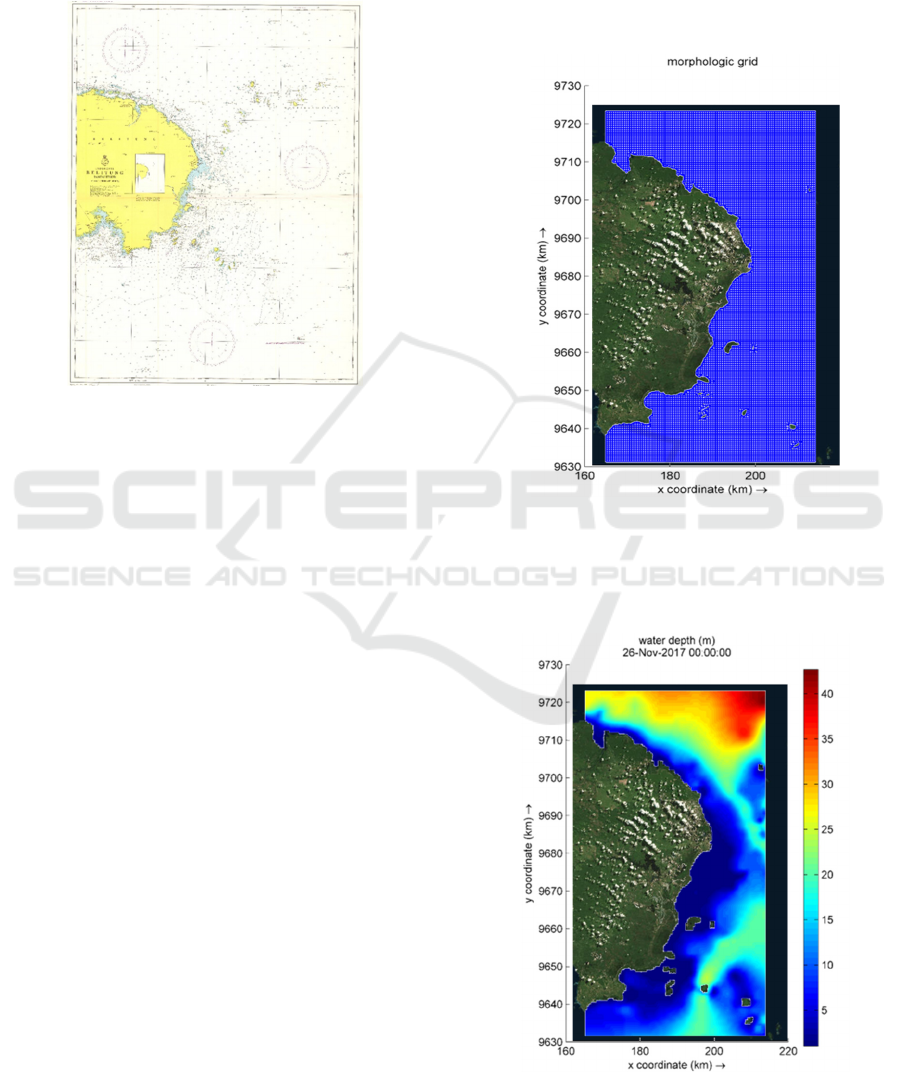
which is shown in Fig 1.
The main spatial data used in this research was
derived from Belitung Timur Chart with 1:200,000 in
scale provided by Pushidrosal (2001). The hydro-
oceanographic data used in the research are
bathymetry data, tidal, river discharge, and wind of
Belitung Timur. In addition to these data, cohesive
and non-cohesive sediment samples are also used to
generate the model which sand is the dominant
sediment type in the area.
Hariyadi, ., Guruh, P., Yuli, H., Eflal, F., Anindya, W., Muh, Y. and Johanes, H.
Coastline Dynamic in Belitung Timur: A Hydrodynamic and Sediment Transport Model Approach.
DOI: 10.5220/0008848601950199
In Proceedings of the 6th International Seminar on Ocean and Coastal Engineering, Environmental and Natural Disaster Management (ISOCEEN 2018), pages 195-199
ISBN: 978-989-758-455-8
Copyright
c
2020 by SCITEPRESS – Science and Technology Publications, Lda. All rights reserved
195
The research utilized Delft3D as a hydrodynamic
modelling software, ArcGIS 10.3 to perform the on-
screen digitation process, Matlab R2014a to support
the data processing, and file format conversion
software.
Figure 1: Belitung Timur Chart (Pushidrosal).
2.2 Methods
The early stages of the data processing in this research
is rectification and on-screen digitation of the
Belitung Timur chart using ArcGIS. This is
performed to produce coastlines in a shapefile (*.shp)
format. The next stage is building a mesh. The
process was accomplished by using RGFGRID
module. The grid used in the research is a structured
grid type, with rectangular shape model.
The mesh is created by merging the grid and
depths data using QUICKIN module. The
interpolation used a triangular irregular network
method. The main parameter of flow generators is
from the water level variation. The open boundaries
condition in this research is generated by water level.
The simulation model was run for 29 days from
November 26 to December 26, 2017 with time frame
that is divided into 4.5 days (warming up), 0.5 days
(spin up), and 24 days (simulation). In this research
used time step 0.5 seconds which considered terms of
stability (CFL - Courant Fredrich Lewy).
3 RESULTS AND DISCUSSION
3.1 Domain Model (Mesh)
The research used 500m × 500m grid for representing
the modelling area. Fig 2 shows the grid used in the
research.
Figure 2: Grids model of the research area.
The result of a depth interpolation process with a
triangular interpolation grid method on entire grid
models can be seen in Fig 3.
Figure 3: Model Domain.
ISOCEEN 2018 - 6th International Seminar on Ocean and Coastal Engineering, Environmental and Natural Disaster Management
196
3.2 Tide
Tide observation is used as an input parameter of the
model. The tidal power generator and the flow are the
main force for simulating the hydrodynamics
condition in the vicinity area. Based on the tidal
analysis, Belitung Timur water has mixed
semidiurnal dominant tide type.
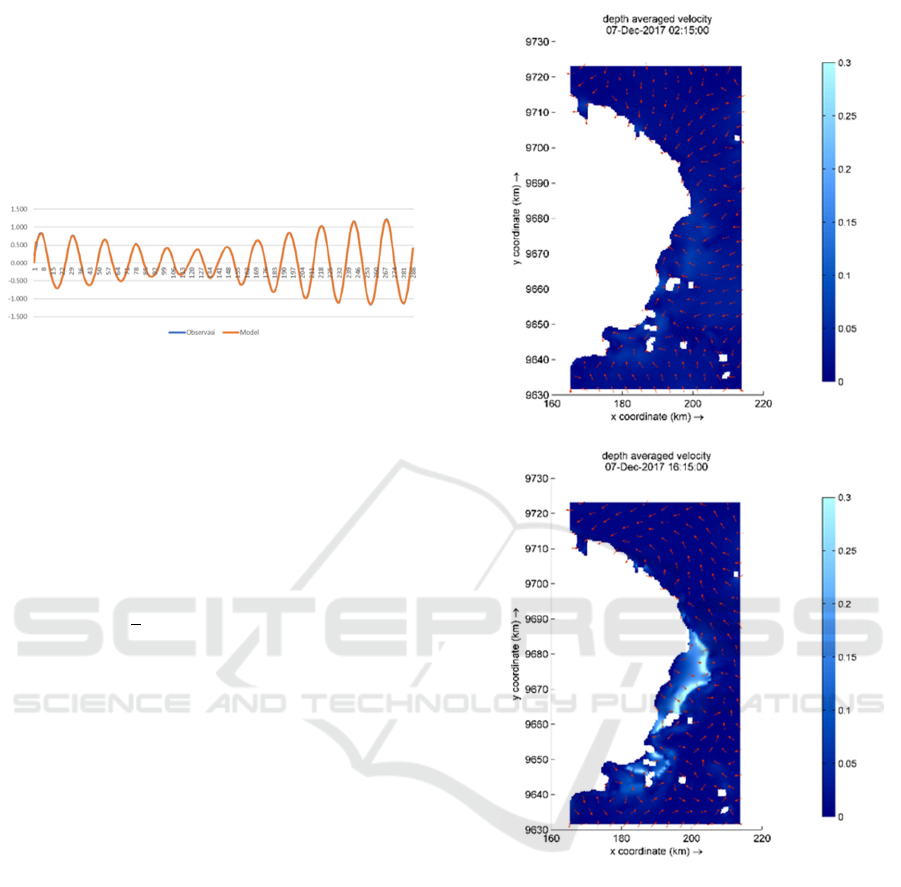
Figure 4: The Comparison Between Tide Observation and
Model Data.
Fig 4 shows the comparison diagram of the
observation tide and the model data. Data modeling
in the time window has a Mean Absolute Error
(MAE) of 0.004m This indicates that MAE value
obtained is relative small, with error rate belongs to
small classification (Wilmott and Matsuura, 2005).
The Formula 1 shows the calculation of MAE:
𝑀𝐴𝐸
∑
𝑥
,
𝑥
,
0.004 𝑚𝑒𝑡𝑒𝑟𝑠
(1)
Based on the statistic tests, the results comply the
requirement. The next process is building sediment
transport model according to the flow model
(Khotimah, 2012).
3.3 Hydrodynamic Modelling
Process modelling of hydrodynamics generate the
conditions of flow and sediment transport modelling
approach of motion dynamics of the sea in Belitung
Timur. In this research generated simulation of the
flow indicated by Fig 5, as follows:
(a) Spring Tide
Figure 5: Patterns of Flow at (a) Spring Tide Period and (b)
Neap Tide Period.
Coastline Dynamic in Belitung Timur: A Hydrodynamic and Sediment Transport Model Approach
197
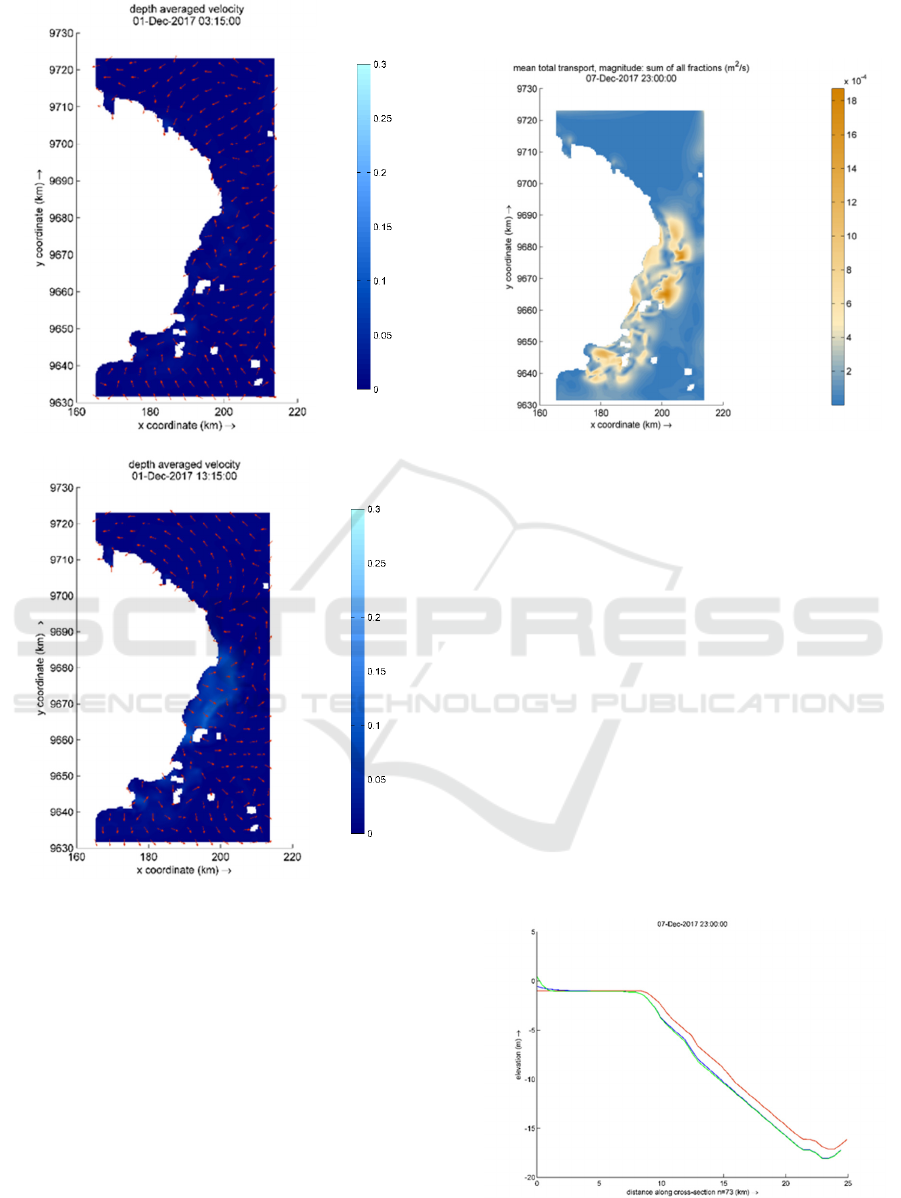
(b) Neap Tide
Figure 5: Patterns of Flow at (a) Spring Tide Period and (b)
Neap Tide Period (cont.).
The flow pattern was analyzed in two periods
(spring and neap tide periods). During the spring tide
(Fig 5a), the depth average velocity is between
0.05ms
-1
to 0.3ms
-1
. The largest flow velocity occurs
on Selandu Island. The largest velocity of flow also
occurs on Selandu Island in the neap tide period.
Overall flow during this period between from
0.05ms-1 to 0.2ms-1. The dominant flow direction
on both a period is moving from deep sea towards the
land on flood conditions. In contrast to the dominant
ebb tide conditions leads to Northest and Southeast.
Analysis of sediment distribution pattern in this
research based on the condition from magnitude of
the mean total transport, shown in Fig 6.
Figure 6: The Mean Total Transport at Belitung Timur.
Fig 6 shows the largest sediment transport
conditions occur around at Selandu Island
(designated by red box), yet the magnitude of
sediment transport is relative still small conditions,
between 4x10⁻⁴ m2s-1 to 8x10⁻⁴ m2s-1.
3.4 The Coastline Changes
In order to show the coastline changes in Belitung
Timur, the analysis process was performed by
creating the cross-sections of the seabed at the coastal
area. The comparison is completed by taking pieces
of the transverse cross-section from the beach to the
deep sea areas in 3 conditions: initial, middle, and
finish from simulation condition. Fig 7 and 8 show
the comparison chart of the bed level from some
samples of the transverse cross-section in the
Belitung Timur.
Figure 7: The Cross-Section of North Coastal Area from
Linggang’s River.
ISOCEEN 2018 - 6th International Seminar on Ocean and Coastal Engineering, Environmental and Natural Disaster Management
198
In Fig 7, the erosion occurs in 10.0m to 25.0m of
the depth from the coastal area. The depth variation
arises in approximately 0.2m to 0.6m deeper than
initial conditions. The coastal area was altered;
however, the alteration is not significant.
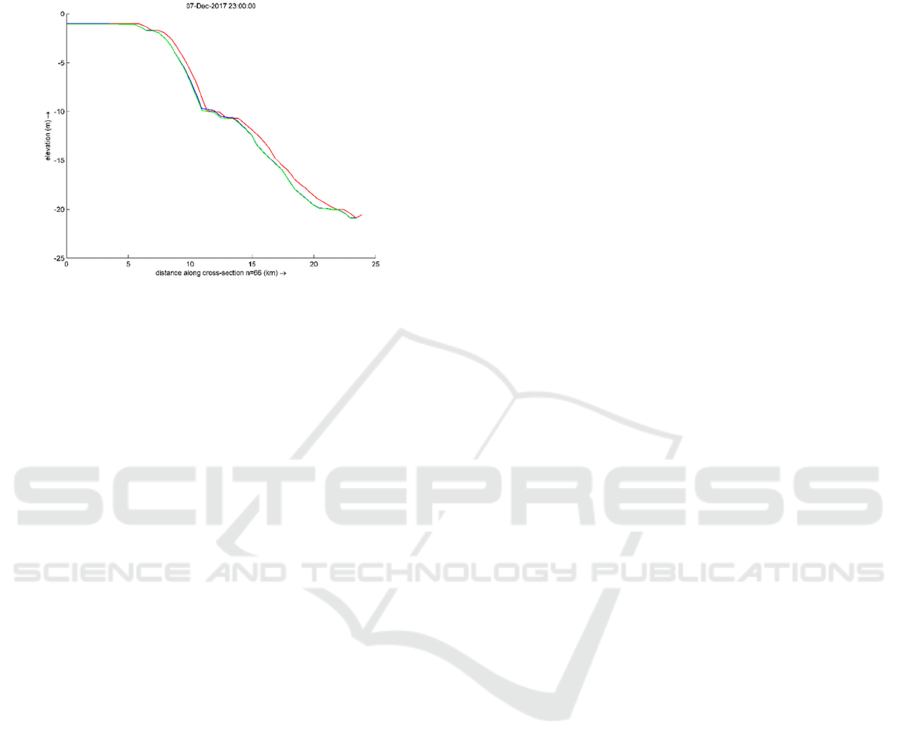
Figure 8: The Cross-Section of South Coastal Area from
Linggang’s River.
The sample of the transverse cross-section at
South of Linggang’s River, shown by Fig 8. Notice
that the erosion occurred at a distance 5.0m to 10.0m
from coastal area. The change of the depth ranges
from 0.2m to 0.4m. It is clearly shown that at the
distance of 10.0m to 15.0m from the coastal area, the
activity of erosion and sedimentation is quite
significantly altered from initial condition.
4 CONCLUSION
Based on the results of processing and data analysis,
the coastline changes which occurred in the coastal
area of Belitung Timur because of abrasion. The
magnitude of the changes in the coastline due to
abrasion is maximum 0.6m from the initial condition,
with simulation period is 1 month. The main factors
cause the magnitude of the changes coastline is a
small value of grain size sediment on Belitung Timur,
thus the mainland easily eroded by ocean waves or
current that comes. The mining activities at Belitung
Timur also accelerate the change of shoreline.
REFERENCES
C.J. Willmott, K. Matsuura, 205. Adv MAE and RMSE,
Clim. Res., 30.
M. K. Mukhtar, T. Hariyanto, C. B. Pribadi, 2018. Evaluasi
Perubahan Garis Pantai, POMITS.
M. K. Khotimah, 2012. Validasi Tinggi Gel. Sig., UI.
N. Natasia, M. N Barkah, D. H. Saputra, M. K. Alfadli,
2016. Studi Awal Potensi Bahan Galian Pada Daerah
Kabupaten Belitung Timur, BSC 14.
Coastline Dynamic in Belitung Timur: A Hydrodynamic and Sediment Transport Model Approach
199
