
Labor, Digital and Growth GDP Analysis: Case Study of ASEAN
Countries
Helmi Adam
*
, Muhammad Asrian Mirza, Sri Iswati
Universitas Borobudur Jakarta
Keywords : Labor, Digital, GDP, ASEAN
Abstract :The ASEAN Economic Community was formed with the aim of achieving the perfection of economic
integration in the ASEAN region which is believed to provide tangible benefits for all elements of society.
On the other hand, the use of technology in the company will also affect how much work is needed.
Technological sophistication alone does not necessarily result in a decrease in the number of workers.
Technological progress will lead to better production results. This study uses a quantitative method with
panel data secondary to the 2011-2015 period by combining 10 ASEAN countries (Indonesia, Malaysia,
Singapore, Thailand, Philippines, Vietnam, Myanmar, Brunei, Laos, Cambodia). From the calculation of T-
Test, Effect of Labor on GDP so that it can be concluded that the labor variable partially influences the
significance of the GDP variable and effect of Digital on GDP so it can be concluded that the Digital
variable partially influences the positive significance of the GDP variable. From the calculation of F value,
that simultaneously or together the independent variables have a significant effect on the dependent
variable. Koefisein Determination, Based on the table above, the Adjusted R-Square value is 0.9975. This
shows that the model is able to explain 99.75% of the dependent variable, while the remaining 0.25% is
influenced by other factors outside the regression model. Labor and digital influences on GDP are already
good, but there are some countries that have to be improved again such as Myanmar, Laos and Cambodia.
The policies of these three countries in the use of digital technology are expected to improve the welfare of
the workforce. If digital technology has been implemented properly, all countries in ASEAN will get the
same welfare.
1 INTRODUCTION
The ASEAN Economic Community (AEC) was
formed with the aim of achieving the perfect
economic integration in the ASEAN region which is
believed to provide tangible benefits for all elements
of society. According to Abdurofiq (2015) explains
there are at least 4 (four) things that become the
focus of the implementation of the AEC, first,
countries in the market unity and production base.
Second, AEC will be used as a region with a very
high level of competition. Third, the AEC will be
used as a joint with equitable economic
development. Fourth, the AEC will be integrated
into equitable economic development among the
entire ASEAN region.
In the case of Labor, Increasing the wage rate
will result in an increase in production costs, so that
it will increase the per unit price of the product
produced. If the per unit price of the product being
sold is increased, the reaction that usually arises is to
reduce the purchase or no longer buy the product. So
that there will be a change in the production scale
called the effect of production scale (scale effect)
where a condition that forces producers to reduce the
number of products produced, which in turn can also
reduce the company's workforce. An increase in
wages assuming the price of other capital goods
remains, the entrepreneur has a tendency to replace
labor with machinery. The decrease in the number of
workers due to the replacement with a machine is
called the substitution effect. On the other hand, the
use of technology in the company will also affect
how much work is needed. Technological
sophistication alone does not necessarily result in a
decrease in the number of workers. Technological
progress will lead to better production results, but its
ability to produce products in the same or relatively
equal quantity. Furthermore, the amount of labor
demanded can be determined by the level of
Adam, H., Mirza, M. and Iswati, S.
Labor, Digital and Growth GDP Analysis: Case Study of ASEAN Countries.
DOI: 10.5220/0008784802570261
In Proceedings of the 2nd International Research Conference on Economics and Business (IRCEB 2018), pages 257-261
ISBN: 978-989-758-428-2
Copyright
c
2020 by SCITEPRESS – Science and Technology Publications, Lda. All rights reserved
257

productivity of the workforce itself. Productivity is
the ability to produce something.
2 LITERATURE REVIEW
2.1 Labor
According to Takyuddin (2016) explains Labor is
defined as a population in the working-age
population. Whereas the definition of labor is
contained in Law No. 25 of 1997 concerning
Manpower, namely every man or woman who is in
and/or will do work, both inside and outside the
employment relationship to produce goods or
services to fulfill community needs. According to
Dumairy (1997) labor is a population that has an age
within the working age limit. The purpose of
choosing the age limit is so that the definition given
is as possible as describing the actual reality. Each
country chooses a different age limit because the
situation of labor in each country is also different, so
that the working age limit between countries is not
the same. In Indonesia, the minimum age limit for
labor is 15 years without maximum limits.
2.2 Digital
Setiawan (2017) explains that the digital world not
only offers great opportunities and benefits for the
public and business interests. But it also presents
challenges to all areas of life to improve quality and
efficiency in life. The use of various technologies
really makes life easier, but even a digital lifestyle
will depend more on cellphone and computer usage.
According to Musafak (2012) explained that the
digital economy is an economy based on electronic
goods and services produced by electronic
businesses and traded through electronic commerce.
That is, businesses with electronic production and
management processes and who interact with
partners and customers and conduct transactions
through the Internet and Web technologies. Musafak
(2012) also describes the Digital Economy definition
version of Encarta Dictionary is "Business
transactions on the Internet: the marketplace that
exists on the Internet". Understanding Digital
Economy focuses more on transactions and markets
that occur in the internet world. A broader
understanding of just transactions or markets is the
New Economy which according to PC Magazine is
"The impact of information technology on the
economy". The understanding is more emphasized
on the application of information technology in the
economic field. The digital economy is the
economic sector which includes goods and services
when developing, producing, selling or supplying
depends on digital technology.
2.3 GDP
Economic growth is the development of activities in
the economy which causes goods and services
produced in society to increase so that it will
increase the prosperity of the community (Sukirno,
1994) in Suparyati (2015). Still in Suparyati (2015)
according to Budiono that economic growth is a
process of increasing per capita output in a long
period.
According to Athukorala (2003) in (Jufrida,
2016), foreign investment has a positive impact on
the economy of the host country because through
foreign investment can increase the availability of
funds for the host country (recipient country). But
the results of research conducted did not find a
significant relationship between FDI and economic
growth, especially for developing countries. (Liu
and Su 2016 in Jufrida, 2016) also conducted
research on the impact of FDI and human capital on
economic growth in China by using panel data of
cities in China from 1991 to 2010. They tested the
determinants of economic growth with a focus on
the role of FDI and human capital with the human
capital-augmented Solow model. The results show
that the GDP growth rate per capita is negatively
related to the rate of population growth and is
positively related to the level of investment in
physical capital and human capital. They also found
that FDI had a positive effect on GDP per capita
growth and this effect was intensified by ownership
of urban human capital. The total foreign investment
and domestic investment, both government and
private, is one of the variables in the calculation of
national income which is a benchmark of economic
growth, therefore investment should be maintained
in the development of stability and continued efforts
to increase.
3 METHOD
The population that became the object in this study
came from secondary data obtained from the
company Knoema, one of the digital economic data
provider companies. The sampling method uses
purposive sampling method, namely the
determination of samples with certain
considerations. In this study the sample was used
IRCEB 2018 - 2nd INTERNATIONAL RESEARCH CONFERENCE ON ECONOMICS AND BUSINESS 2018
258
using panel data obtained by time series data for 5
years and cross-section data of 10 ASEAN countries
namely Indonesia, Malaysia, Singapore, Philippines,
Thailand, Vietnam, Myanmar, Laos, Brunei,
Cambodia.
3.1 Variable Identification
Research variables are independent and dependent.
for the independent variables that exist in this study
are Labor (X1), Digital (X2) while the dependent
variable GDP (Y).
3.2 Data analysis
The analytical method used in this study is a
quantitative technique that uses mathematical and
statistical models that are classified in certain
categories to facilitate analysis using the Eviews
program. While the analysis technique used is
multiple linear regression analysis techniques to see
the relationship between the independent variable
and the dependent variable. The data used is the
panel data there are three kinds of data panel
estimation techniques, namely pooled the least
square, fixed effect model, and random effect model.
Test the suitability of the model to determine the
most appropriate model is to use the Chow test.
After that, the classic assumption test is a normality
test and also hypothesis testing, namely partial t-test,
simultaneous F test, a test of the coefficient of
determination.
3.3 Econometry Model
The analysis technique in this study is a panel data
regression analysis, while the regression model in
the form of logs can be written as follows:
ln Y
it
= β
0
+ β
1
ln X1
it
+ β
2
ln X2
it
+ e
it
(1)
Where:
Y = Tourism; X1 = Labor; X2 = Digital, i =
Country; and t = time.
4 RESULT
There are three estimations of panel data regression,
namely common effects (OLS), fixed effect models
(FEM) or Random Effect (REM) models.
Determining the panel model that will be used in this
study, several tests must be carried out. Chow Test
that can be used to determine whether the panel data
model can be regressed with common effect models
(OLS), fixed effect models (FEM) or Random Effect
(REM) models. Chow test is used to determine
whether the panel data model is regressed with the
Common Effect model or with the Fixed Effect
model.
H0: The best model is the Common Effect
H1: The best model is the Fixed Effect
4.1 Chow Test
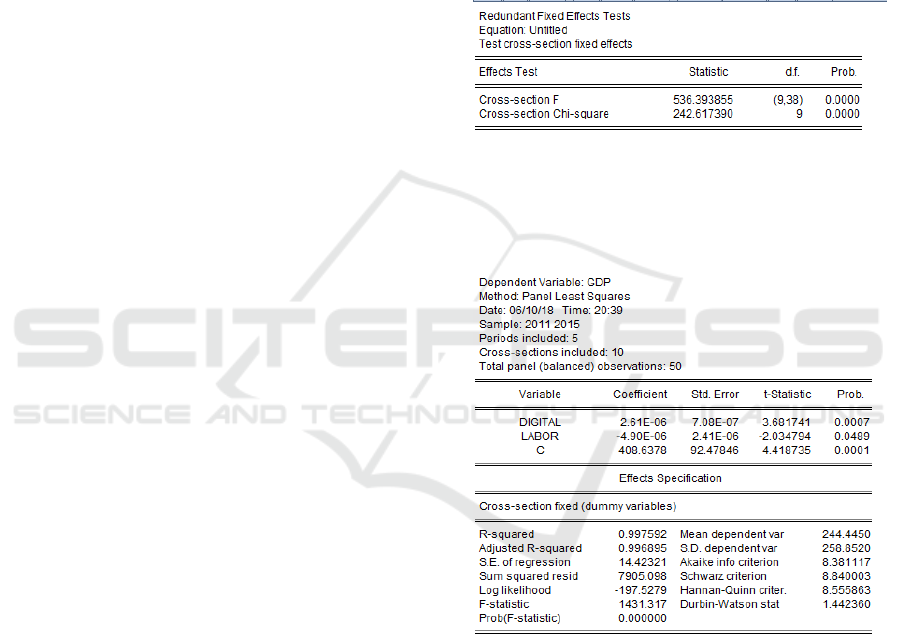
Table 1: Chow Test
The table above shows that the best model is the
fixed effect because the Chi-square probability value
is below 0.05, this means that H0 is accepted.
Table 2: Fixed Effect Model
From the results of panel data regression with the
selected model is the Fixed Effect model, the
regression model equation is obtained as follows:
GDP = -4.90 (Labor) + 2.61 (DIGITAL) + e (2)
Labor, Digital and Growth GDP Analysis: Case Study of ASEAN Countries
259
4.2 Normality test
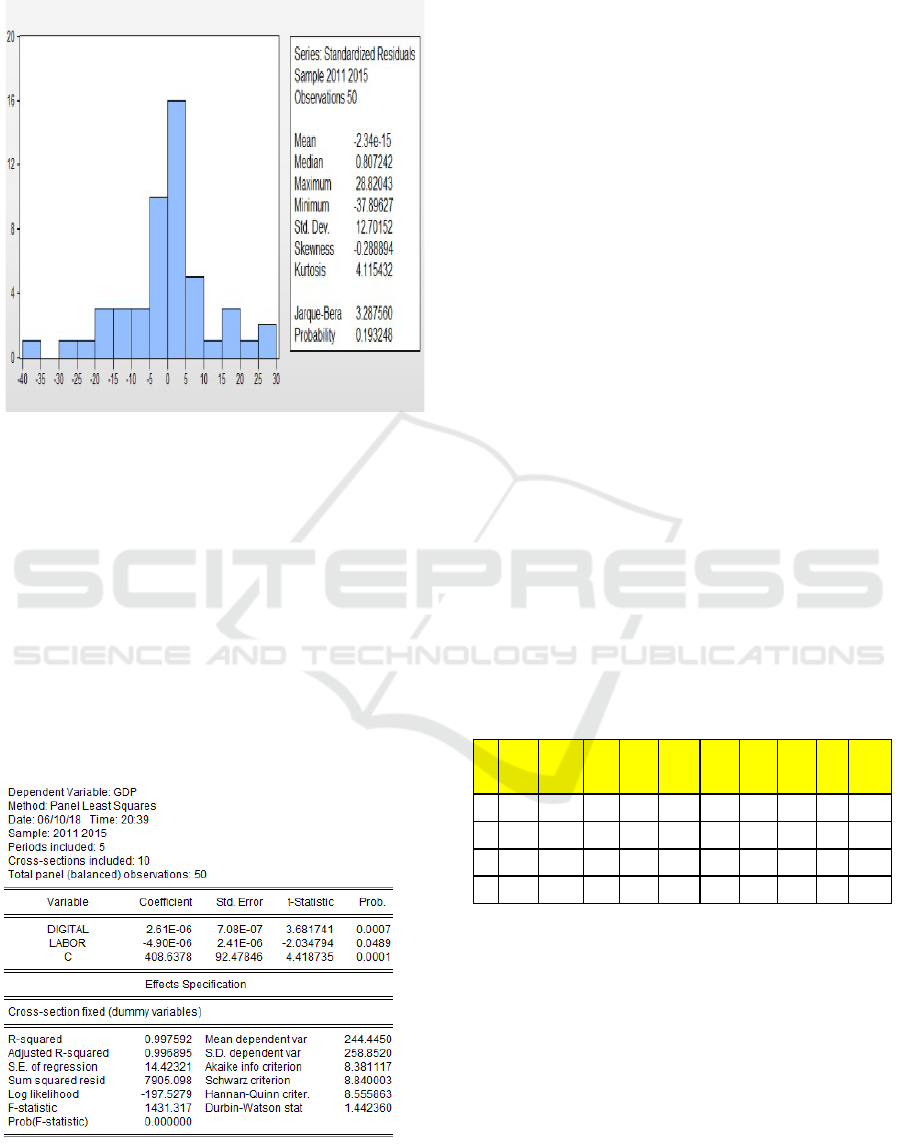
Figure 1: Histogram
From the output that has been tested, it states that the
histogram form is distributed symmetrically so that
the residuals are distributed normally. Based on the
JB statistical test, the value is 3.287 with a
probability of 0.1932 while the chi-square value
with significance (α = 5%) is 0.05, so JB < Chi
Square, then H0 is accepted and H1 is rejected
meaning that the residual is normally distributed.
4.3 T test (Partial)
Table 3: T test (partial)
Based on the results above as follows:
4.3.1 Effect of Labor on GDP
The t-statistical probability value obtained is 0.0489,
then the statistical probability <α = 5% is 0.0489
<0.05, but the coefficient value is -4.90. So it can be
concluded that the labor variable partially does not
affect but the significance of the GDP variable.
4.3.2 Effect of Digital on GDP
The obtained t-statistical probability value is 0.0007.
Then the statistical probability <α = 5% is 0.0007 <
0.05. So it can be concluded that the Digital variable
partially influences the positive significance of the
GDP variable.
4.4 F Test (Simultaneous)
From the calculation of F value, it is known that F
arithmetic > F table (1431.317 > 3.18) then H0 is
accepted and H1 is rejected (F arithmetic is in H1
reception area). Then also the probability (prob.) Of
the table above is equal to 0.000 > 0.005, then H0 is
accepted and H1 is rejected. So that simultaneously
or together the independent variables have a
significant effect on the dependent variable.
Coefficient of Determination
, Based on the table
above, the Adjusted R-Square value is 0.9975. This
shows that the model is able to explain 99.75% of
the dependent variable, while the remaining 0.25%
is influenced by other factors outside the regression
model.
Table 4: Growth Labor
growth
La bo
r
Indonesia Malaysia Si ngapura Thai land Phil ipnes Vietnam Myanmar Laos Brunei Kamboja
2012 2,58 3,43 3,42 (0,23) 1,00 1,75 0,73 1,29 0,48 (2,17)
2013 1,11 3,89 0,86 (1,64) 1,16 1,47 0,78 1,24 (0,64) 0,05
2014 1,23 2,09 1,15 (0,17) 1,98 1,34 0,80 1,26 (0,37) 1,65
2015 1,19 1,64 1,97 (0,08) 2,12 1,08 0,66 1,60 1,42 1,74
5 DISCUSSION
Effect labor, digital to GDP is good enough, but
must be increased in labor. In table 4 it can be
explained that Singapore has good labor, it looks
good labor growth. Whereas for the country of
Thailand has decreased, this means that labor factors
are very problematic in this country. Whereas other
countries, seen the growth of labor has been good
even though growth from year to year often changes,
IRCEB 2018 - 2nd INTERNATIONAL RESEARCH CONFERENCE ON ECONOMICS AND BUSINESS 2018
260

sometimes increases, sometimes decreases.
Government policy to provide training so that labor
becomes quality and has high productivity. Mastery
of digital technology for labor is needed so that labor
can work effectively and efficiently.
6 CONCLUSION
This study aims to analyze the relationship between
Labor, digital towards ASEAN countries GDP in the
period 2011-2015 using panel data regression
analysis techniques. Based on the results of
statistical tests, the following conclusions can be
drawn:
6.1 Effect of Labor on GDP
The t-statistical probability value obtained is 0.0489,
then the statistical probability <α = 5% is 0.0489 <
0.05. So that it can be concluded that the labor
variable partially influences the significance of the
GDP variable. Effect of Digital on GDP, the
obtained t-statistical probability value is 0.0007.
Then the statistical probability <α = 5% is 0.0007 <
0.05. So it can be concluded that the Digital variable
partially influences the positive significance of the
GDP variable.
6.2 The Calculation of F Value
It is known that F arithmetic > F table (1431.317 >
3.18) then H0 is accepted and H1 is rejected (F
arithmetic is in H1 reception area). Then also the
probability (prob.) Of the table above is equal to
0.000 > 0.005, then H0 is accepted and H1 is
rejected. So that simultaneously or together the
independent variables have a significant effect on
the dependent variable. Coefficient of
Determination, Based on the table above, the
Adjusted R-Square value is 0.9975. This shows that
the model is able to explain 99.75% of the
dependent variable, while the remaining 0.25% is
influenced by other factors outside the regression
model.
REFERENCES
Abdurofiq, Atep.2015.Menakar pengaruh Masyarakat
Ekonomi ASEAN Terhadap Pembangunan
Indonesia.Jurnal Filsafat dan Budaya Hukum
Amala, Faizatul & Unggul Herqbaldi.2015.Dampak
keterbukaan perdagangan internasional terhadap
pertumbuhan ekonomi : pendekatan panel dinamis.
Jurnal Ekonomi dan Bisnis. Universitas Airlangga
Astuti.Pudji.2018.Analisis pengaruh
ROE,EPS,PBV,BVPS,PER dan kepemilikan institusi
tehadap harga saham peruahaan. Jurnal Ekonomi.
Univesitas Borobudur
Ghzhali, Imam, 2013. Aplikasi Analisis Multivariat
dengan Proram IBM SPSS 21. Edisi7.Semarang:
Universitas Diponegoro.
Li.Quan & Rafael Reveny.2013. Economic Globalization
and Democracy. British Journal of political science
Nikita, Anastasia.2017. Pengaruh pendapatan per kapita
terhadap jumlah wisatawan asing dan PDRB sektor
pariwisata Sulawesi Utara.. Jurnal Berkala Ilmia
Efisiensi
Musafak. 2012. Budaya ekonomi digital kalangan
masyarakat menengah atas. Universitas Gunadarma
Razmi, Mohammad Javad. 2013. The effect of trade
openess and economic freedim on economic growth:
the case of east and east asian contries. International
Journal of Economics and Financial Issue.
Semancikova, Jozefina. 2016. Trade, Trade Openes and
macro economic performance.International Journal
Elsevier
Setiawan, Wawan.2017. Era Digital dan
Tantangannya.Universitas Pendidikan Indonesia
Sugiyono. 2013. Metode Penelitian Kuantitatif, Kualitatif
dan R & D. Bandung: Alfabeta.
Takyudin. Muh.2016.Analisis penyerapan tenaga kerja
pada usaha percetakan fotocopy di Kota Kendari.
Jurnal Ekonomi. Universitas Haluoleo
Zaroni, Akhmad Nur.2015.Globalisasi ekonomi dan
implikasinya bagi negara-negara berkembang: telaah
pendekatan ekonomi islam. IAIS Samarinda
Labor, Digital and Growth GDP Analysis: Case Study of ASEAN Countries
261
