
The Study on the Resistance Test Performance of BPPT Mini
Submarine
Erwandi
1
, Mohammad R. Utina
1
, Totok T. Murwatono
2
and Siti Sadiah
2
1
Technology Center for Maritime Industrial Engineering, PTRIM BPPT Jl. Hidrodinamika BPPT, Kampus ITS Sukolilo
Surabaya
2
Indonesian Hydrodynamic Laboratory IHL BPPT Jl. Hidrodinamika BPPT, Kampus ITS Sukolilo Surabaya
Keywords: Submarine, Submerge, Surface, Model, Resistance, CFD
Abstract: This paper describes the study on resistance test performances of Agency for the Assessment and
Application of Technology / Badan Pengkajian dan Penerapan Teknologi (BPPT) mini submarine (midget)
conducted at the towing tank of Indonesian Hydrodynamic Laboratory (IHL) BPPT. Two studies are carried
out to estimate the resistance force of the mini submarine, numerical analysis using Computational Fluid
Dynamics (CFD) and model testing at towing tank. Numerical analysis is employed to evaluate the pressure
and frictional force in the opposite direction of the mini submarine movement. A physical model provided
with the sail and tail is produced at IHL workshop. It has length 3.142 m is made from wood. The model is
towed in two conditions: surface condition and submerged condition in 2 m from the surface. The results
show a good agreement between numerical and experimental.
1 INTRODUCTION
The study on design of Indonesian Mini-Submarine
actually had been started on May 2007 by
Indonesian Navy and IHL BPPT. It was put
emphasis on understanding the hydrodynamic
performance of the submarine. The research on
hydrodynamic performance of submarine is quite
new for IHL. We have many experiences to test the
surface-ship model for more than 23 years.
However, to test of the physical submarine model, of
course, needs special treatment and special
technique. Special strut to hold the model and
special measuring equipment have to be prepared to
test the model submerged 2 meter below surface of
water.
During the design process, CFD analysis is
employed to evaluate the hull form design, the
velocity distribution around the hull, the velocity
distribution around propeller disk (the wake), and
the resistance of mini-submarine.
Since the facility of IHL is built especially to
represent the Froude number similarity, then
conducting the submerged model test of submarine
in towing tank, will trigger controversy. Submarine
that move submerged under water will dominantly
undergo skin friction force. This force should be
investigated in laboratory based-on Reynolds
number similarity. The carriage speed of towing
tank cannot fulfil the speed based on Reynolds
number similarity. Consequently, the submarine
model which is towed in towing tank will experience
much lower Reynolds numbers than the full-scale.
Bettle (2009) proposes to employ the CFD to
cover the disadvantage using lower Reynolds
numbers than the full-scale. Defence Research and
Development Canada as reported by Mackay (2003)
also conducts submarine model test to study the
effect of Reynolds numbers on its performance. He
compares the results of static load measurements in
different facilities using the Standard Submarine
Model, by doing the test in various hydrodynamic
laboratories and wind tunnels in Canada and Europe.
The purpose of this study is to identify the
resistance aspects of BPPT mini-submarine. The
aspects deal with the CFD analysis and resistance
test. Moreover, this study also gives many benefits
to IHL to develop the methods in conducting the
hydrodynamic model testing of submarine using
IHL facilities i.e: towing tank, manoeuvring offshore
basin, and cavitation tunnel (MARIN’s, 2003).
134
Erwandi, ., Utina, M., Murwatono, T. and Sadiah, S.
The Study on the Resistance Test Performance of BPPT Mini Submarine.
DOI: 10.5220/0008549701340138
In Proceedings of the 3rd International Conference on Marine Technology (SENTA 2018), pages 134-138
ISBN: 978-989-758-436-7
Copyright
c
2020 by SCITEPRESS – Science and Technology Publications, Lda. All rights reserved
2 MATERIALS AND METHODS
2.1 IHL Towing Tank and Measuring
Device
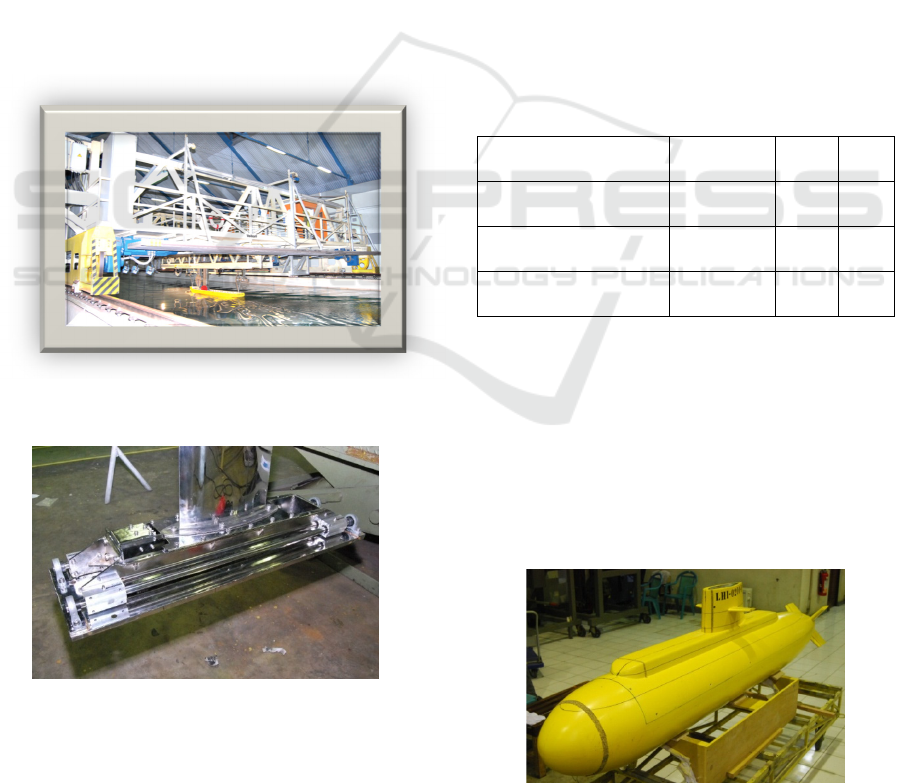
Resistance tests were conducted in IHL towing tank.
It has 250 m length, 11 m width, and 5.5 m depth. It
also provides with towing carriage which speed is in
range 0.2 – 9.0 m/s with ± 0.003 m/s accuracy. The
carriage is moved by four 35 kW electromotors.
Figure 1 shows the IHL towing tank.
A special dynamometer was designed to measure
the resistance of mini-submarine. It can work even
the measuring device is in the submerged condition.
It also provide with special clamp to hold the model
during acceleration and deceleration of the carriage.
When the carriage is in constant speed, the clamp
will be released using pneumatic system and tow
force will be taken over by 25 kg (≈ 250 N) load cell
put in the center of dynamometer.
Figure 1: IHL towing tank and its carriage.
Figure 2: Special dynamometer for measuring resistance
force of submarine model
.
During tow test it measures the X direction force
parallel to the movement of the model only. The
moments that occur in the test will be omitted by
two-linear bearing put parallel to the longitudinal
axis of the towing tank. Figure 2 shows the photo of
the dynamometer.
The carriage speed and resistance force are
recorded through a Data Acquisition and Analysis
System. The system will amplify the analog signals,
reduce the noises, and convert the analog to digital
data which is fed to computer.
2.2 BPPT Mini-Submarine Model
Table 1 presents the principal dimension of BPPT
mini-submarine. The model was provided with sail,
astern controllable appendages to make
manoeuvring in the horizontal and vertical plane,
and sail plane for forward control surfaces. The
astern appendages for aft control surfaces have X-
plane configuration. However since the test is
resistance only, the astern appendages are not
necessary being moved, thus the appendages fixed to
the hull of the model.
Table 1: Principal dimension of BPPT mini-submarine.
Length Over All (LoA) 22.0
met
er
Diameter of pressure
hull
3.0
met
er
Draft 2.6
met
er
Displacement
submerged
surface
111
133
ton
ton
The physical model for hydrodynamic model test
is manufactured in scale 1 : 7. The model was made
by wood reinforced plastic as recommended by
ITTC. In the sail there is a hole where the strut to
hold the model is connected. As also recommended
by ITTC, the turbulent stimulators are pasted close
to the nose, sail, and appendages to make flow as
turbulent as possible. Figure 3 shows the photo of
the model.
Figure 3: Model of the BPPT mini-submarine.
The Study on the Resistance Test Performance of BPPT Mini Submarine
135
2.3 Model Experiment
For submarine, at submerged mode, Froude equation
cannot be used, because of absence of free surface
effect and wave. Also the use of Reynolds equation
is impossible because model speed will be too large
and and impossible to provide.
S
M
(Re)(Re)
(1)
)/(
M
L
S
L
S
V
M
V
(2)
Where: Re is Reynolds number
V is speed (m/s)
L is length (m)
M is abbreviation of model
S is abbreviation of ship (full scale)
Main aid of Reynolds Equation is independent
from turbulent current of model surface. This
turbulent can be provide with several methods such
as making roughness of submarine bow’s. Thus we
can be sure that the current on model is turbulent.
During submerged mode, there are only friction and
viscous pressure resistance there is no wave
resistance.
Thus, the total resistance coefficient CT can be
expressed as follows:
SVPSFST
CCC )()()(
(3)
Where CF is Frictional Resistance Coefficient
CVP is Viscous Pressure Resistance
Coefficient
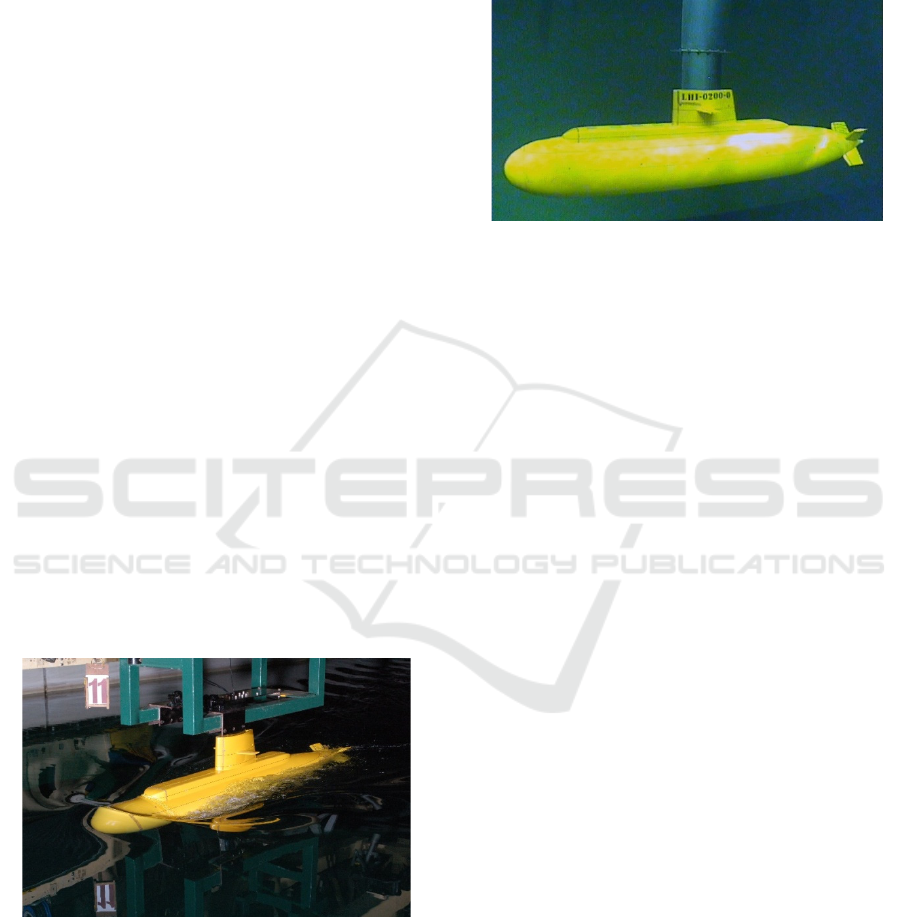
Figure 4: Resistance test at 7 knots surface condition (V =
1.361 m/s).
The model was towed in the surface condition
and submerged condition about 2 meters below
water surface. The speed of the carriage was set to
follow the Froude similarity. In the surface
condition, the speed was set to move in the speed
range 0.4 – 2.528 m/s (2 – 13 knots full scale),
whilst in the submerged condition the speed range
was 0.386 – 2.89 m/s (2 – 15 knots full scale).
Figure 5: Resistance test at submerged condition (V =
3.601 m/s).
In the submerged condition, there are two kind
model condition. Firstly, the model provided
turbulent stimulator (TS) was towed. Secondly, it
was towed without turbulent stimulator.
Figure 4 shows the photo when the model was
towed at 1.361 m/s (7 knots) in the surface
condition. Figure 5 is the photo when the model was
towed at 3.601 m/s (7 knots full scale).
2.4 CFD Preprocessing
As comparison to the tow test results, the CFD
analysis was employed to evaluate the shear and
pressure drag (total resistance) of the BPPT mini-
submarine. The commercial CFD code FLUENT
was utilized and the results of the total resistance
were compared with model test. A box related to the
shape of IHL towing tank was made to represent the
computational domain. The BPPT mini-submarine
was put in the center of the computational domain.
The box plane in front of submarine was defined as
velocity inlet boundary condition, the rear plane was
pressure outlet. The top plane is symmetry boundary
condition. Whilst the bottom, left, and right plane
were wall boundary condition. In the surface
condition simulations, a line was made as a
boundary between water and air.
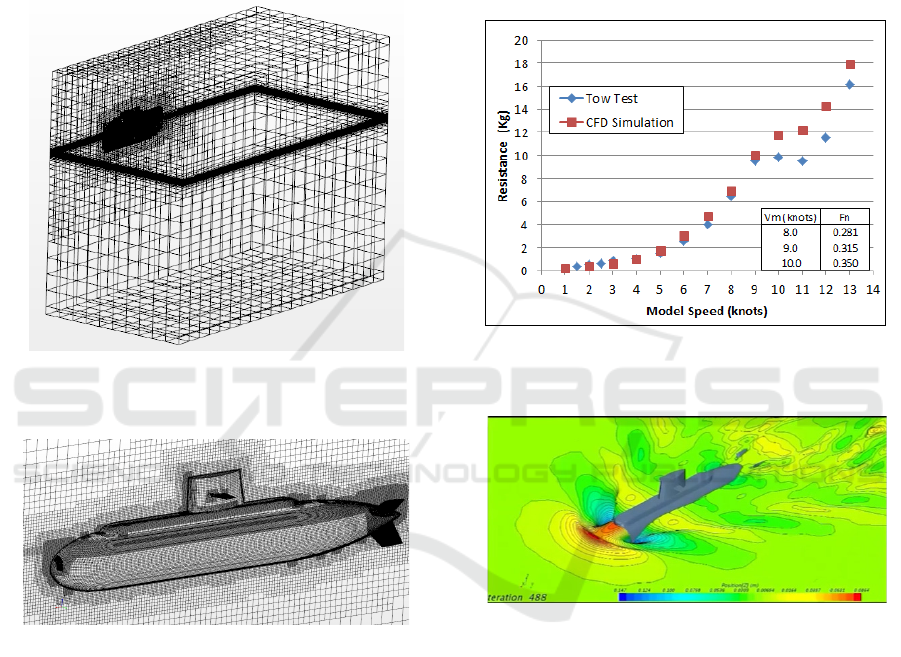
The structured hexahedral volume mesh is
generated around the submarine, as shown in Figure
6 and Figure 7 shows the detail mesh around
submarine model.
The refined mesh was concentrated at hull, astern
appendages, sail, sail plane, and line of water
surface. A very thin prism layer was set at adjacent
to the underlying solid surface. Special treatment
SENTA 2018 - The 3rd International Conference on Marine Technology
136
was conducted for simulation in surface condition.
The volumetric mesh refinement was made at free-
surface, bow, near field of wake, far field of wake,
and stern field.
The simulation involved the solving of Reynolds
Average Navier-Stokes equations (Chng et al, 2007).
The k-ε turbulent model is fed to the solver to
simulate the turbulent flow past around submarine
model.
Figure 6: Computational domain of CFD simulation.
Figure 7: Detail mesh around BPPT mini-submarine body.
3 RESULTS AND DISCUSSION
Comparison results of resistance force between
model test and CFD simulation in the surface
condition is shown in Figure 8. It indicates that there
is a good agreement between the result of resistance
test and CFD evaluation. At surface condition there
is a hump and hollow phenomena when the model is
towed around 8 – 10 knots (Froude Number Fn =
0.281 – 0.350). The CFD results are slightly
overestimate comparing with model test results. We
considered that the dynamometer on those speeds
cannot give accurate measurement because the
moment due to the big bow wave is omitted by
linear bearing. Another measurement (not presented
here) using conventional resistance dynamometer,
special for surface ship, gives a good agreement with
CFD simulation in the Froude Number (Fn) around
0.3 – 0.35.
Figure 9 shows the CFD visualization of wave
pattern at 7 knots carriage speed. It gives a good
correlation of the wave pattern shape with model test
as shown in Figure 4.
Figure 8: Result comparisons between model test and CFD
simulation.
Figure 9: Wave pattern of CFD simulation.
The comparison results of the total resistance
force between CFD simulation, model test using
turbulent stimulator, and model test without
turbulent stimulator (TS) in submerged condition are
shown in Fig. 10. There are significant differences
between the model test using TS and without TS,
especially when the model was towed in high speed.
It seemed the differences are caused by the degree of
the turbulence of the flow. If we convert the graph of
Figure 10 to the non-dimensional resistance
coefficient, and also calculate the frictional
resistance using ITTC 57 formula, then we will have
another interesting point of view.
Figure 11 shows the non-dimensional total
resistance coefficients CT of Fig. 10 following the
The Study on the Resistance Test Performance of BPPT Mini Submarine
137
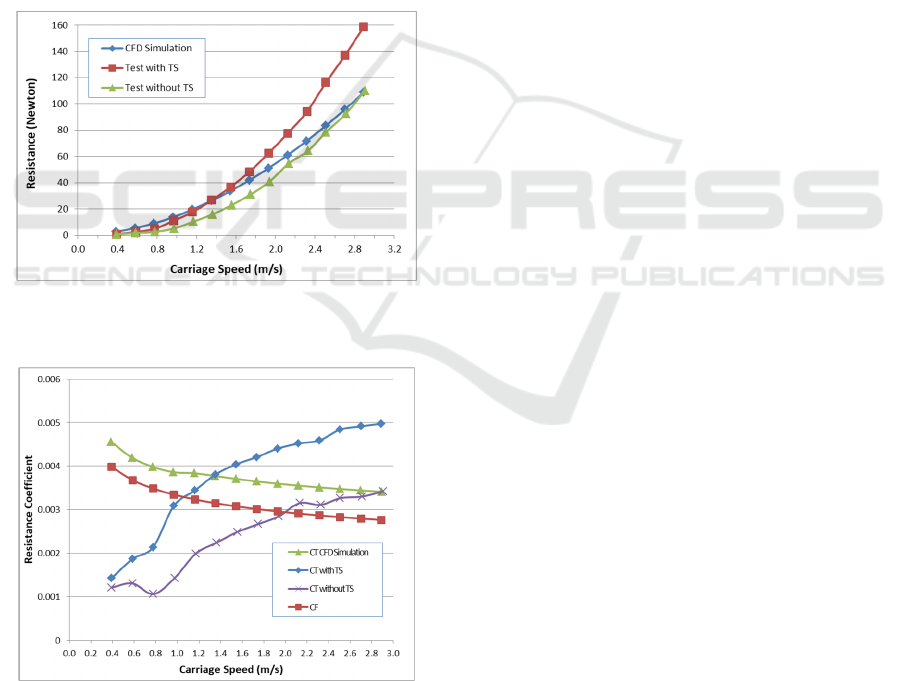
equation (3). We also give the graph of frictional
resistance coefficient CF according to ITTC 57
formula. For CFD simulation there is a fine
correlation between CF and CT. The CT is always
higher than CF. We can say the value between CF
and CT is viscous pressure resistance coefficient
CVP. In CFD simulation CVP increases at high
speed.
Contrary with CFD simulation, at low speed up
to 1 m/s, the total resistance coefficient CT of model
test using TS, is below frictional resistance
coefficient CF. It means that the value of CVP is
negative. It indicates that the flow is laminar. So we
cannot use such kind data for analysis. At speed
more than 1 m/s, the total resistance coefficient
continuously increases when the speed higher and
higher. It seems that the TS gives additional
resistance, comparing to the CFD simulation.
Figure 10: Results of resistance force in submerged
condition.
Figure 11: Resistance coefficient in submerged condition.
The worse situation was also happen when we
conduct the resistance test without TS. It shows that
up to 2 m/s, the flow around the submarine model is
laminar, however more than 2 m/s the total
resistance coefficient has a good agreement with the
CFD simulation.
If we use the CFD simulation as a reference, the
model test in submerged condition needs a fine
tuning of turbulent stimulator. If we put too many
turbulent stimulators, we will obtain higher results
than CFD simulation. If we do not use turbulent
stimulator, it needs higher speed to attain the
turbulent flow.
REFERENCES
Bettle, M.C., Gerber, A.G., Watt, G.D., 2009. Unsteady
Analysis of the Six DOF Motion of Buoyantly Rising
Submarine, Computers and Fluids, 38, pp. 1833-1849.
Chng, Tuan Sim., Widjaja, R., Kitsios, V., 2007. RANS
Turbulence Model Optimisation based on Surrogate
Management Framework, 16th Australasian Fluid
Mechanics Conference, Queensland University,
Brisbane, Australia 3-7 December.
Jones, D.A., Clarke, D.B., Brayshaw, I.B., Barillon, J.L.
Anderson,B., 2007. The Calculation of Hydrodynamic
Coefficients for Underwater Vehicles, DSTO
Platforms Sciences Laboratory.
Joubert, P.N., 2004. Some Aspects of Submarine Design
Part 1. Hydrodynamics, DSTO Platforms Sciences
Laboratory.
Joubert, P.N, 2006. Some Aspects of Submarine Design
Part 2. Shape of a Submarine 2026, DSTO Platforms
Sciences Laboratory.
Mackay, M., 2003. The Standard Submarine Model: a
Survey of Static Hydrodynamic Experiments and Semi
empirical Predictions, Defence R&D, TR 2003-079.
MARIN's news magazine for the Maritime Industy no. 95,
2009. Free Running Model Tests Shed Light on the
Elusive World of the Submarine, Navy Special,
January.
SENTA 2018 - The 3rd International Conference on Marine Technology
138
