
The Sustainability Naval Base Model using System Dynamic Methods
Okol Sri Suharyo
1∗
, Avando Bastari
1
, Harun Bekti Ariyoko1
1
and Indra Agustian
1
1
Indonesian Naval Technology College (Sekolah Tinggi Teknologi Angkatan Laut, STTAL) Bumimoro-Morokrembangan,
Surabaya 60178, Indonesia
Keywords:
Naval base, sustainability, system dynamic model
Abstract:
Naval Base located in the state working area play significant roles as the deployment forces positions as well as
the home-bases having 5 (five) R: Rest, Refresh, Refuel, Repair and Replenishment. Some spot determination
models have been greatly developed but have some weaknesses such as in the term of location sustainability
approach as a system dynamics among the interacted aspects. The change of the system dynamics situation
has caused some Bases undergoing the degradation threat. It means that the Bases do not function as the
fundamental one. This research is aimed to find out a Sustainability Naval Base Model Using System Dynamic
Method from the mutual interacted Technical, Economical and Political aspects. In the technical aspect, it
will be viewed from the variables of the base performance (hydro-oceanography, channel depth, logistics
supply capability of materials and personnel). In the economic aspect, it is observed from the economic
development variables of maritime industries influencing the availability of the base areas, in the political
aspect, it is watched from the susceptibility of the base area. The final result of this research is by finding out
the Sustainability of Naval Base Model using System Dynamic Method.
1 INTRODUCTION
Operations at sea by naval vessels and naval bases
as supporters have strategic value for the existence
of national sovereignty and maritime security in the
territory of Indonesia’s national jurisdiction. Secu-
rity disturbances and sea crime in the form of timber
theft and theft of fish by foreign ships and theft of
other natural resources requires the presence of Patrol
Boats and the existence of Naval Base for safeguard-
ing the entire Indonesian archipelago with an area of
sea reaching 3.9 million km2. The abundance of nat-
ural resources in the sea is a potential entry of viola-
tions and threats (Suharyo et al., 2017).
The Naval Chief of Staff in the Navy’s 2024 Pos-
ture book has launched the development of the Naval
Base to support national defense and security opera-
tions. Naval Base Development has become an ab-
solute and indispensable necessity, given the threats
and crimes from both inside and outside the Republic
of Indonesia such as illegal logging, illegal fishing,
piracy and piracy and violations of the territory of the
Republic of Indonesia by ship- neighboring country
ships are increasingly happening. The Republic of In-
donesia state fleet command has carried out a base to
support daily operations at sea presence.
Naval Base Development requires enormous re-
sources. Therefore we need a calculation and strate-
gic consideration to decide the development of a base
location. The purpose of this analysis and consid-
eration is to avoid the degradation of Naval Base as
a result of changes and system dynamics that de-
velop and change, both due to natural factors and
non-natural factors, such as politics and economics
(Suharyo et al., 2017).
Based on studies conducted on the selection of
naval base locations (Suharyo et al., 2017), it can
be said that there are several important factors in the
Naval Base Development process, which can be in-
fluenced by 3 (three) important pillars namely Poli-
tics, Technical and Economic. From a political stand-
point, it can be seen from the location of the strategic
base position in the region with the level of foreign /
foreign threat and regional vulnerability, in terms of
technical review of the natural and coastal oceano-
graphic conditions at the Naval Base, the ability of
port and dock facilities to support warships while in
terms of the Economy, the cost of developing the base
and the operational costs incurred if a location is cho-
sen as a Naval Military Base.
Each location of the Naval Military Base will have
characteristics and influences from different political,
technical and economic criteria in supporting the ter-
ritorial integrity of the Republic of Indonesia, so it is
176
Suharyo, O., Bastari, A., Ariyoko, H. and Agustian, I.
The Sustainability Naval Base Model using System Dynamic Methods.
DOI: 10.5220/0008545001760184
In Proceedings of the 3rd International Conference on Marine Technology (SENTA 2018), pages 176-184
ISBN: 978-989-758-436-7
Copyright
c
2020 by SCITEPRESS – Science and Technology Publications, Lda. All rights reserved

necessary to conduct a study and optimization analy-
sis to select the location of naval base development by
considering the baseline degradation factors and also
factors sustainability of a naval base.
Naval Base Degradation is a condition in which
the Base no longer functions as a base as a Naval
Base. Naval Base no longer serves as a re-supply
point for warships, no longer serves as a guard for
the stability of the country’s integration and no longer
serves as an antidote to threats from other countries
by sea and coast (Suharyo et al., 2017).
Some of the causes of the degradation of the base
are the uncontrolled growth of the maritime business
which led to the shifting or closing of naval base land
(Gunawan et al., 2018) for example, the Surabaya
Naval Base which was increasingly pressed for by the
maritime business in the Surabaya port. Furthermore,
the construction of the Merah Putih bridge in Am-
bon covered the rate of Navy ships heading to Am-
bon Naval Base. Technical factors such as sedimenta-
tion, sea tides, and other hydro-oceanographic condi-
tions also contributed to the increase in the degrada-
tion value of the Naval Base.
The threat of degradation Naval Base is the ba-
sis for researchers about the concept of Naval Base
Sustainability or Sustainability. Naval Base Sustain-
ability is a condition where the base can function as
a base for a naval base that continues to grow and be
used as a sustainable base. The Naval Base will con-
tinue to function as a reprocessing point for warships,
function as a guard for the stability of the country’s in-
tegration and serve as a deterrent to threats from other
countries by sea and coast (Martinez-moyano et al.,
2008)
Considering the very complex problems faced in
assessing the sustainability of Navy bases, it is neces-
sary to study and trace deeper data to create a repre-
sentative model. This model certainly must be able to
accommodate the entire scope of the problem in the
development of the base, especially the sustainability
of the base, so that this model is expected to be able
to do a valuation approach to the sustainability of the
base.
The choice of the location of the Naval Base is not
only for the current conditions but also must consider
the location Sustainability factors due to changes in
system dynamics, so that the dynamic system model
needs to be developed in this problem. The dynamic
system is a method used to describe, model, and sim-
ulate a dynamic system from time to time constantly
changing (Forrester, 1997)
This study aims to design and build a more com-
plete and comprehensive problem-solving model on
the location of a strategic naval base to be devel-
oped by analyzing the existence and sustainability of
naval base locations based on consideration of various
kinds and complexity of important factors that influ-
ence them. The development of the site selection op-
timization model is emphasized on a sustainable lo-
cation assessment, because optimization is not only
for the current condition or when the model is formed
but also must be considered in the future the system
sustainability from the chosen location.
In this study, the author will develop an analy-
sis technique for assessing the sustainability of Naval
Base locations with the development of the System
Dynamic concept. The concept of this method, in
general, has been widely used by researchers and sci-
entists, but the use for integrated assessment of Naval
Base from aspects that influence it never been done.
The author tries to make the development and mod-
ification of the method into an intact model that is
systematic and appropriate in the assessment of the
location of the sustainability of the Naval Base which
is expected to be a renewal in this study.
2 MATERIAL AND METHODS
2.1 Modelling Approach with System
Dynamic
The system dynamics approach is a combination of
theory, method, and philosophy to analyze the behav-
ior of a dynamic system by building a generic model
from symptom identification to producing a problem
structure for simulation evaluation / policy analysis
in making decisions, both for step evaluation strate-
gic steps that have been taken in generating system
performance, as well as for evaluation / analysis of
alternative steps that need to be taken in achieving the
desired goals going forward (Forrester, 1997). The
decision can take the form of various aspects, includ-
ing ”allocation, location and distribution”, ”regulation
and deregulation”, ”stimulation and response” whose
essence is system sustainability.
According to Sweeney and Sterman (2000). There
are six interacting problem-solving steps that form
loops in the dynamic system methodology, namely :
a. Problem identification and definition
b. System conceptualization
c. Model formulation
d. Model simulation and validation
e. Policy analysis and improvement
f. Policy implementation
The Sustainability Naval Base Model using System Dynamic Methods
177

2.2 The Priciples of System Dynamics
System Dynamics Methodology, basically using
causal relationships in developing a complex system
model, as a basis for recognizing and understanding
the dynamic behavior of the system. In other words,
the use of system dynamics methodology is empha-
sized more on the goals of increasing our understand-
ing of how system behavior arises from its structure
(Chen et al., 2006). Problems that can be precisely
modeled using a dynamic methodology are systems
that have dynamic properties (change with time); the
phenomenal structure contains at least one feedback
structure (Nair and Rodrigues, 2013).
According to Sweeney and Sterman (2000) the
principles for creating dynamic models with the char-
acteristics described above are as follows :
• The desired situation and the actual situation must
be distinguished in the model
• The existence of a stock structure and flow in real
life must be represented in the model
• Conceptually different streams, the model must be
distinguished
• The only information that is truly available to ac-
tors in the system must be used in modeling the
decision
• The structure of decision-making rules in the
model must be appropriate (suitable) with man-
agerial practices (Tsolakis and Srai, 2017).
2.3 The Objectives of System Dynamics
System Dynamic Model is not only made to provide
forecasting or prediction process, but further than that
dynamic system is intended to understand the char-
acteristics and behavior of internal and external pro-
cess mechanisms that occur in a particular system
(Sundarakani et al., 2014). Dynamic systems are
very effective to use on systems that require a good
level of data management. With the flexibility that
is owned, this will help in the process of model for-
mulation, model boundary determination, model val-
idation, policy analysis, and the application of the
model(Youssefi et al., 2011).
According to Forrester (1997), the usefulness of
the Dynamic System model is to simulate policy eval-
uation, both for evaluating strategic steps that have
been taken (ex-post) in generating system perfor-
mance, as well as for future evaluations (ex-ante)
namely alternative steps what needs to be taken in
achieving the goal.
2.4 Model Simulation of System
Dynamics
Simulation is the imitation of the behavior of a symp-
tom or process. The simulation aims to understand
the symptoms or process, analyze and forecast the be-
havior of the symptoms or processes. Simulations are
carried out through several stages including concept
compilation, modeling, simulation, and validation of
simulation results. The simulation stages sequentially
starting in the first phase of the simulation are drafting
concepts(Chang et al., 2008). Symptoms or processes
to be imitated need to be understood, among others,
by determining the elements that play a role in the
phenomenon or process. These elements interact, re-
late to, and depend on and unite in carrying out activ-
ities. From the elements and their relationship, ideas
or concepts can be arranged regarding the symptoms
or processes that will be simulated (Tsolakis and Srai,
2017).
3 RESULT AND DISCUSSION
3.1 Variable Identification
Based on observations and understanding of the Naval
Base Sustainability system, all variables that have an
influence on the system can be identified, which can
be categorized into 3 (three) main aspects of the Sus-
tainability System of Naval Forecasting, namely :
• Technical Aspects
• Economic Aspect
• Political Aspects
Every major aspect of the Navy Base Sustainabil-
ity system has variables or criteria that are intercon-
nected and interact in the system as shown in Figure 1.
Grand Model Diagram Sustainability of Naval Base
on the main aspects of the interaction model of Naval
Base Sustainability System.
In this study, furthermore specifically identified
several variables in the Technical, Economic and Po-
litical Aspects. This variable is the result of identifi-
cation on conceptual understanding of the Navy Base
sustainability system. Each variable in aspect has a
significant role and has a reciprocal relationship with
one another (Suharyo et al., 2017).
Based on in-depth interviews and questionnaires
with the experts, there are several variables that in-
fluence the political, technical and economic aspects.
These significant variables are the result of brain-
storming with the expert. These variables can be
SENTA 2018 - The 3rd International Conference on Marine Technology
178
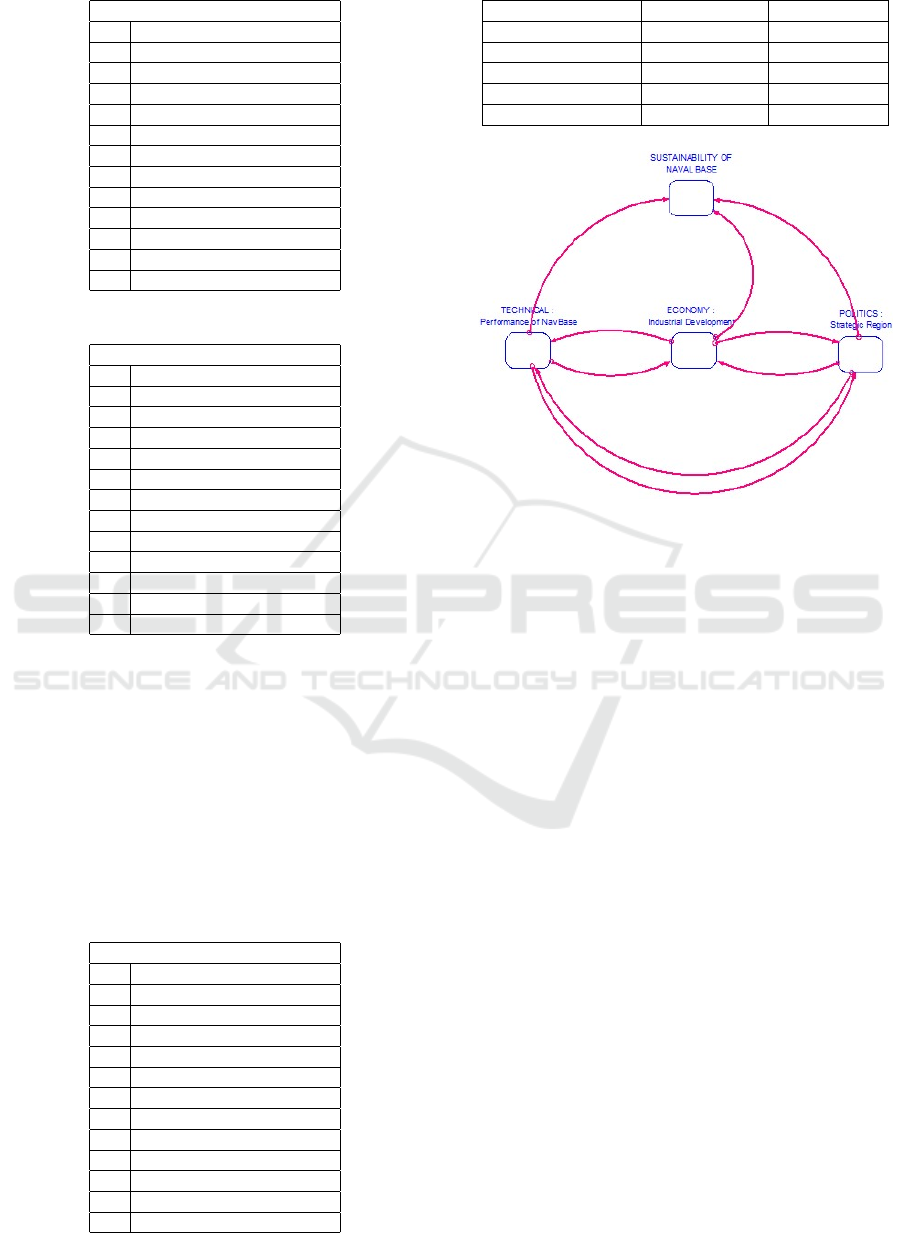
Table 1: Technical Aspects Variable Identification
Technical Aspects Variable :
a. Technical Facility
b. Docking
c. Supply of water
d. Supply of fuel
e. Supply of logistics Personnel
f. Geo-Technical
g. Bathymetry
h. The velocity of sea waves
i. Geology
j. Tidal
k. Sedimentation
l. Hydro-Oceanography
m. Presence of KRI
Table 2: Economic Aspects Variable Identification
Technical Aspects Variable :
a. Technical Facility
b. Docking
c. Supply of water
d. Supply of fuel
e. Supply of logistics Personnel
f. Geo-Technical
g. Bathymetry
h. The velocity of sea waves
i. Geology
j. Tidal
k. Sedimentation
l. Hydro-Oceanography
m. Presence of KRI
shown in Table 1. Technical Aspects Identification,
Table 2. Economic Aspects Identification and Table
3. Political Aspects Identification, according to the
following table:
Each variable in the Technical, Economic and Po-
litical aspects has variables that are interconnected
and form interactions in the Naval Base Sustainability
System.
Table 3: Political Aspects Variable Identification
Technical Aspects Variable :
a. Technical Facility
b. Docking
c. Supply of water
d. Supply of fuel
e. Supply of logistics Personnel
f. Geo-Technical
g. Bathymetry
h. The velocity of sea waves
i. Geology
j. Tidal
k. Sedimentation
l. Hydro-Oceanography
m. Presence of KRI
Table 4: Naval Base Sustainability Index
Idx. of Sustainability Idx. Conversion Strategic Mean
Very Low 1.00 - 2.99 Alert
Low 3.00 - 4.99 Warning
Medium 5.00 - 6.99 Moderate
High 7.00 - 8.99 Sustainable
Very High 9.00 – 10.00 Establish
Figure 1: Grand Model Diagram Sustainability of Naval
Base
3.2 Naval Base Sustainability Index
Each variable in the Naval Base Sustainability Sys-
tem is assessed and scored (ranked) on the system
dynamic model, namely: (1) Very Low, (2) Low, (3)
Medium, (4) High and (5) Very High by using mea-
sured parameters.
The Naval base sustainability index is obtained
from the results of the questionnaire to the Navy ex-
perts and in-depth interviews with the Commander of
the Naval Base unit. The naval base sustainability
index serves to show the sustainability value of the
naval base, based on the conversion index and strate-
gic meaning, namely: Alert, Warning, Moderate, Sus-
tainable and Establish.
Naval Base Sustainability Index can be shown as
follows :
3.3 The Grand Model and Formulation
THE FORMULATION
SUSTAINABILITY OF NAVAL BASE:
SUSTAINABILITY\_OF\_NAVAL\_BASE(t) =
SUSTAINABILITY\_OF\_NAVAL\_BASE(t - dt)
+ (Value\_Change) * dt
INIT SUSTAINABILITY\_OF\_NAVAL\_BASE = 4
INFLOWS:
The Sustainability Naval Base Model using System Dynamic Methods
179
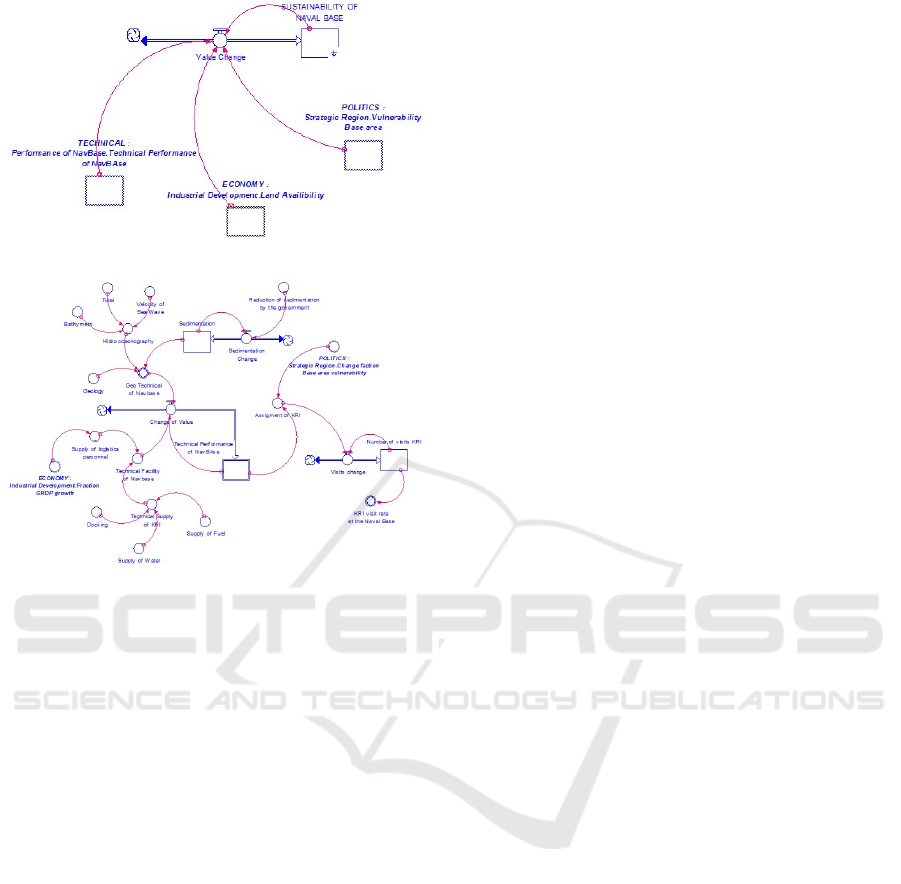
Figure 2: Stock Flow Diagram Sustainability of Naval Base
Figure 3: Stock Flow Diagram - Sub Model of Technical
Aspects
Value\_Change = ((POLITICS\_:\__Strategic
_Region. Vulnerability\_Base\_area+
ECONOMY\_:\_\_\_Industrial\_Development.
Land\_Availability+TECHNICAL\_:\_\_
Performance\_of\_NavBase.
Technical\_Performance\_\_of\_NavBAse)/3)
-SUSTAINABILITY\_OF\_NAVAL\_BASE
3.4 Sub Model of Technical Aspects
Stock and Flow Diagram
THE FORMULATION
TECHNICAL : Performance of NavBase:
Number_of_visits_KRI(t) = Number_of_
visits_KRI(t - dt) + (Visits_change) * dt
INIT Number_of_visits_KRI = 10
INFLOWS:
Visits_change = Round((Number_of_
visits_KRI*Assignment_of_KRI))
Sedimentation(t) = Sedimentation(t - dt)+
(Sedimentation__Change) * dt
INIT Sedimentation = 4
INFLOWS:
Sedimentation__Change =
Sedimentation*Reduction_of_sedimentation
_by_the_government
Technical_Performance__of_NavBAse(t) =
Technical_Performance__of_NavBAse(t - dt)
+(Change_of_Value) * dt
INIT Technical_Performance__of_NavBAse=4
INFLOWS:
Change_of_Value = (Geo_Technical__of_
Navbase+Technical_Facility_of_Navbase)/2
-Technical_Performance__of_NavBAse
Assignment_of_KRI=(Technical_Performance
_of_NavBAse+POLITICS_:_Strategic_Region.
Change_faction_Base_area_vulnerability)/2
Bathymetri = random(4, 5, 1)
Docking = random(6, 7, 1)
Geology = random(5, 6, 1)
Geo_Technical__of_Navbase =(Geology+
Hidro_oceanography+Sedimentation)/3
Hidro_oceanography =
(Bathymetri+Velocity_of_Sea_Wave+Tidal)/3
KRI_visit_rate_at_the_Naval_Base=
IF TIME=0 then 0.12 else
(Number_of_visits_KRI-History
(Number_of_visits_KRI, time-1))/
Number_of_visits_KRI
Reduction_of_sedimentation_
by_the_government = 0.04
Supply_of_Fuel = random(8, 9, 1)
Supply_of_Water = random(8, 9, 1)
Technical_Facility_of_Navbase =
(100*Supply_of_logistics__personnel+
Technical_Supply__of_KRI)/2
Technical_Supply__of_KRI = (Docking+
Supply_of_Water+Supply_of_Fuel)/3
Tidal = random(3, 4, 1)
Velocity_of_Sea_Wave = random(3, 4, 1)
Supply_of_logistics__personnel =
GRAPH(ECONOMY_:___Industrial_Development.
Fraction_GRDP_growth)
(0.00,0.015),(0.1,0.035),(0.2,0.065),
(0.3,0.115),(0.4,0.26),(0.5,0.37),
(0.6,0.645),(0.7,0.765),(0.8,0.89),
(0.9,0.925),(1,0.965)
3.5 Sub Model of Economic Aspects
Stock and Flow Diagram
THE FORMULATION
ECONOMY : Industrial Development:
GRDP_industrial_sector(t) = GRDP_
industrial_sector(t - dt) + (GRDP_
changes_Industry) * dt
INIT GRDP_industrial_sector=520457423.42
SENTA 2018 - The 3rd International Conference on Marine Technology
180
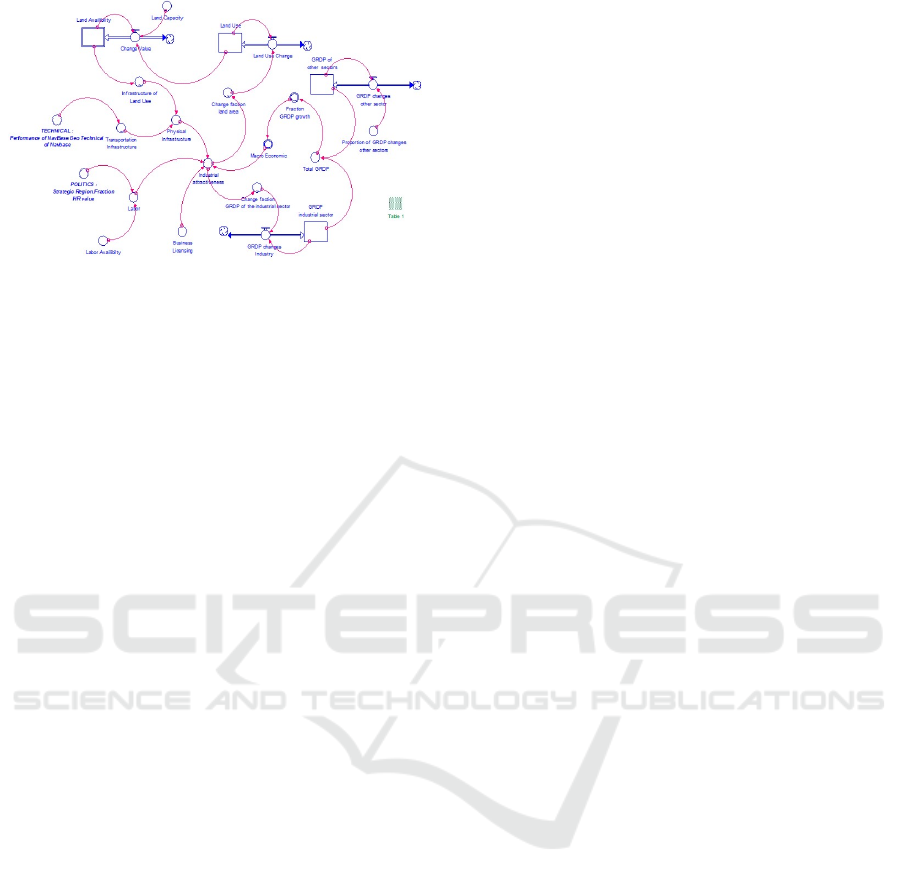
Figure 4: Stock Flow Diagram-Sub Model of Economic As-
pects
INFLOWS:
GRDP_changes_Industry = (GRDP_industrial_
sector*Change_faction_GRDP_of_
the_industrial_sector)
GRDP_of__other__sectors(t) = GRDP_of_
_other__sectors(t - dt) + (GRDP_changes_
other_sector) * dt
INIT GRDP_of_other_sectors=548235203.21
INFLOWS:
GRDP_changes_other_sector =
GRDP_of__other__sectors*Proportion_of_
GRDP_changes_other_sectors
Land_Availability(t)=Land_Availability
(t-dt)+(Change_Value) * dt
INIT Land_Availability = 5
INFLOWS:
Change_Value = (Land_Capacity/Land_Use)-
Land_Availability
Land_Use(t) = Land_Use(t - dt) +
(Land_Use_Change) * dt
INIT Land_Use = 6
INFLOWS:
Land_Use_Change = (Land_Use*Change_
faction_land_area)
Business__Licensing = random(5, 7, 1)
Fraction_GRDP_growth=IF TIME=0 then 0.103
else(Total_GRDP-HISTORY(Total_GRDP,time-
1))/Total_GRDP
Industrial__attractiveness=0.15*Business
__Licensing+0.3*Physical_
_Infrastructure+0.4*Macro_Economic+0.15*
Labor
Labor = 0.6*Labor_Availibilty+0.4*
POLITICS_:__Strategic_Region.Fraction_
HR_value
Labor_Availibilty = random(6,7,1)
Land_Capacity = 19.50
Physical__Infrastructure =
(Infrastructure_of__Land_Use+
Transportation__Infrastructure)/2
Proportion_of_GRDP_changes_other_sectors=
RANDOM(0.14, 0.17,1)
Total_GRDP = GRDP_of__other__sectors+
GRDP_industrial_sector
Change_faction_GRDP_of_the_industrial_
sector=GRAPH(Industrial__attractiveness)
(0.00, 0.015), (0.1, 0.035), (0.2, 0.06),
(0.3, 0.105), (0.4, 0.1), (0.5, 0.135),
(0.6, 0.13), (0.7, 0.15), (0.8, 0.17),
(0.9, 0.195), (1, 0.24)
Change_faction_land_area =
GRAPH(Industrial__attractiveness)
(0.00, 0.00), (0.1, 0.001), (0.2, 0.001),
(0.3, 0.002), (0.4, 0.002), (0.5, 0.003),
(0.6, 0.006), (0.7, 0.007), (0.8, 0.007),
(0.9, 0.008), (1, 0.009)
Infrastructure_of__Land_Use =
GRAPH(Land_Availability)
(0.00, 0.135), (0.1, 0.24), (0.2, 0.335),
(0.3, 0.425), (0.4, 0.525), (0.5, 0.56),
(0.6, 0.6), (0.7, 0.68), (0.8, 0.76),
(0.9, 0.86), (1, 0.93)
Macro_Economic=
GRAPH(Fraction_GRDP_growth)
(0.00,0.015),(0.05,0.0575),(0.1,0.0775),
(0.15, 0.0975),(0.2, 0.11),(0.25, 0.118),
(0.3, 0.145),(0.35, 0.168),(0.4, 0.208),
(0.45, 0.36),(0.5, 0.42)
Transportation__Infrastructure =
GRAPH(TECHNICAL_:_Performance_of_NavBase.
Geo_Technical__of_Navbase)
(0.00, 0.13), (0.1, 0.175), (0.2, 0.225),
(0.3, 0.245), (0.4, 0.28), (0.5, 0.315),
(0.6, 0.36), (0.7, 0.405), (0.8, 0.45),
(0.9, 0.695), (1, 0.855)
3.6 Sub Model of Political Aspects
Stock and Flow Diagram
THE FORMULATION
POLITICS : Strategic Region:
Sea_Crime(t) = Sea_Crime(t - dt) +
Sea_Crime__Changes) * dt
INIT Sea_Crime = 4
INFLOWS:
Sea_Crime__Changes = (Sea_Crime+Illegal_
Fishing+Illegal_Logging+Foreign_vessel_
_violations)*Fraction_crime_in_the_sea
The Sustainability Naval Base Model using System Dynamic Methods
181
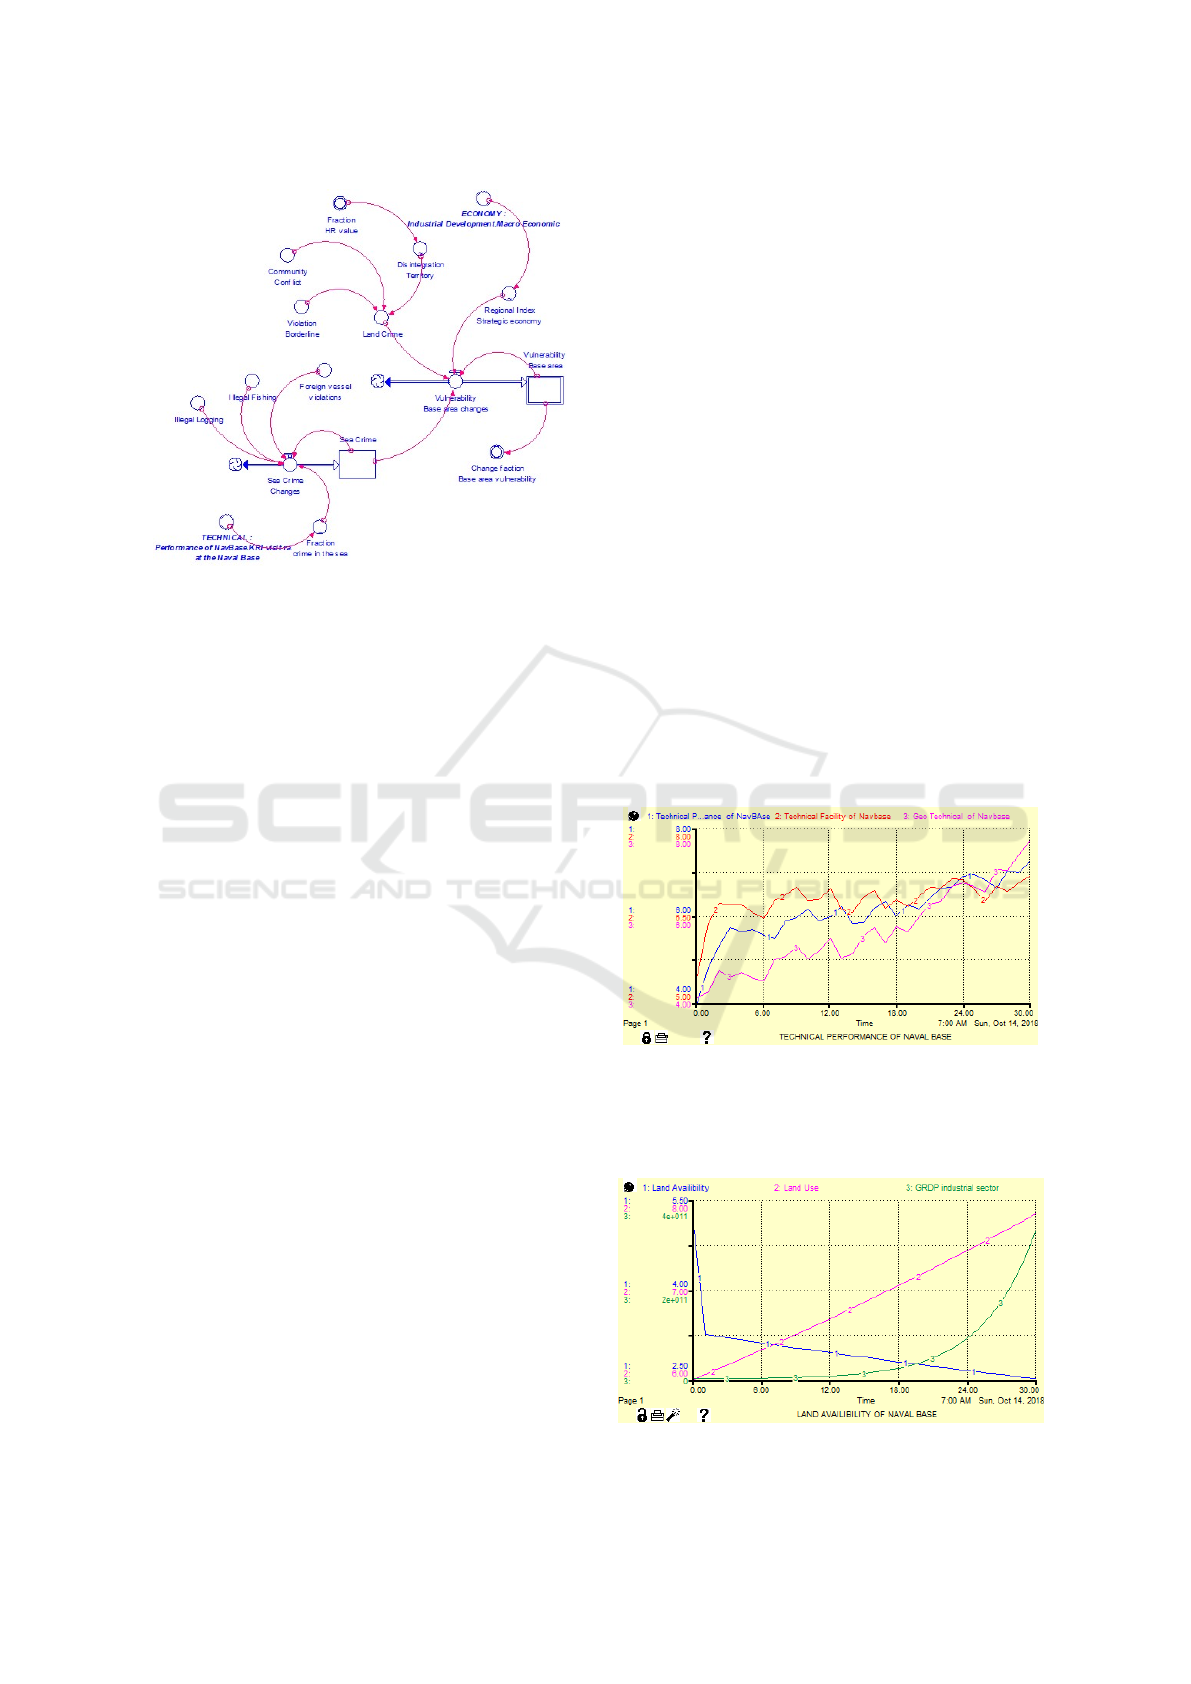
Figure 5: Stock Flow Diagram -Sub Model of Political As-
pects
Vulnerability_Base_area(t) =
Vulnerability_Base_area(t - dt) +
(Vulnerability_Base_area_changes) * dt
INIT Vulnerability_Base_area = 3.5
INFLOWS:
Vulnerability_Base_area_changes =
((Sea_Crime+Land_Crime+Regional_Index
_Strategic_economy)/3)-Vulnerability_
Base_area+1Change_faction_Base_area
_vulnerability = IF TIME=0 then 0.12
else (Vulnerability_Base_area-
History(Vulnerability_Base_area,
time-1))/Vulnerability_Base_area
Community__Conflict = random(4, 5, 1)
Foreign_vessel_violations=random(4,5,1)
Fraction_HR_value = 0.04
Illegal_Fishing = random(4,5,1)
Illegal_Logging = random(5, 6, 1)
Land_Crime = (Disintegration__Territory+
Community_Conflict+Violation_
Borderline)/3
Violation_Borderline = random(7, 8, 1)
Disintegration__Territory =
GRAPH(Fraction_HR_value)
(0.00, 0.97), (0.1, 0.75), (0.2, 0.62),
(0.3, 0.515), (0.4, 0.43), (0.5, 0.355),
(0.6, 0.27), (0.7, 0.21), (0.8, 0.135),
(0.9, 0.115), (1, 0.075)
Fraction_crime_in_the_sea = GRAPH
(TECHNICAL_:__Performance_of_NavBase.
KRI_visit_rate_at_the_Naval_Base)
(0.00, 0.302), (0.1, 0.19), (0.2, 0.133),
(0.3, 0.0875),(0.4, 0.06),(0.5, 0.0425),
(0.6, 0.03), (0.7, 0.0125), (0.8, 0.01),
(0.9, 0.005), (1, 0.0025)
Regional_Index_Strategic_economy =
GRAPH(ECONOMY_:___Industrial_Development.
Macro_Economic)
(0.00, 0.08), (0.1, 0.13), (0.2, 0.185),
(0.3, 0.26), (0.4, 0.37), (0.5, 0.45),
(0.6, 0.495), (0.7, 0.525), (0.8, 0.575),
(0.9, 0.655), (1, 0.995)
3.7 Model Simulation the Assessment of
Naval Base Sustainability
Based on the model development, Sustainability
Naval Base is then measured, which is a measure-
ment of sustainability from every aspect (technical,
economic and political). The results are then aggre-
gated into Naval Base Sustainability as a whole / to-
tality. Based on this dimension Sustainability Naval
Base is the resultant and the overall aggregation of
sustainability of each aspect that has been measured
based on sub-sub aspects of technical, economic and
political. The following picture is the Naval Base Sus-
tainability Value as a result of running from modeling.
Figure 6: Assessment of Technical Aspect Naval Base
Figure 6 shows an assessment of the sub-aspects
of the technical aspects carried out by simulations on
Figure 7: Assessment of Economic Aspect Naval Base
SENTA 2018 - The 3rd International Conference on Marine Technology
182
the sub models that have been compiled. From the
graph, it can be analyzed that the value of base tech-
nical performance is strongly influenced by the con-
dition of technical facilities and geotechnical condi-
tions. The relationship between the variables is the
relationship of the system dynamics over the 30-year
dimension.
Figure 7 shows an assessment of sub-models of
economic aspects carried out by carrying out simu-
lations on the sub-models that have been compiled.
From the graph, it can be analyzed that the value of
base land availability is strongly influenced by land
use conditions and industrial sector conditions, the
higher the value of the two variables, the lower the
value of the availability of base land. The relation-
ship between the variables is the relationship of the
system dynamics over the 30-year dimension.
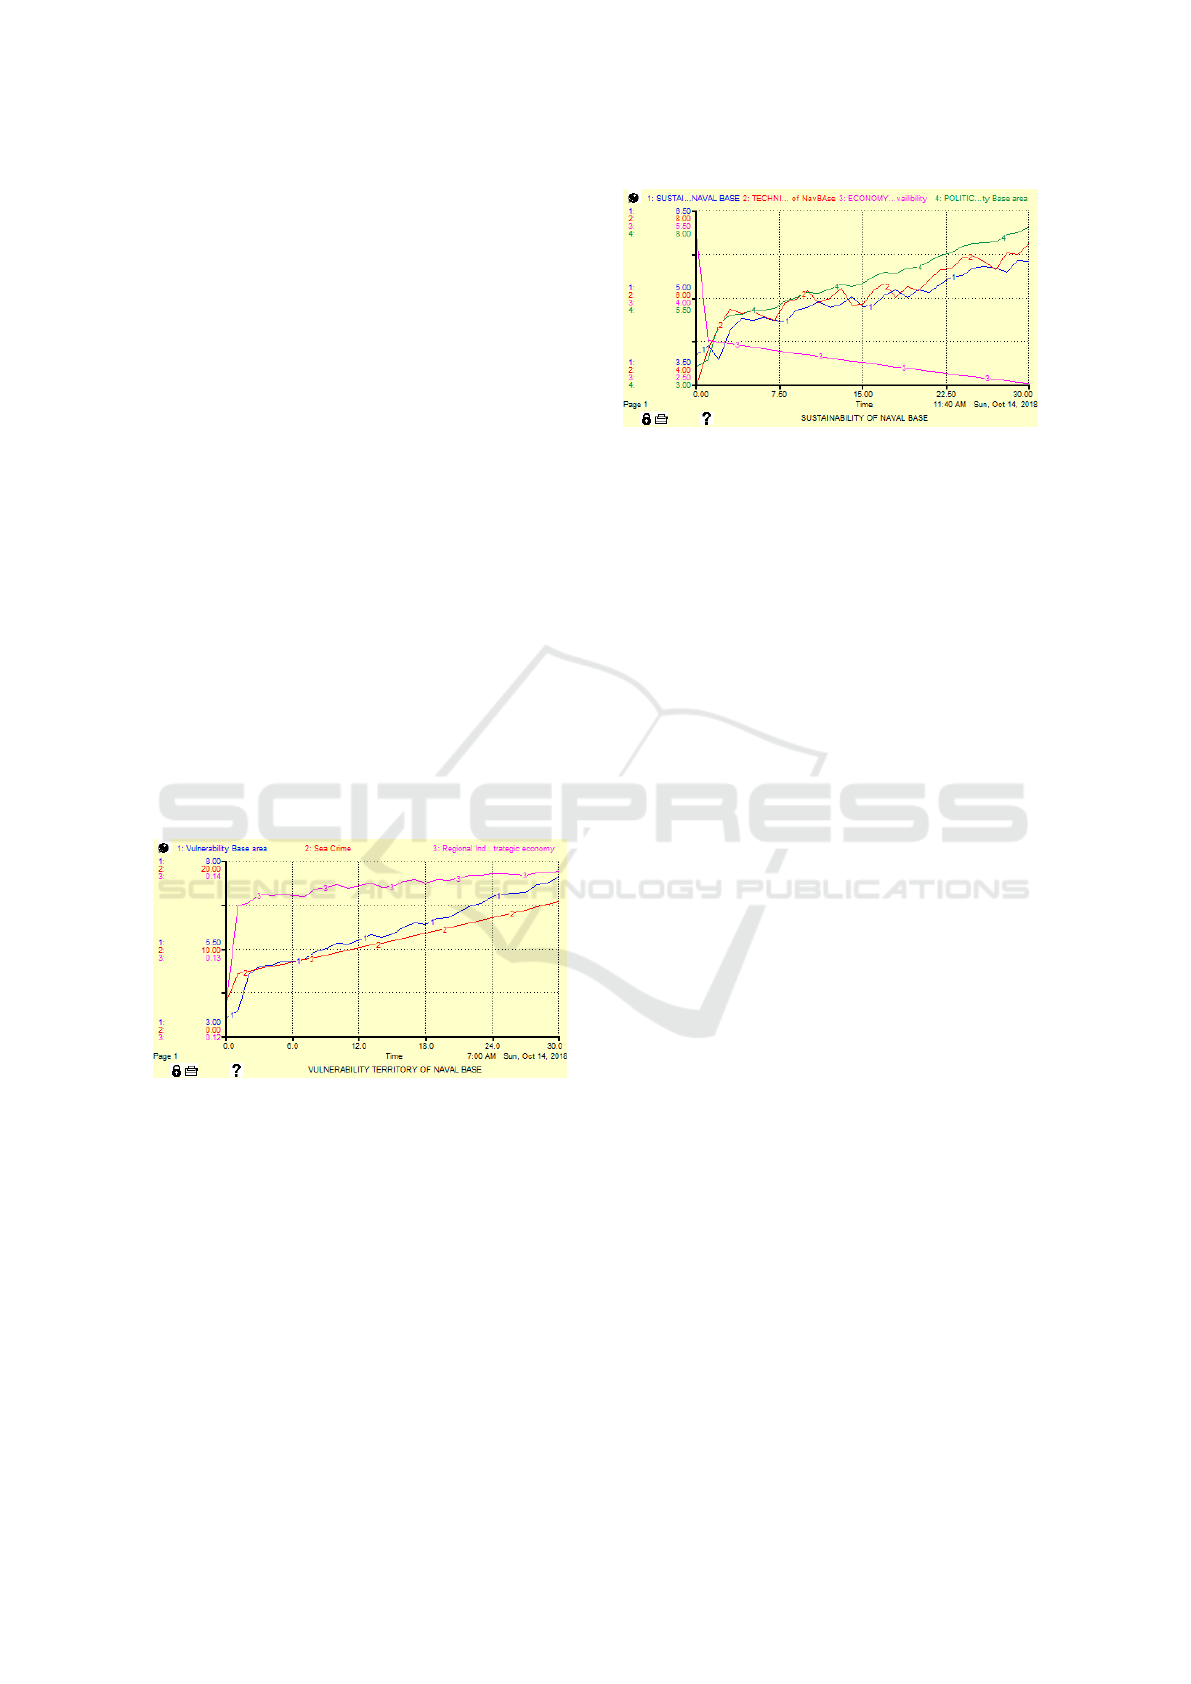
Figure 8 shows the assessment on the sub-model
of political aspects that is carried out by carrying out
simulations on the sub-models that have been com-
piled. From the graph, it can be analyzed that the
strategic value of the base area is strongly influenced
by the vulnerability of the area and the condition of
sea crime, the higher the value of the two variables,
the higher the strategic value of the base area. The re-
lationship between the variables is the relationship of
the system dynamics over the 30-year dimension.
Figure 8: Assessment of Politics Aspect Naval Base
Figure 9 shows an assessment of the Sustainabil-
ity Naval Base Grand model carried out by carrying
out simulations on the main models that have been
compiled. From the graph, it can be analyzed that
the value of Sustainability Naval Base is strongly in-
fluenced by the conditions of the technical, economic
and political aspects that occur at the location of the
naval base. The relationship between the variables is
the relationship of the system dynamics between all
variables over the 30-year dimension.
Based on the analysis of the calculation results
presented in all of the images, the results are obtained
in the form of the value of all base aspects and the
value of the base sustainability which is the value of
Figure 9: A Assessment of Sustainability Naval Base (Total
3 Aspects)
integration between aspects for the 30-year time di-
mension, which includes the following:
a. Technical aspects of Naval Base: 7.24 (Sustain-
able) b. Value of economic aspects of Naval Base:
2.51 (Alert) c. Value of the Naval Base political as-
pect: 6.54 (Moderate) d. Naval Base’s sustainabil-
ity value which is the integration value of all aspects,
Naval Base Sustainability Value: 5.31 (Moderate)
4 CONCLUSION
In this study, a sustainability model for naval bases
was completed. This model serves to make an ap-
proach in measuring the sustainability of a naval base.
The sustainability of a naval base is an absolute mat-
ter that must be considered in the selection of naval
bases because elections are not only for now but are
also used for the future.
In this study, obtained a measurement value of
naval base sustainability that is influenced by 3 (three)
main aspects that interact with each other, namely:
Technical, Economic and Political Aspects. Technical
aspects represent naval base performance conditions
in terms of technical and logistical support to war-
ships. Economic aspects represent the conditions of
maritime industry development that can influence and
shift the availability of naval base land. Furthermore,
the political aspect represents the strategic value of
the base region which is influenced by the number
of crime in the sea and territorial development of the
naval maritime area.
Naval base sustainability is a dynamic condition
of a base that represents the sustainability of the base
in accordance with its functions in supporting the de-
fense and security of the Republic of Indonesia’s na-
tional sea territory.
The Sustainability Naval Base Model using System Dynamic Methods
183

5 FUTURE WORK
The output in this study is limited to the preparation
of the Naval Base Sustainability Model so that this re-
search can be continued and can be further developed
based on the existing models that have been devel-
oped. The development of the next model is a model
that can be used to design policy scenarios, in order
to get an effective anticipation policy for various pos-
sibilities that can occur in the sustainability of naval
bases in the future. The scenario that will be carried
out is based on conditions that allow it to be controlled
by stakeholders/policymakers of the Navy. In addi-
tion, the scenario is also determined based on param-
eters that have a high effect on system performance by
using key variables in the model. This scenario serves
to increase the sustainability value of the naval base.
This will be developed again in the next research.
ACKNOWLEDGEMENTS
The authors greatly acknowledge the support from
Indonesian Naval Technology College STTAL
Surabaya Indonesia for providing the necessary
resources to carry out this research work. The authors
are also grateful to the anonymous reviewers and
editorial board for their many insightful comments,
which have significantly improved this article.
REFERENCES
Chang, Y. C., Hong, F. W., and Lee, M. T. (2008). A system
dynamic based DSS for sustainable coral reef man-
agement in Kenting coastal zone, Taiwan. Ecological
Modelling.
Chen, M.-c., Ho, T.-p., and Jan, C.-g. (2006). A System
Dynamics Model of Sustainable Urban Development
: Assessing Air Purification Policies at Taipei City.
Asian Pacific Planning Review.
Forrester, J. W. (1997). Building a System Dynamics
Model. Building a System Dynamics Model.
Gunawan, K., Nengah Putra, I., Sukandari, B., Suharyo,
O. S., and Susilo, A. K. (2018). Location Determi-
nation of Logistics Warehouse facility using Fuzzy
Multi Criteria Decision Making (FMCDM) Approach
in Western Sea Sector of Indonesia. Technical report.
Martinez-moyano, I. J., Andersen, D. F., and Stewart, T. R.
(2008). A Behavioral Theory of Insider-Threat Risks
: A System Dynamics Approach University at Albany
, State University of New York. ACM Transactions on
Modeling and Computer Simulation.
Nair, G. K. and Rodrigues, L. L. R. (2013). Dynamics of
financial system: A system dynamics approach. Inter-
national Journal of Economics and Financial Issues.
Suharyo, O. S., Manfaat, D., and Armono, H. D. (2017).
Establishing the location of naval base using fuzzy
MCDM and covering technique methods: A case
study. International Journal of Operations and Quan-
titative Management.
Sundarakani, B., Sikdar, A., and Balasubramanian, S.
(2014). System dynamics-based modelling and analy-
sis of greening the construction industry supply chain.
International Journal of Logistics Systems and Man-
agement.
Sweeney, L. B. and Sterman, J. D. (2000). Bathtub dy-
namics: Initial results of a systems thinking inventory.
System Dynamics Review.
Tsolakis, N. and Srai, J. S. (2017). A System Dynamics ap-
proach to food security through smallholder farming
in the UK. Chemical Engineering Transactions.
Youssefi, H., Nahaei, V. S., and Nematian, J. (2011). A New
Method For Modeling System Dynamics By Fuzzy
Logic Modeling Of Research And Development In
The National System Of Innovation. Journal of Math-
ematics and Computer Science.
SENTA 2018 - The 3rd International Conference on Marine Technology
184
