
Analysis of Supply and Demand of Coal Terminal in Sumatera
Christino Boyke Surya Permana
1
, Hasan Iqbal Nur
1
and Syaugi Alif Fadhila
1
1
Department of Marine Transportation Engineering, Institut Teknologi Sepuluh Nopember, Surabaya, Indonesia
Keywords: Coal, Supply, Demand, Port Facilities, Capacity
Abstract: Indonesia is one of the largest coal producing countries in the world, with total production of 461 million
tons in 2017. Based on Ministry of Energy and Mineral Resources there are three regions in Indonesia that
have the largest coal reserves, namely South Kalimantan, West Kalimantan and South Sumatera. The
Sumatera region holds a national coal reserve of 45%, but only 10% of the total reserves that have been
managed. The demand of coal from Sumatera increased 17.40% in average during the past five years with
the majority of use for power plant and exports. As a result of an increase in coal demand, the flow of
cargoes at each coal terminal in Sumatera increasing, in 2017 total coal terminal troughput in Sumatera
reach 28.75 million tons. This research based on secondary and primary data analysis of 5 biggest coal
terminal in Sumatera, namely Panjang Port (Lampung), Bengkulu Port (Bengkulu), Jambi Port (Jambi),
Teluk Bayur Port (West Sumatera), Kertapati Coal terminal (South Sumatera) and Tarahan Coal terminal
(Lampung). Total coal terminal capacity in Sumatera region is 51,46 million ton / year. Based on the
forecasting of coal demand in 2037 will reach 67.75 million tons, the total capacity of coal terminal in
Sumatera will reach the maximum capacity of 80% in 2025 (41.70 million tons) . Coal terminal operator
need to consider the port development (facilities and cargo handling equipment) to increase port capacity.
1 INTRODUCTION
Indonesia is one of the largest coal producing
countries in the world, with mining points scattered
in various regions and a total production of 461
million tons in 2017. Based on Ministry of Energy
and Mineral Resources data there are three regions
in Indonesia that have the largest coal reserves,
namely South Kalimantan, West Kalimantan and
South Sumatera. The Sumatera region holds a
national coal reserve of 45%, but only 10% of the
total reserves that have been managed (Kementerian
ESDM, 2017). Based on data from the Central
Bureau of Statistics, coal production in 2016
amounted to 27.56 million tons with the majority of
use for power plant and exports (Petromindo, 2016).
The distribution of coal from Sumatera is
generally carried out through public ports and
special ports in this paper reefer as coal terminal,
some of the major public ports that serve coal
loading include Panjang Port in Lampung, Bengkulu
Port in Bengkulu, Jambi Port in Jambi and Telur
Bayur Port in West Sumatra. While the other coal
are loading in special ports managed by coal mining
companies include the Kertapati coal terminal in
South Sumatera and Tarahan coal terminal in
Lampung. The capacity of a port generally depends
on the number of berths available to ship traffic and
cargo handling capacity (Bugaric et.al., 2011).
Coal production and demand will affect the port
sector as a provider of coal handling services.
Development planning should pay attention to the
increasing trend of coal as one of the main
commodities. There are some conditions that will
affect coal production, including coal reserves,
mining business permits and mining technology.
This research aim to analyze the supply and
demand side of coal terminals, the relationship
between production in coal mining in each area of
production mines with port operating capacity based
on historical data and forecasting of future
conditions. This research is expected to provide
recommendations for coal terminals operator to
improve the efficiency of the port by developing
facilities and equipment.
2 LITERATURE REVIEW
Various research related to operations and
determination of the capacity of dry bulk terminals
have been carried out, Work of the ports with its
optimal capacity assumes a prompt accommodation
of vessels with minimal waiting time in the port and
with maximal use of berth facilities. Calculation of
230
Permana, C., Nur, H. and Fadhila, S.
Analysis of Supply and Demand of Coal Terminal in Sumatera.
DOI: 10.5220/0008543002300234
In Proceedings of the 3rd International Conference on Marine Technology (SENTA 2018), pages 230-234
ISBN: 978-989-758-436-7
Copyright
c
2020 by SCITEPRESS – Science and Technology Publications, Lda. All rights reserved
port capacity related to capacity of facilities and
equipments. Bert capacity use the equation below
(Velsink, 2012):
Cb = P x N x n x m (1)
Where :
Cb = Berth Capacity (tons / year)
P = Productivity of loading / unloading tools
(tons / hour)
N = Number of Gang
n = Annual Operating Time (hours)
m = BOR (%)
Equipment capacity shows the total amount of
cargo that can be served by equipment:
KT = n x V x t (2)
Where :
KT = Capacity of equipment (tons / year)
n = Number of Tools (units)
V = Tool Productivity (ton / hour)
t = Annual Operating Time (hours / years)
Stockpile capacity shows the total amount of
cargo that can be stock by the area:
TY = (Vb x 0.745) x D/Dt (3)
Where :
TY = Stacking Field Capacity (tons / year)
Vb = The volume of coal that is accommodated
(m³)
0.745 = Coal Type Mass (m³ / ton)
D = Working Days in 1 Year (days)
Dt = Dwelling Time (days)
In other studies about the layout of dry bulk
ports, it is explained that the location will affect the
service of cargo loading and unloading time at the
port, the distance between the berth and stockpile for
example is very influential on the speed of cargo
transfer (Nur et.al., 2013).
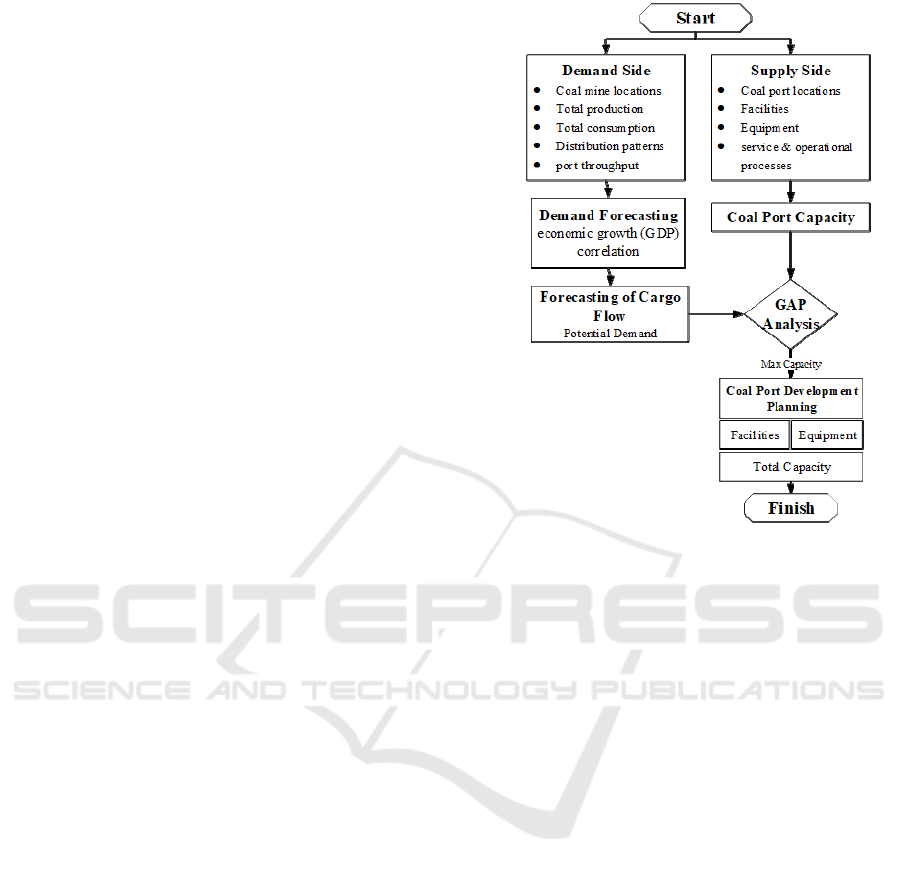
3 METHODOLOGY
In this section, the methodological framework
applied in this research is presented. This research
based on secondary and primary data. Secondary
data is obtained from the Ministry of Energy and
Mineral Resources, the Central Statistics Bureau,
coal terminal operators, and other references. As for
Figure 1: Research flow diagram.
the primary data obtained by surveying the operation
of coal terminal activities and the handling process.
Generally, demand side analysis related to
mining production as well as trends and forecastings
of coal consumption. The supply side analysis is
related to port coal facilities and equipment as well
as coal terminal operations and services. The stages
of this research consist of:
o Demand side analysis: identification of coal
mine locations, total production, total
consumption, distribution patterns and port
throughput;
o Supply side analysis: identification of coal
terminal locations, facilities, equipment and
service operational processes;
o Analysis of demand and supply correlation:
coal demand forecastings based on demand
trends and economic growth. Calculation of
coal terminal capacity, to determine the
maximum limit of coal services and
development plans;
o Analysis of port development plans:
calculation of port development needs,
including facility planning (berth and
stockpile) and coal handling equipment.
Development plan based on capacity
requirements and coal service demand
forecastings.
Analysis of Supply and Demand of Coal Terminal in Sumatera
231
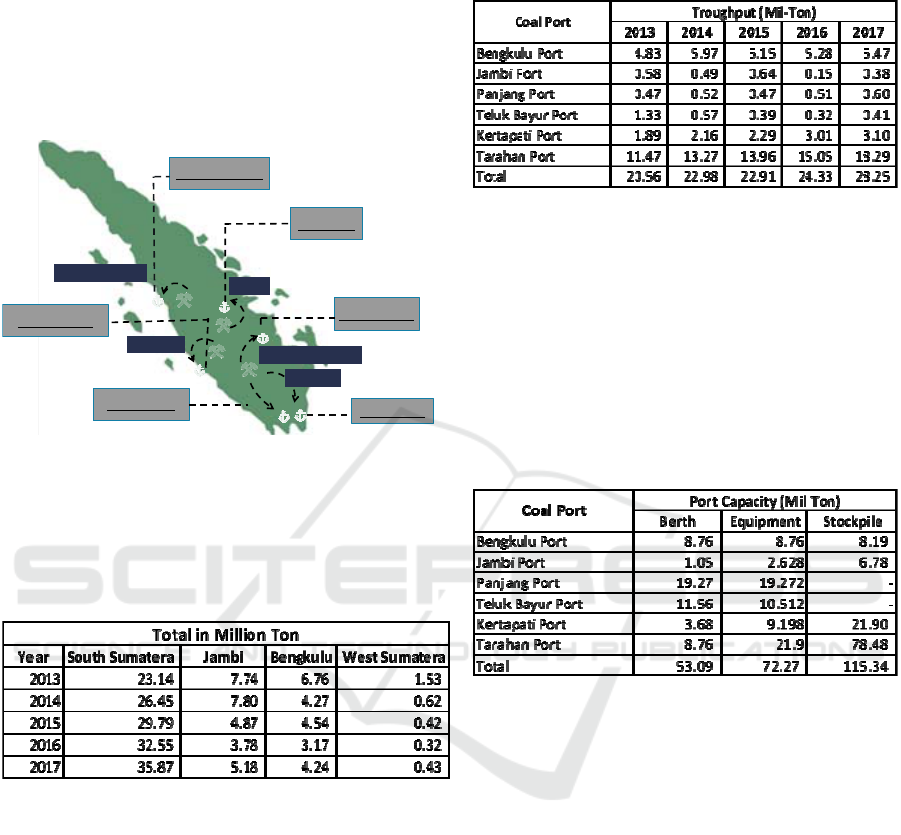
4 ANALYSIS AND DISCUSSION
Analysis in this research includes 6 (six) main coal
terminals of Sumatra: (1) Panjang Port in Lampung,
(2) Bengkulu Port in Bengkulu, (3) Jambi Port in
Jambi, (4) Telur Bayur Port in West Sumatera, (5)
Kertapati Port in South Sumatera and (6) Tarahan
Port in Lampung (Figure 2).
Figure 2: Six main coal terminal of Sumatera.
4.1 Analysis of Demand Side
Data on coal production in the Sumatera during the
last 5 years (2013 - 2017) show on Table 1 below:
Table 1: Coal production of Sumatera.
The total coal production of Sumatera in 2013
was 39.17 million tons, for 2015 is 39.65 million
tons and in 2017 is 45.73 million tons. The average
growth of coal production is 17.40%. Distribution
process coal from the mine to coal terminal using
multimodal mode, such as truck and train,
consumers of coal from Sumatra are majority from
java.
Total coal throughput of Sumatra in 2013 is
20.56 million tons, in the year 2015 is 22.91 million
tons and in 2017 is 28.25 million tons. The average
growth of coal cargo flow is 3.97% (Table 2).
Table 2: Coal terminal troughput.
4.2 Analysis of Supply Side
The supply side analysis is related to port coal
facilities and equipment as well as coal terminal
operations and services. Port capacity calculation
use to determine the total amount of cargo that can
be served and when a development plan is needed.
The calculation of port capacity includes the
calculation of the berth capacity and stockpile.
Table 3: Coal terminal capacity (berth, equipment &
stockpile).
Table 3 above, show coal terminal capacity in
Sumatera, for berth capacity 53.09 Mil Ton/year,
equipment handling capacity 72.27 Mil Ton/year
and for stockpile capacity 115.34 Mil Ton/year.
4.3 Analysis of Demand and Supply
Correlation
Analysis of coal demand is carried out by
forecasting coal troughput of terminal, trend analysis
combine with regression analysis between coal
troughput and the value of Gross Domestic Regional
Products (GDRP) use for the forecasting method.
The equation result from the regression is y =
0.7592x + 388775 and R² = 0.9462 (Figure 3).
JAMBI
BENGKULU
SUMATERABARAT
SUMATERASELATAN
LAMPUNG
TelukBayur Port
JambiPort
BengkuluPort
Kertapati Port
PanjangPort
Tarahan Port
SENTA 2018 - The 3rd International Conference on Marine Technology
232
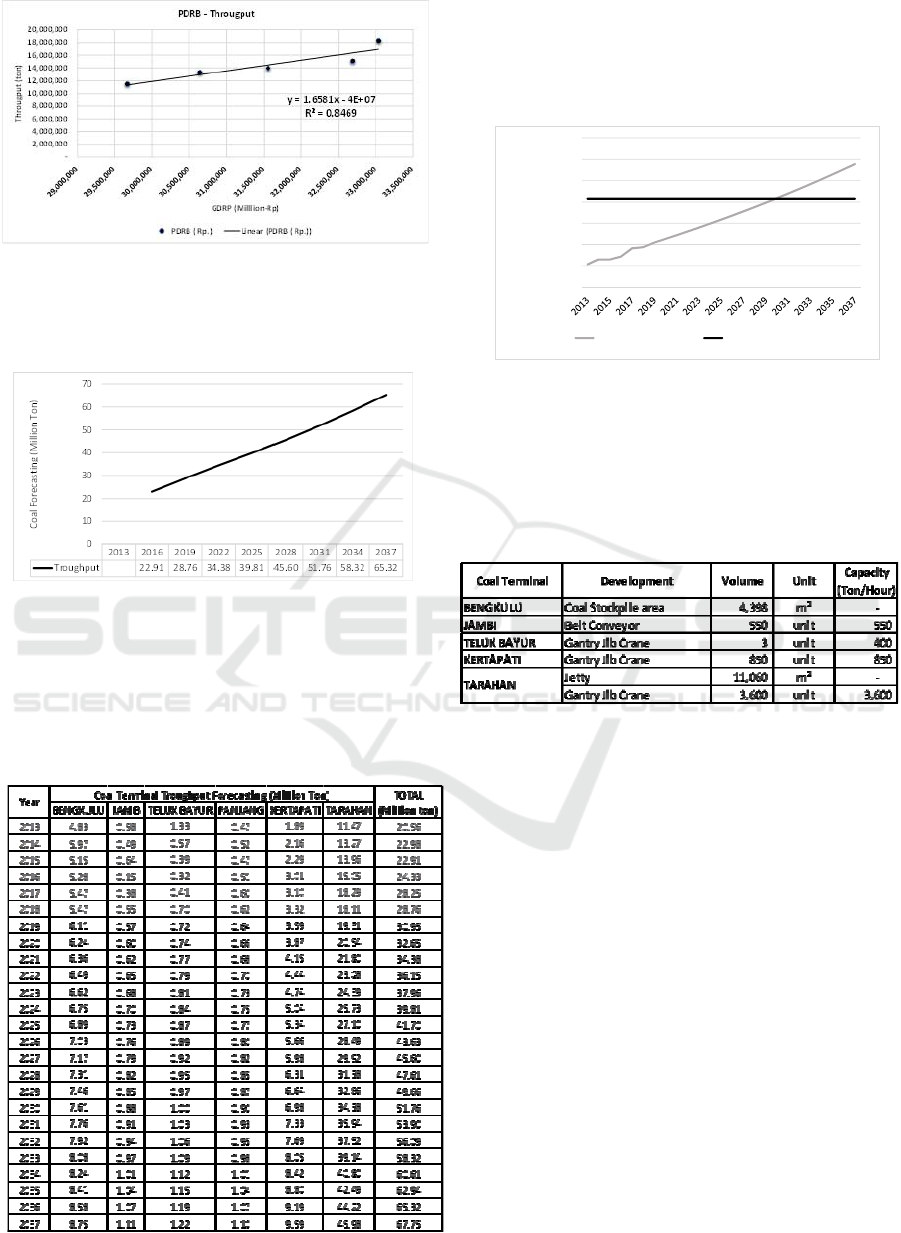
Figure 3: Regression of coal troughput & GDRP.
Based on the forecasting, coal demand from
Sumatera in 2025 will reach 39.81 million tons, in
2037 will reach 65.32 million tons (Figure 4).
Figure 4: Coal demand forecasting (2019 – 2037).
Tarahan coal terminal with the largest coal
handling proportion of 62%, forecasting coal
demand through the terminal in 2037 reaches 45.95
million tons. Detail of coal forecasting of each
terminal can bee seen on Table 4 below:
Table 4: Coal terminal troughput forecasting.
The total capacity of coal terminal in Sumatera
will reach the maximum capacity of 80% in 2025
with the total coal demand of 41.70 million tons.
Figure 5 show the relation of coal terminal capacity
and coal forecasting:
Figure 5: Coal demand forecasting and terminal capacity.
Coal terminal operator need to consider the port
development, including terminal facilities and cargo
handling equipment to increase port capacity. Table
5 below, show coal terminals development need to
meet demand of coal handling.
Table 5: Coal terminal development.
5 CONCLUSIONS
There are 4 (four) regions in Sumatera which have
largest coal production in 2017, there are South
Sumatera (35.87 million tons), Bengkulu (3.02
million tons), Jambi (5.18 million tons) and West
Sumatra (0.43 million tons). Total production in
2017 reach 45.73 million tons. The average growth
of coal production is 17.40% during the past five
years with the majority of use for power plant and
exports. The total existing capacity of coal terminal
in Sumatera is 51.46 million tons, which include
Bengkulu Coal Terminal (8.18 million tons), Jambi
Coal Terminal (1.05 million tons), Panjang Coal
Terminal (19.27 million tons), Teluk Bayur Coal
Terminal (10.51 million tons), Kertapati Coal
Terminal (3.68 million tons) and Tarahan Coal
Terminal (8.76 million tons). Based on the
forecasting of coal demand in 2037 will reach 67.75
million tons, the total capacity of coal terminal in
Sumatera will reach the maximum capacity of 80%
10.00
20.00
30.00
40.00
50.00
60.00
70.00
80.00
CoalTerminalTroughputForecasting
(MillionTon)
TOTAL(Millionton) CoalTerminalCapacity
Analysis of Supply and Demand of Coal Terminal in Sumatera
233

in 2025 (41.70 million tons). Coal terminal operator
need to consider the port development (facilities and
cargo handling equipment) to increase port capacity.
REFERENCES
Kementerian ESDM, 2017. Statistik Mineral dan
Batubara, Kementerian Energi dan Sumber Daya
Mineral. Jakarta
Petromindo, 2016. Indonesia Coal Book, Petromindo.
Jakarta.
Bugaric, U., Dusan, P., Zoran, P., Miroslav, P., and
Gordana, M. P., 2011. Determining the Capacity of
Unloading Bulk Cargo Terminal Using Queuing
Theory, Journal of Mechanical Engineering, pp. 405-
416.
Velsink, H., 2012. Ports and Terminals, VSSD
Netherlands.
Nur, Iqbal, H. H., and Firmanto, 2013. Model Optimisasi
Tata Letak Pelabuhan Curah Kering dengan
Pendekatan Simulasi Diskrit: Studi Kasus Pelabuhan
Khusus PT Petrokimia Gresik, Jurnal Teknik ITS, pp.
E11-E16. Surabaya.
SENTA 2018 - The 3rd International Conference on Marine Technology
234
