
Aerodynamic Performance Analysis of Vertical Axis Wind Turbine
(VAWT) Darrieus Type H-Rotor using Computational Fluid Dynamics
(CFD) Approach
Wisnu Wardhana
1
, and Elyas Nur Fridayana
1
1
Department of Ocean Engineering, Faculty of Marine Technology, Institut Teknologi Sepuluh Nopember (ITS), Surabaya
Keywords:
Aerodynamics, Airfoil, Darrieus, CFD Simulation, Wind Turbine
Abstract:
The recent renewable energy grows significantly concerning on people awareness of the negative effect to-
ward environment. Based on the advantages that should be offer by Vertical Axis Wind Turbine (VAWT)
becomes an interested object to be observed. Especially VAWT Darrieus, H-Rotor type. Not only known has
simple structure but also has higher efficiency than Savonius. Airfoil Profile becomes substantial because its
aerodynamic effects which run on the Darigus turbine. Numerous previous studies observed that the use of
asymmetric airfoil gives advantage toward Darrieus turbine efficiency. In this case, this research focuses on
the influence of cambered airfoil toward the maximum position to the turbine performance. The Investigation
is observed using Computational Fluid Dynamic (CFD) which is two dimensions Darrieus turbine type H-
Rotor turbine model is simulated in transients current condition. In result, the simulation as power coefficient
presented the best turbine performance is conducted by airfoil with the maximum camber position close to the
trailing edge. While the variation on the chord length gives a solidity ratio of 0.6 as the best value between the
above and below.
1 INTRODUCTION
Globalisation now days demanded by hygienic avail-
ability and low-cost resource. Therefore, regarding
human awareness about the negative impact of con-
servative energy resource caused renewable technol-
ogy conversion become vital. In this case, Wind En-
ergy Conversion System (WECS) is the most built
and developed. The furthermost WECS technology is
Horizontal Axis Wind Turbine (HAWT). It has higher
efficiency than the other kind of Vertical Axis Wind
Turbine (VAWT). Even though, it offer another ad-
vantage such as the simplest structure. Moreover,
VAWT able to run at any course of the wind and to
provide another benefit such a minimum noise, stable
in wind turbulence condition, integrate with another
building and give easiness in its generator, gearbox
and bearing application (Ahmadi-Baloutaki, 2015).
There are two differences major in VAWT imple-
mentation, those are: Saviours which is the interac-
tion of the wind turbine utilizing drag force and Dar-
rieus which is using lift force of aerodynamic effect,
the second VAWT is the common one to use as wind
turbine electricity (Manwell et al., 2010). Which is in
this case blade design is important to gain the effect
of aerodynamic due to airfoil design. Airfoil is par-
ticular form of geometry design to gain lift force and
to minimize increasing drag force.
In fluid currency, airfoil lift force is occurred be-
cause the differences of upper and lower surface pres-
sure. It caused by angle of attack and camber (?).
Airfoil symmetry often used in darrieus turbine to
minimize the negative torque during single rotor ro-
tation. The other hand, airfoil with camber increasing
the lift force at the zero attack angle and functioning
at higher maximum torque, but at the second half of
rotation it always occurred negative torque. Accord-
ing to the study by Sengupta et al. (2016), Bausas and
Danao (2015), asymmetrical airfoil is giving the im-
provement to the whole of rotor performance. Qamar
and Janajreh (2017) researched the rotor performance
with NACA 4512 and NACA 7512 asymmetrical air-
foil. The result is airfoil with moderate camber has
better performance.
The purpose of this research is to identify the in-
fluence of maximum camber at 4 digit NACA con-
ventional airfoil. The chosen type of airfoil is NACA
4312, 4512 dan 4712 which is the second digit of vari-
Wardhana, W. and Fridayana, E.
Aerodynamic Performance Analysis of Vertical Axis Wind Turbine (VAWT) Darrieus Type H-Rotor using Computational Fluid Dynamics (CFD) Approach.
DOI: 10.5220/0008542700050011
In Proceedings of the 3rd International Conference on Marine Technology (SENTA 2018), pages 5-11
ISBN: 978-989-758-436-7
Copyright
c
2020 by SCITEPRESS – Science and Technology Publications, Lda. All rights reserved
5

ation delivers the maximum camber’s value toward
chord line airfoil. The best performing airfoil will
be further investigated to see the effects of the vari-
ation of solidity ratio. Computational Fluid Dynamic
(CFD) two dimensions method is used to obtain the
optimal coefficient power value.
2 BASIC THEORY
2.1 Wind Energy
Energy inside of wind stream is a kinetic energy. This
energy is converted to mechanic energy in wind tur-
bine system. Kinetic energy at a certain wind mass
(m) which moving at (u) speed can be identified as
equation below:
E =
1
2
mu
2
(1)
If the turbine cross section area is A, where the
air passes through it at the velocity u, then there is a
displacement of volume V per time unit, therefore:
V = uA (2)
Meanwhile, mass current at ρ air density clarified
in below equation:
m = ρuA (3)
Energy which contained in wind P can be identi-
fied as substitute Equation 3 to Equation 1 as turn out
to be this equation :
m = ρuA (4)
As P is power that contained in the wind, u is wind
speed and air density ρ. The amount of air density on
sea surface is 1.225 kg/m
3
.
2.2 Tip Speed Ratio
Tip Speed Ratio (γ) is comparison between tip blade
speed and wind speed that get through it (Hemami,
2005).
γ =
ωR
u
(5)
Which is ω as the rotation speed of turbine, R is
the length of the turbine radius.
Figure 1: Airfoil NACA 4312, 4512 and 4712
2.3 Power Coefficient
The capability of wind turbine to convert wind energy
to mechanic energy called coefficient power (Cp) that
written as equation below:
Cp =
Pmechanic
Pwind
(6)
Cp =
ωT
1
2
ρAu
3
(7)
P mechanic is mechanic power and P wind is wind
power. Meanwhile T is torque which consist at coef-
ficient equation moment (Cm):
Cm =
T
1
2
ρARu
2
(8)
3 RESEARCH METODOLOGY
3.1 Examine Variable
The purpose of this research is to analyse the char-
acteristic of VAWT 3 blades that use 4 digit NACA
airfoil. First digit showing maximum camber. Sec-
ond digit showing the position of maximum camber
according the leading edge. Last two digits showing
maximum thickness of the airfoil. Those parameters
will be examined is the maximum position of camber
on the airfoil of NACA 4312, 4512 and 4712 as show
in the figures below:
The tree airfoils have the same maximum thick-
ness and the same maximum camber value, each rep-
resented by the first digit and the last two digits in the
four number digit code of NACA airfoil. This aim is
to obtain the lift coefficient (C
l
) which does not have a
significant difference between the examined of three
airfoils. So, the overall rotor performance can be an-
alyzed from the effect of the camber position. The
SENTA 2018 - The 3rd International Conference on Marine Technology
6
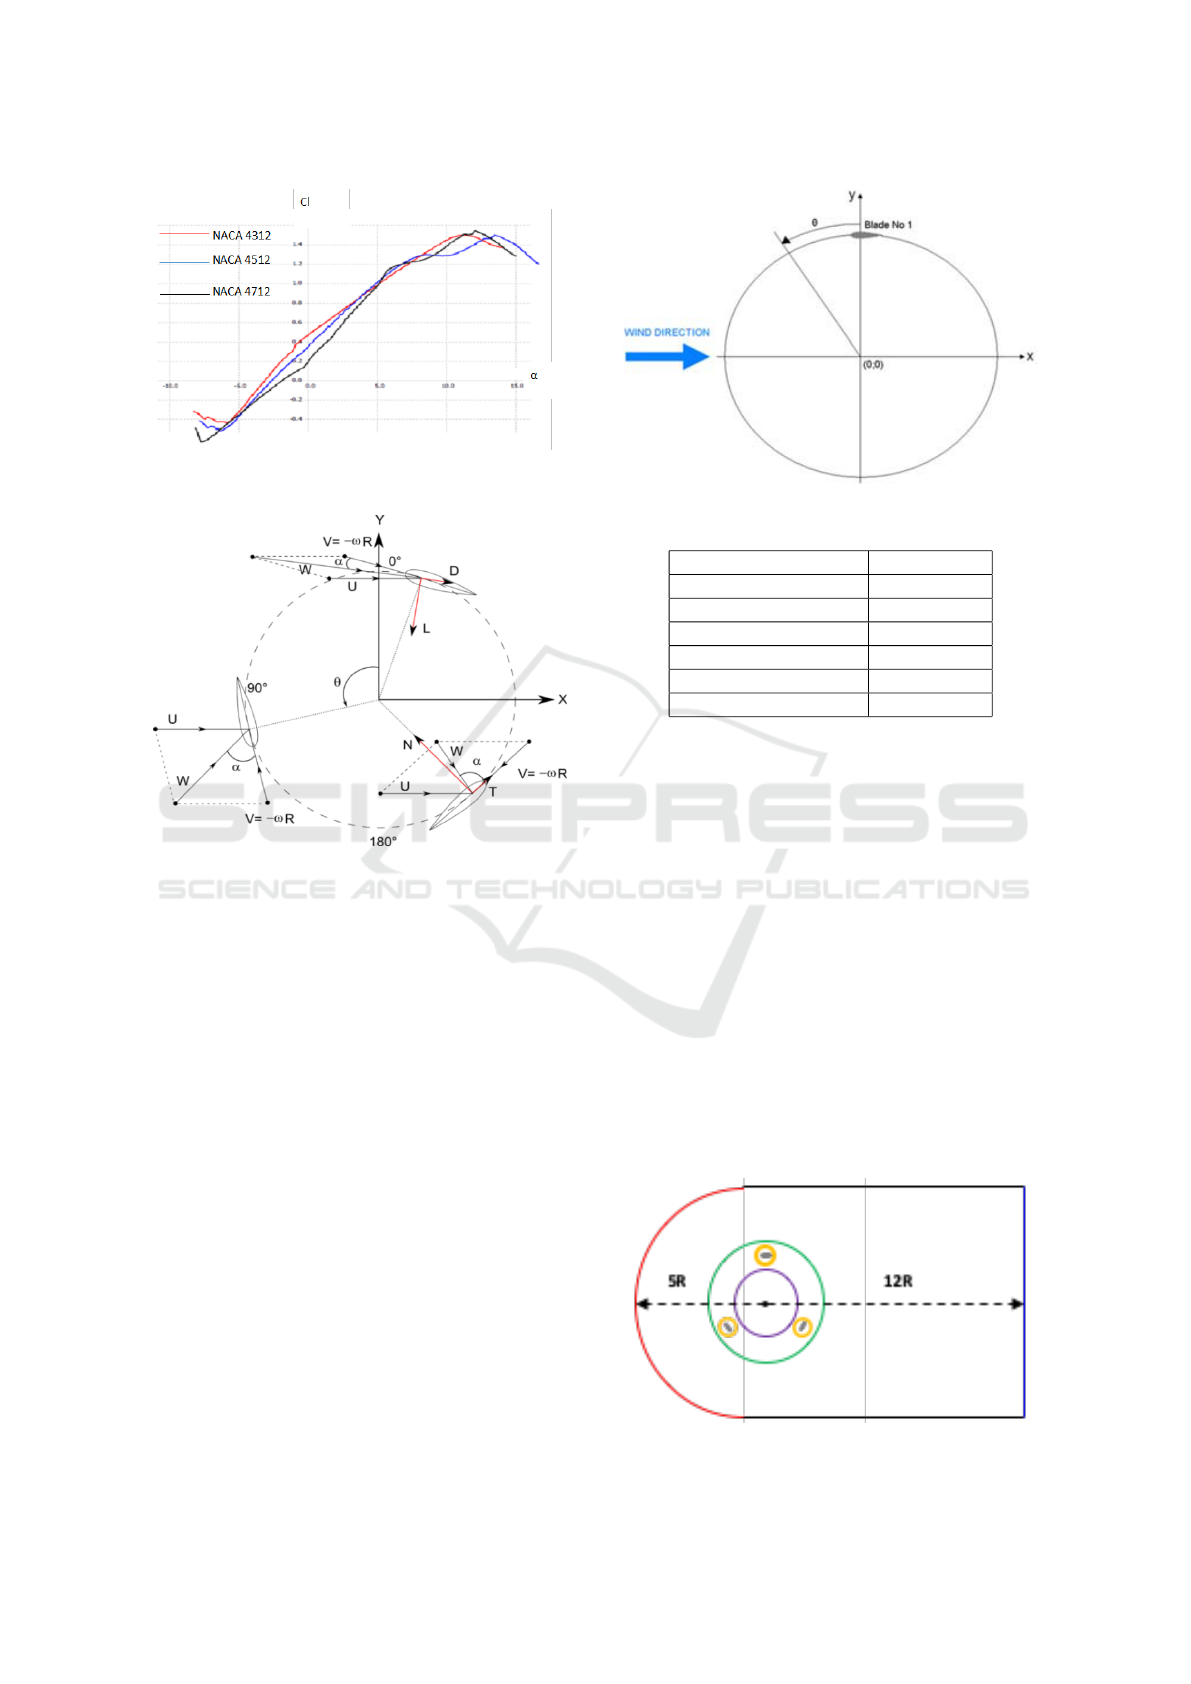
Figure 2: Curve of Cl vs Alpha for Airfoil NACA 4312,
4512, 4712
Figure 3: Aerodynamic force on Darrieus turbine
polar simulation of the three airfoils has been simu-
lated using QBlade software. This software is inte-
grated with the XFOIL, the program used to simulate
the subsonic flow around airfoil and may be able to
predict the performance of airfoil till the last second
before stall (Marten and Wendler, 2013). This simu-
lation comes with the result of C
l
with the variation of
angel of attack (α), as shows in the Figure 2.
3.2 Geomatry Model
The aim of this research is to analyse Darrieus wind
turbine Straight Bladed with the 3 blades. The aero-
dynamics force of this turbine may be seen in the Fig-
ure 3
The geometry created must be represented the
physical problems, therefore it is important to com-
pare the result of the model with the experimental
data. The model which is used as the standard of val-
idation may be seen in the Table 1. Solidity ratio is
σ = Nc/R with the maximum value 0.5 based on the
recommendation of Ahmadi-Baloutaki (2015). The
initial Azimuthal position is accounted from angular
Figure 4: Azimuthal coordinate of blade number 1 [9]
Table 1: Dimension of validation model [9-10].
D
rotor
[mm] 1030
H
rotor
[mm] 1414
n [-] 3
Profil Airfoil NACA 0021
As [m2] 1.45642
Chord lengh (c) [mm] 85.8
σ [-] 0.5
coordinate of the first blade, in the half of chord to be
exact. The motion of positive azimuthal is obtained
since the blades start to move counter clockwise, as
show in the Figure 4 below :
3.3 Numerical Model
C-shape Domain is chosen to modeled the computa-
tional domain. The boundary condition and the size
is defined based on Figure 5 where as the red colour
is inlet, blue is outlet, black is the symmetry, green
is the rotor, the purple is the stationary area or silent
area. The orange is blade area, this motion is based
on the rotor motion and the last is gray which is as the
airfoil.
After creating the geometry, mesh and determina-
Figure 5: Boundary layers set up
Aerodynamic Performance Analysis of Vertical Axis Wind Turbine (VAWT) Darrieus Type H-Rotor using Computational Fluid Dynamics
(CFD) Approach
7
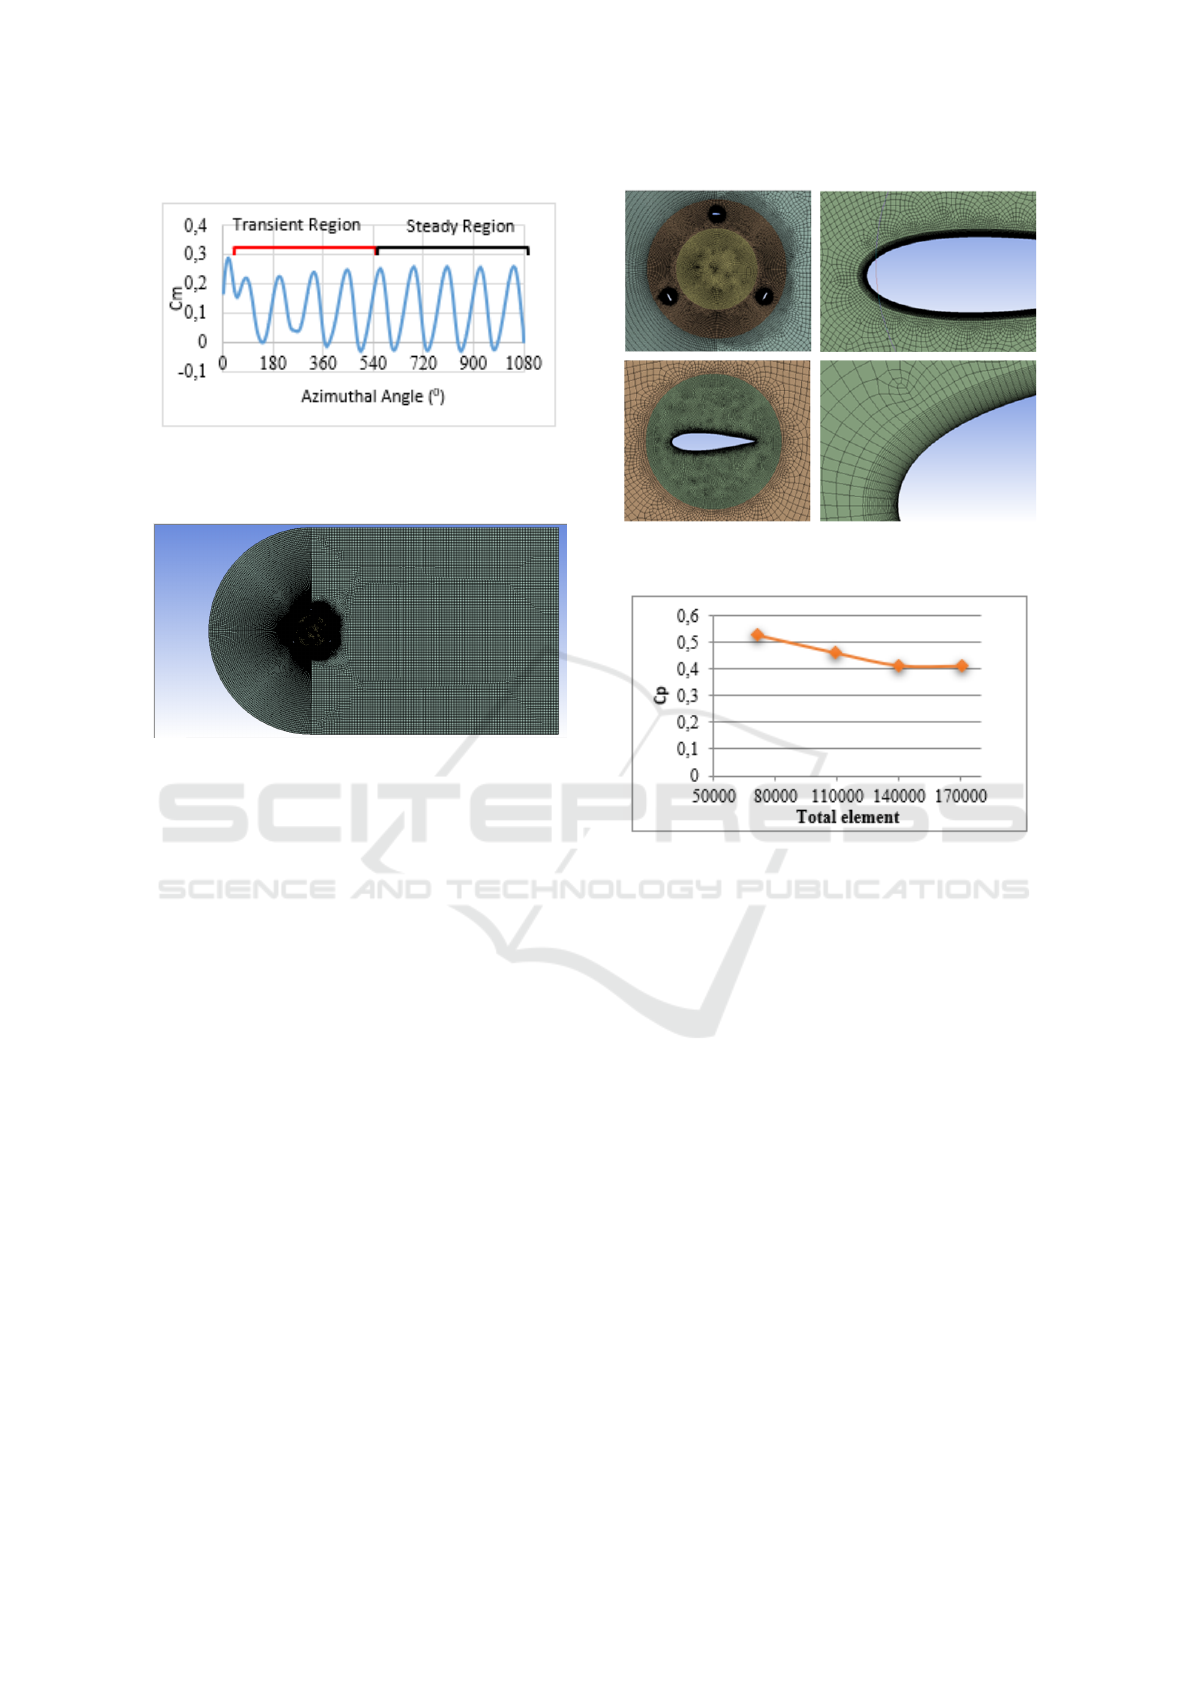
Figure 6: The moment coefficient curve (Cm) as a function
of azimuth angle (θ)
Figure 7: Mesh discretization of whole domain
tion of the boundary condition, the next step is to cre-
ate the certain parameter. To obtain the result of each
tip speed ratio (TSR), the variation of angular is given
with the constant wind velocity at 9 m/s. Computa-
tion is done in each 20 of rotor rotation. The total
rotation of rotor is simulated as 10800 or 3 full cir-
cle. Moment coefficient (Cm) gains from the overall
value of moment in last rotation of 3600. This case
is done to gain the stable result as shown in the Fig-
ure 6. Simulation has been calculated using ANSYS
Fluent software in transient flow conditions. Sliding
mesh technique is used to modeled a rotating turbine.
The realizable K-ε turbulence model has been applied
to the solver setup. Convergency is set with overall
equation 10-4 and maximum of iteration is 80.
3.4 Discretization of Numerical Model
The meshing strategy is created base on existent do-
main, which is the area has direct attraction to the air-
foil must be gained the detail mesh. In this model the
mesh is resulted around 140.000 cell. Samples of 2D
mesh discretization of tested models shown in Figure
7 and Figure 8.
Figure 8: Mesh discretization of rotational domain and air-
foil
Figure 9: The coefecient power (Cp) as a function of total
mesh
4 RESULT AND DISCUSSION
4.1 Study of Mesh Sensitivity
The strategy in making mesh is one of important point
in CFD simulation. Generally the more finer of mesh,
the result will be gained will be better. Somehow the
time consuming of the simulation will be longer. In
this study, the simulation based on validation model
with TSR = 3.3 where the Cp result from the experi-
mental data is compared with simulation result. The
amount of the mesh for the first simulation is 80.000
cell, then it increases by 30.000 cell. The result of
170.000 cell is still in enhancement, but the result of
140000 simulation sel and 170000 only have small
different. The result of mesh sensitivity study is in
the Figure 9.
4.2 Validation
The present CFD simulation is proven to be able to
show the same behaviour compared to experimental
SENTA 2018 - The 3rd International Conference on Marine Technology
8
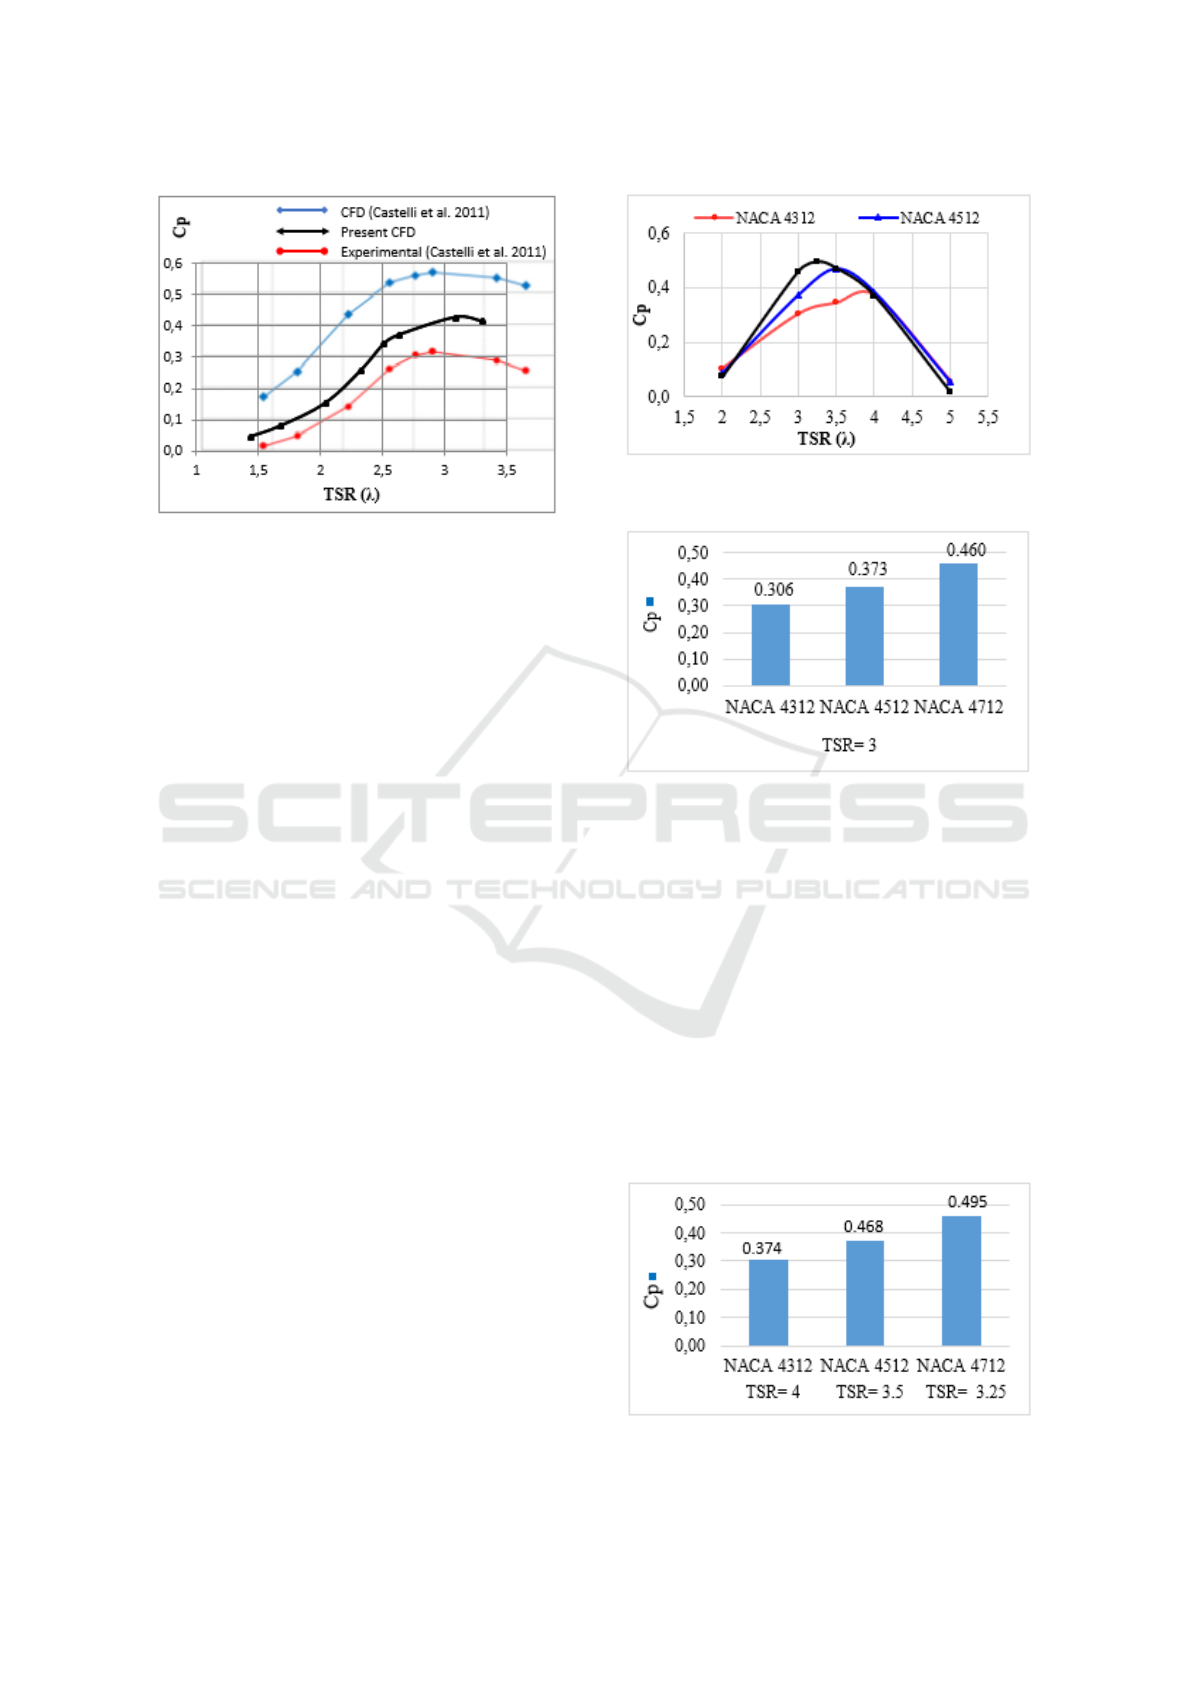
Figure 10: Validation CFD model to be compared with ex-
perimental and the previous CFD data (Raciti Castelli et al.,
2011)
data. Even CFD simulation shows a little higher re-
sult, this is because of 2-Dimension that is used by
the CFD, where the effect of 3D such as vortex inter-
action and tip vortice which influence tip loses cannot
be catch by 2D model (Subramanian et al., 2017).
In 2D the influence of singularity (source or vor-
tex) only around cross each segment. However, in the
3-Dimension modelling which is used singularity dis-
tribution (source or vortex) in panel. Therefore, the
influence is not only happen between the panel but
also it happens in all sides of panel. Trough this ef-
fect it influence the result of modelling (Chan, 1990).
4.3 Effect of Airfoil Variation
The simulation result as coefficient moment counted
as equation 5, 7 and 8 to gain the result of the power
coefficient as the representation of Darrieus rotor per-
formance. For every rotor within differences of airfoil
profile is simulated in each Tip Speed Ratio (TSR).
Here are the chosen TSR: 2; 3; 3.5; 4 and 5. The di-
mension and the size of the rotor are keep using model
validation data as Table 1.
CFD simulation shows various of Darrieus curve
performance at lower TSR. But, on the upper TSR 4
mostly has the same result. Figure 11 shows that the
airfoil profile of NACA 4712 has the higher maximum
result of coefficient power than another profile.
Interstingly, the NACA 4712 airfoil also has the
widest curve, which means the best operating range.
The profile of NACA 4312 has the lower perfor-
mance. Whereas, the NACA 4512 with the maximum
camber position in the middle of the airfoil coinciden-
tally gives a symmetrical Cp-TSR curve. The Maxi-
mum Cp is at TSR 3.5 with an almost equal gradi-
ent rise and drop curve. Those three examined air-
Figure 11: Cp vs TSR Curve at arotor Darrieus with airfoil
variation
Figure 12: Maximum Cp for each airfoil
foils have the same power coefficient values at TSR 4,
whereas the differences are contrasting at Cp values
seen in TSR 3. Based on the results showed clearly
the position of camber gave the significant change to-
ward the whole Darrieus rotor performance.
By shifting the camber’s position toward the trail-
ing edge then the maximum Cp is increased and the
TSR operation ranged becomes wider. Figure 12
showed the maximum value of C p for each airfoil pro-
file, while, each values of Cp airfoil through TSR 3 is
showed in Figure 13.
Further review were held on TSR 3 in it compared
the instantaneous of coefficient moment through az-
Figure 13: Cp for each airfoil on TSR=3
Aerodynamic Performance Analysis of Vertical Axis Wind Turbine (VAWT) Darrieus Type H-Rotor using Computational Fluid Dynamics
(CFD) Approach
9
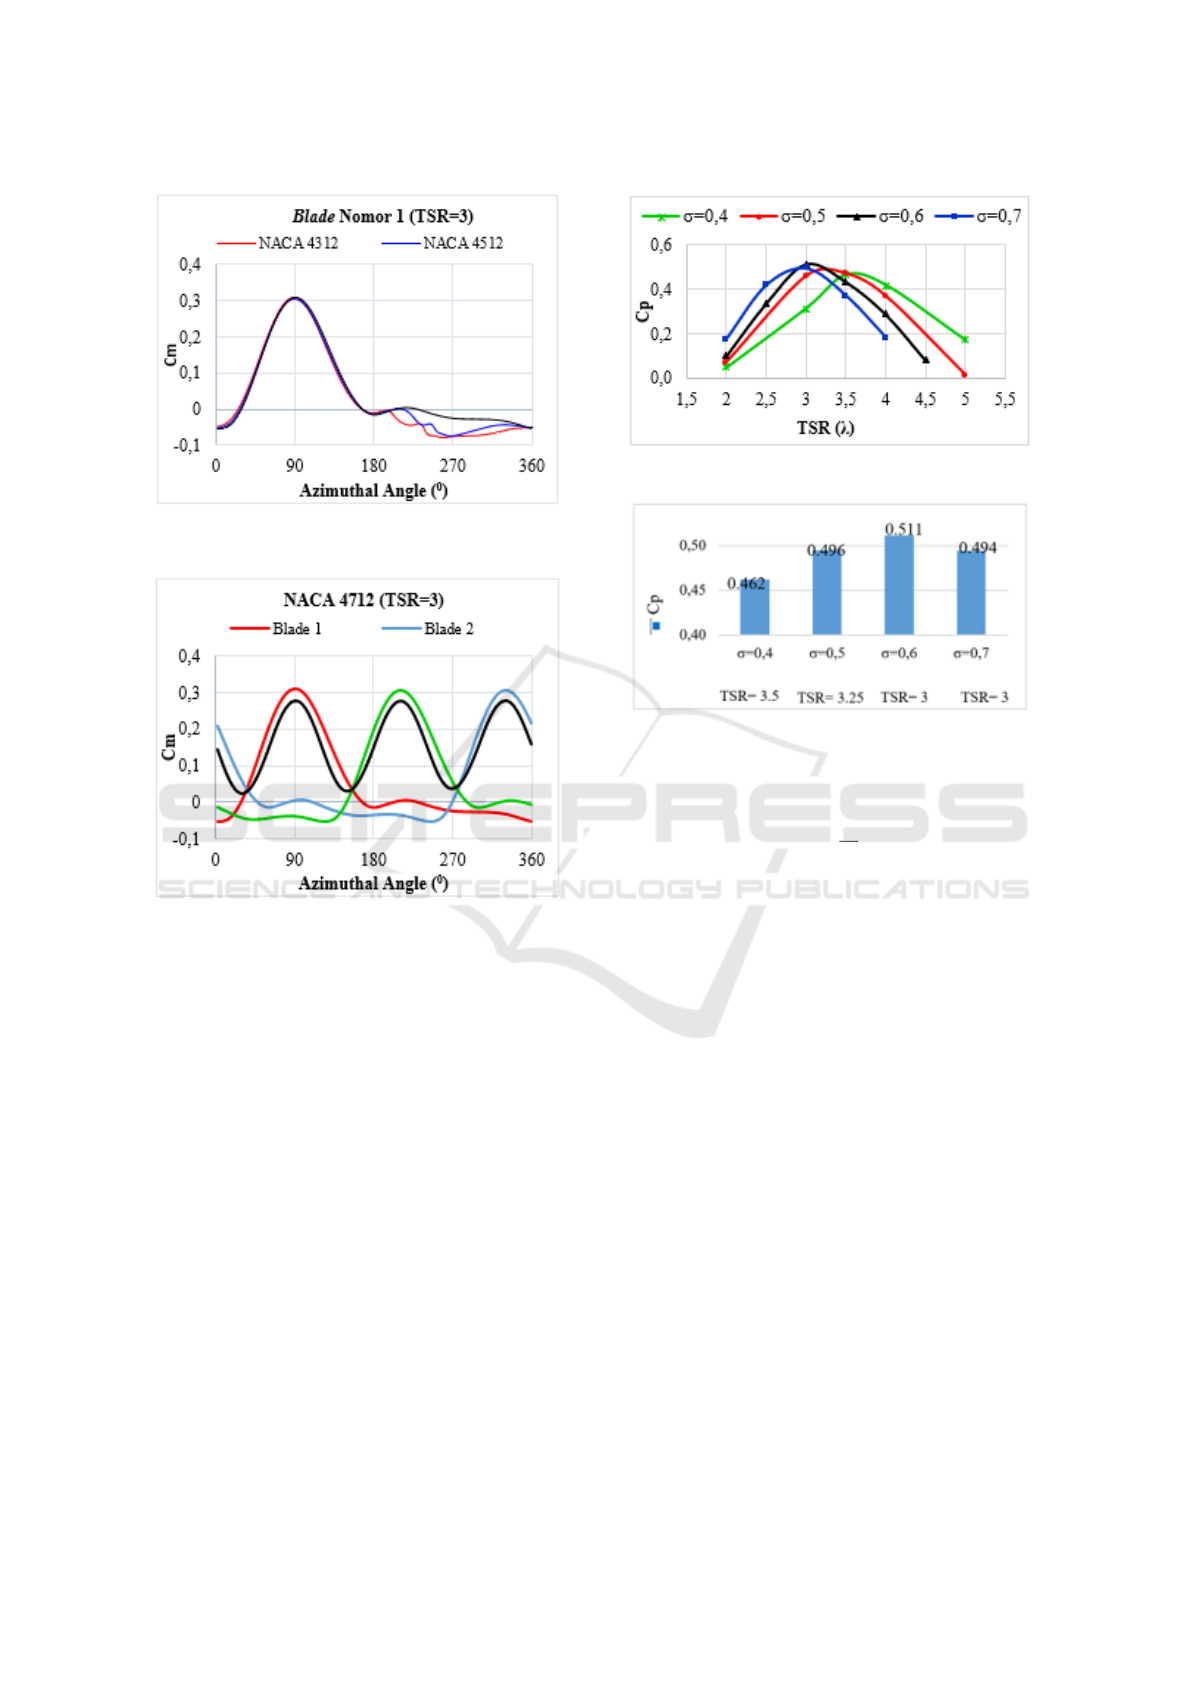
Figure 14: Cm vs Azimuthal angle for NACA 4312, 4512
and 4712 (TSR= 3)
Figure 15: Moment coefficient of NACA 4712 at TSR= 3
on all blade
imuthal angle on blade 1 as showed in Figure 14. The
Cm has almost the same value while the three kinds of
airfoils leading the first half of the rotation. But, while
the second half rotation; the negative variation mo-
ment significantly occurred. Which blade profile of
NACA 4312 produced the highest negative moment.
Whereas, the smallest is NACA 4712. Although the
second half of the azimuthal angle position always
generates a negative torque, however the impact of 3
blades as a whole always generates positive torque as
shown in Figure 15.
4.4 Effect of Solidity Ratio
In the previous section it was found that the NACA
4712 profile has many advantages than another tested
profile. So, those profile is simulated with chord
length variations. Based on this variation, the value
of solidity ratio (σ) also changed. This ratio is deter-
mined by the number of blades (n), chord length (c)
Figure 16: Cp vs TSR for each σ
Figure 17: Maximum Cp with variation σ
and radius length (R) with the following equation:
σ =
nc
R
(9)
The examined solidity ratio is in the range of val-
ues 0.4 to 0.7. The simulation result curve of Cp-TSR
is showed in Figure 16.
The simulation results show that the maximum Cp
value of 0.511 is owned by VAWT for a solidity ratio
of 0.6. Whereas, the Cp-TSR curve with solidity ra-
tio upper and lower of 0.6 has smaller Cp value. The
difference in solidity ratio also has an effect on tur-
bine range operation. Where, a high solidity has C p
value at a low TSR range. While the solidity decreas-
ing the Cp-TSR curve shifted to the right. This case
also worked on the maximum value of the Cp. Which
is the solidity ratio 0.7 has maximum Cp in TSR = 3.
Within, if the solidity ratio is reduced, the Cp maxi-
mum will also move to higher TSR. More details are
presented in Figure 17 below.
4.5 Conclusion and Suggestion
Numerical analysis with 2-Dimensional Computa-
tional Fluid Dynamic (CFD) approach have been used
in this research. The result has been taken is quite
valid to know the characteristics of Vertical Axis
Wind Turbine, Darrieus type, even though the results
are slightly larger than experimental data.
SENTA 2018 - The 3rd International Conference on Marine Technology
10

The simulation results on the airfoil asymmetri-
cal variation gave the significant differences in Dar-
rieus rotor performance. To bring the maximum cam-
ber position to trailing edge then the Cp maximum is
increased. The examined airfoil profile NACA 4712
gave the best result and the highest maximum Cp re-
sult as best result is 0.495 toward TSR 3.25.
The result of Cp-TSR curve shape also has the best
result; because the wide curve means have good oper-
ation of the speed range. The worst rotor showed by
NACA 4312. The investigation on TSR 3 has shown
that the examined variation performance of three air-
foils is spread caused by the difference of negative
value as long as half second of azimuth angle posi-
tion. While the variation of solidity ratio by changing
the chord length found that the maximum value of the
highest Cp obtained in solidity ratio 0.6 is by value
0.51.
The maximum camber position change has been
shown to provide improved aerodynamic perfor-
mance. The changeover of Cp-TSR curve looked con-
sistent and united. The variable of this work is eligible
for the further research combining with other related
variable.
REFERENCES
Ahmadi-Baloutaki, M. (2015). Analysis and improvement
of aerodynamic performance of straight bladed vertical
axis wind turbines.
Bausas, M. D. and Danao, L. A. M. (2015). The aerody-
namics of a camber-bladed vertical axis wind turbine in
unsteady wind. Energy.
Chan, H. S. (1990). A three-dimensional technique for pre-
dicting first-and second-order hydrodynamic forces on a
marine vehicle advancing in waves.
Manwell, J. F., McGowan, J. G., and Rogers, A. L. (2010).
Wind Energy Explained: Theory, Design and Applica-
tion.
Qamar, S. B. and Janajreh, I. (2017). Investigation of Ef-
fect of Cambered Blades on Darrieus VAWTs. In Energy
Procedia.
Raciti Castelli, M., Englaro, A., and Benini, E. (2011). The
Darrieus wind turbine: Proposal for a new performance
prediction model based on CFD. Energy.
Sengupta, A. R., Biswas, A., and Gupta, R. (2016). Stud-
ies of some high solidity symmetrical and unsymmetrical
blade H-Darrieus rotors with respect to starting charac-
teristics, dynamic performances and flow physics in low
wind streams. Renewable Energy.
Subramanian, A., Yogesh, S. A., Sivanandan, H., Giri, A.,
Vasudevan, M., Mugundhan, V., and Velamati, R. K.
(2017). Effect of airfoil and solidity on performance of
small scale vertical axis wind turbine using three dimen-
sional CFD model. Energy.
Aerodynamic Performance Analysis of Vertical Axis Wind Turbine (VAWT) Darrieus Type H-Rotor using Computational Fluid Dynamics
(CFD) Approach
11
