
Statistical Literacy: Students in Presenting Data
Moh. Hafiyusholeh
1
, I Ketut Budayasa
2
, Tatag Yuli Eko Siswono
2
, Cholis Sya’dijah
3
, and Elly
Susanti
4
1
Department of Mathematics, UIN Sunan Ampel Surabaya
2
Department of Mathematics Education, Unesa Surabaya
3
Department of Mathematics Education, UM Malang
4
Department of Mathematics, UIN Maliki Malang
ellysusanti@mat.uin-malang.ac.id
Keywords: Statistical Literacy, Data, Graph, Table.
Abstract: Statistics have become a key component of the mathematics curriculum. At a basic level, by studying
statistics, one can inference, read and present data in a more easily understood form known as statistical
literacy. Everyone is in one of the roles of being a consumer and as a data producer. The core element of
static literacy for consumers is the ability to read and interpret data in tables and graphs published by the
national statistical office. The core element for producers is the ability to create clear, understandable tables,
graphs and reports. The purpose of this research is to describe the student profile in presenting the data.
Therefore, this study is a descriptive explorative qualitative. The subject comes from grade XII students
MIA 9 SMA Negeri 3 Sidoarjo. Data were collected through a combination of interview methods with
written task analysis. The result of the research shows that the subjects had the ability to describe data in the
form of tables or diagrams in accordance with the desired information, including building an alternative
view for a set of data, that is in the form of line diagrams, histograms, and pie diagrams, as well as
frequency distribution table that referred to the purpose of data communication, regardless of the
characteristics of a data. by paying attention to the characteristics of the data.
1 INTRODUCTION
During the past quarter century, statistics have
become a key component of the mathematics
curriculum. Technological advances and methods of
modern data analysis, coupled with the massive data
in the global era, have led development of the
mathematics curriculum to be introduced statistical
concepts into the school curriculum. Even in the
principles and standards of school mathematics
evaluation, National Council of Teachers of
Mathematics (NCTM, 1989) enter data analysis and
probability as one of the five content standards.
Statistical material is important to be included in
the school mathematics curriculum because by
studying statistics, students can do simple
inferences, read a presentation of data and present
data in a form which is easier to be understood.
Statistics are also needed to be able to conduct
research effectively, because statistics are the main
method used to generalize the results of research.
Without using statistics, it is very difficult to make
decisions based on data that has been collected from
a study (Watson, 2006).
One of the important objectives of statistical
education in schools is that students have statistical
literacy. Statistical literacy is the basic ability that
must be possessed by everyone (Franklin, 2007).
Statistical literacy is a new goal for statistical
educators (Schield, 2011; Kasonga & Corbett,
2008). Statistical literacy is needed so that someone
can read and interpret and present data both in tables
and graphs (Schield, 2013), understand meaning,
navigate, and interpret information in the form of
tables, diagrams, or graphs (Murray & Gal, 2002).
Statistical literacy is a new goal for statistical
educators. A core element of statistical literacy for
consumers is the ability to read and interpret data in
the tables and graphs published by national
statistical offices. A core element for producers is
the ability to create tables, graphs and reports that
are unambiguous and comprehensible (Schield,
496
Hafiyusholeh, M., Budayasa, I., Siswono, T., Sya’dijah, C. and Susanti, E.
Statistical Literacy: Students in Presenting Data.
DOI: 10.5220/0008524304960500
In Proceedings of the International Conference on Mathematics and Islam (ICMIs 2018), pages 496-500
ISBN: 978-989-758-407-7
Copyright
c
2020 by SCITEPRESS – Science and Technology Publications, Lda. All rights reserved

2011). Statistical literacy is needed not only for
students but is needed for everyone as both data
producers and consumers (Seifer, 2009).
The problem is that the questions were tested on
the National Examination (UN), in fact only about
calculating the center and variation of data with
single number or data distribution like mean,
median, or mode (UN 2006, UN 2007, UN 2008,
UN 2009, UN 2010, UN 2011, UN 2012, UN 2013,
UN 2014, UN 2014, UN 2015, UN 2016, UN 2017).
These questions emphasize only the commutative
and procedural aspects so that students' statistical
literacy skills, especially in terms of presenting data
were neglected.
Research on statistical literacy relating to the
presentation of data by students is important to do
because by knowing the description of students'
statistical literacy it will be obtained an overview of
the thinking process and the actions of students in
dealing with data which can ultimately be made as a
basis for developing more complete learning model
and curriculum in preparing students to become
statistical literates. That is in line with Carver in
Hafiyusholeh, Budayasa & Siswono (2017). He
states that statistical literacy is important knowledge
needed by all people that must be developed starts at
an early age and is built throughout the school level.
Not many researches have examined in the
aspect of statistical literacy, namely the presentation
of data, one of them is Hafiyusholeh, Budayasa &
Siswono (2017) which described the presentation of
data and interpretation of data with reference to
gender aspects. This study described how students
with high mathematical abilities in presenting data.
2 THEORETICAL
FRAMEWORKS
A person is said to have statistical literacy if the
person is able to read and interpret data in both
tables and graphs (Schield, 2011); to create, evaluate
and communicate messages by involving words,
numbers, and graphs together (Forbes et.al, 2011); to
understand statistical concepts, vocabulary, and
symbols, and including an understanding of
probability, to organize data, to compile and display
data in table form, to work with different data
representations, to make clear and understandable
tables, graphs and reports (Ben-Zvi & Garfield,
2005); to know what basic statistical terms mean, to
understand the use of simple statistical symbols, to
recognize and to interpret different data
representations (Ben-Zvi & Garfield, 2008; Gal,
2002); to understand and interpret data (Schield,
2013); to critically evaluate the use of statistical data
by others or the media (Goodall in Wade &
Goodfellow, 2009); to read and understand statistics
in news, media, and others (Garfield et.al, 2002).
Statistical literacy can also be understood as a
person's ability to read (understand); analyze;
interpret; and represent a data in the form of tables
or graphs (Hafiyusholeh, Budayasa & Siswono,
2017; 2018, Hafiyusholeh, 2015).
Representing (presenting) data is a person's
ability to describe data in the form of certain tables
or diagrams/plots in accordance with the
information to be communicated. Including in this
process is being able to construct data displays for a
given set of data and build alternative views for a set
of data (Mooney, 2002); including consideration of
what is involved in making graphics as a tool for
compiling data.
3 RESEARCH METHOD
This research was a qualitative exploratory research.
The research subjects consisted of two subjects with
high mathematical abilities. Data were collected by
researchers through a combination of interview
methods with written task analysis and student
activity record results during the task completion
process. To obtain the validity of the data obtained,
time triangulation was carried out. The process of
data analysis in this research referred to Miles &
Huberman (1994) which was done by the following
steps: (1) data reduction; (2) data exposure; and (3)
drawing conclusions and verification.
4 RESULTS AND DISCUSSION
To explore and describe students' statistical literacy
in terms of data presentation, several questions were
given with different data types. The first given
question was data regarding the profits from the
store every month for one year. The second given
question was data on the number of students based
on education level. The last question was data on
students' math test scores in one class.
The results of the data presentation of each
question are presented in Figure 1 as follows.
Statistical Literacy: Students in Presenting Data
497
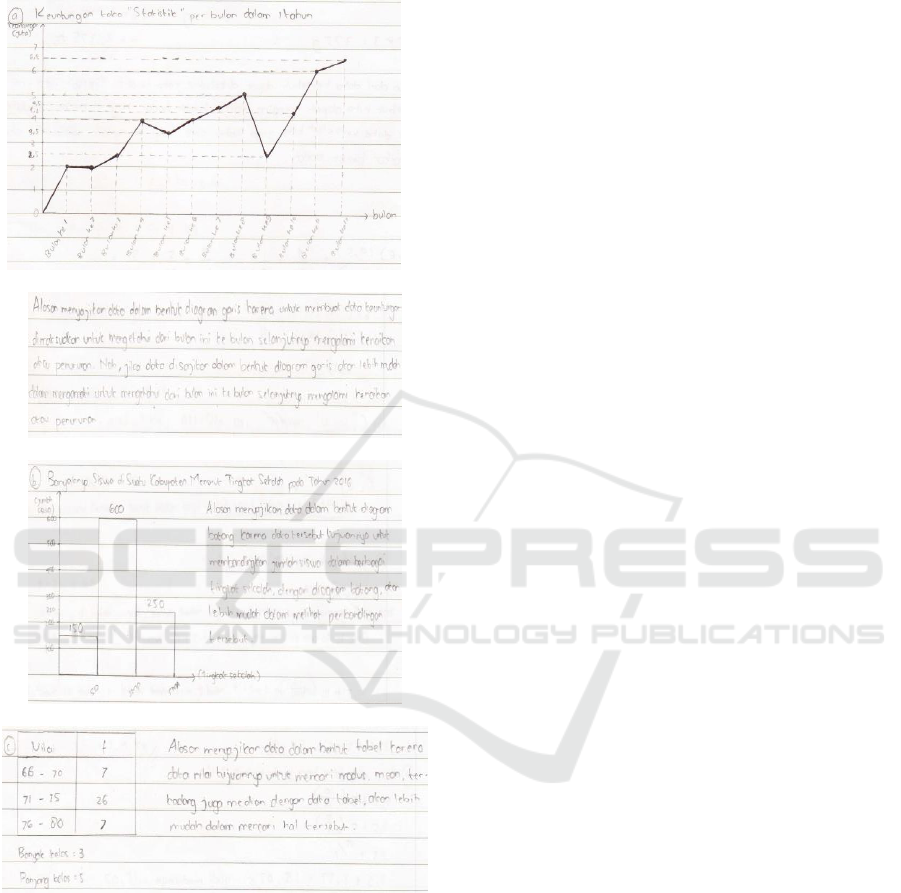
Figure 1. Presentation of data by subject
For each question given, (a) Subjects presented data
in the form of line diagrams with the reason to
facilitate in knowing the increase or decrease in
profits as the following interview excerpt.
P : The data (a) can be presented in what form?
S : Line diagram sir
P : Why is that?
S : Because with a line diagram, people easily
find to know the increase or decrease in
profits from the store for 1 year. In addition,
the data is in the form of decimal or
continuous so that it fits using line diagrams,
not bar charts
For the case (b) the subject presented it in the form
of a bar diagram with the aim of comparing students
to each level in the district, as for the case (c) The
subject presented it in the form of a frequency
distribution table with the reason that it is easy to get
the mean, median and mode. It was shown from
interviews as follow.
P : What is your opinion about data (b)?
S : I think student data in all districts is suitable
to use bar charts
P : Why?
S : Because it can be seen from the goal that is to
compare between the number of elementary,
middle and high school students. And this is
also discrete data. So, it is suitable to use a
bar diagram.
P : What do you mean?
S : For example, if we want to provide
information on the number of elementary
school students, secondary and high school, it
is more suitable to use a bar chart. Because
we want to compare the number of students
P : As for the case (c)?
S : I present it using a group table
P : Why is that?
S : The data is about the score of 40 students
presented irregularly. And my goal is to make
it easier for someone to find average, median
and mode
P : Why don't you use a single data table?
S : That's because the data is too much, so as not
to make a lot of tables
By paying attention to the presentation of the
data performed by the subjects and the results of the
interviews carried out, the results are as follows:
Subjects in planning data presentation for case (a)
are using line diagrams and bar charts. The main
thing to consider is the purpose of presenting data
and the type of data provided. In this case, the
purpose of the subject in presenting data was to
provide information about the increase or decrease
of the profits obtained by the store. Another thing
that was taken into consideration in presenting data
is the characteristics of the data. Because the data
presented was continuous data which is called
ICMIs 2018 - International Conference on Mathematics and Islam
498

decimal data, the subject presented it in the form of a
line diagram. While the bar diagram was not used,
because the data from the store in each month was
incompatible with the characteristics of the bar
chart. The data corresponding to the bar diagram
were discrete data. In addition to those
considerations, the subject also considered the aspect
of effectiveness in making or presenting the data.
In the case (b), the subject presented data in the
form of bar and circle diagrams. The two forms of
presentation were chosen because the purpose of the
subject was to provide information about the number
of students at each level in the district.
In the case of (c) the subject presented data in the
form of a frequency distribution table. This
presentation was chosen because it is more effective
than presenting data with a single data table. The
presentation of the data was chosen because the
purpose of the subject was so that the data reader
was easier to see the maximum and minimum
values, besides that, it is also easy for readers to
determine the average value of math test.
In addition to considering the purpose of
presenting data, subjects with high mathematical
abilities also considered the characteristics of the
data. If the data was presented in discrete form, then
the data presentation used was a bar diagram, circle
and histogram. However, if the data presented was
in a continuous form, then the data presented is a
line diagram. This condition was certainly quite
different from the results of the research of
Hafiyusholeh, Budayasa & Siswono (2018) which
stated that the subject in presenting data was only
influenced by the purpose of presenting data without
considering the characteristics of the data.
By considering to these answers, it could be said
that the subject had the ability to describe data in the
form of a specific table or diagram in accordance
with the desired information, including building an
alternative display for a set of data. Subjects were
also able to construct and make various forms of
data presentation in line with the purpose of the
information to be communicated to the reader. This
is in line with the opinion of Mooney (2002) which
stated that a person could be said to be able to
represent (present) data, if someone was able to
describe data in the form of certain tables or
diagrams/plots in accordance with the information
to be communicated. Including in this process was
being able to construct data displays for a given set
of data and build alternative views for a set of data;
including consideration of what was involved in
making graphics as a tool for compiling data
(National Research Council, 2001).
These competencies also correspond to the
competency standards set in the national curriculum.
In the passing standard as stated in Permendikbud
2016 No. 021 which relates to statistical material
and opportunities mentioned that in Class X-XII
Senior High School, the competencies that must be
mastered in relation to statistical materials and
opportunities are comparing and assessing the
effectiveness of various data presentation methods.
In this case, if referring to basic competencies, then
the basic competencies that should be mastered by
students are able to present data in the form of
tables, charts, lines, circles and ogives and their
interpretations
5 CONCLUSIONS
The results showed that subjects with high
mathematical abilities in identifying data
presentation forms considered two aspects, namely
the aspect of the objectives presented by the data and
the second was the characteristics of the data.
ACKNOWLEDGEMENTS
Honorable to chairman of the department of
mathematics and Rektor UIN Sunan Ampel who
gave researchers the opportunity to continue
research.
REFERENCES
National Council of Teachers of Mathematics (NCTM),
1989. Curriculum and evaluation standards for school
mathematics. Reston, VA: Author.
Watson, J. M., 2006. Statistical literacy at school: Growth
and goals. Mahwah, New Jersey: Lawrence Erlbaum
Associates.
Schield, M., 2011. Statistical literacy: A new mission for
data producers, Statistical Journal of the IAOS 27.
173-183.
Kasonga, R. A. & Corbett, A. D., 2008. An assessment
model for improving student learning of statistics.
SAJHE, 22 (3) 602-604.
Schield, M., 2013. Statistical Literacy: Thinking
Critically about Statistics, Journal “Of Significance”
Produced by the Association of Public Data Users.
http://web.augsburg.edu/~schield/MiloPapers/984Stati
sticalLiteracy6.pdf Accessed Jum’at, 25 October 2013.
Murray & Gal, 2002. Preparing for Diversity in Statistics
Literacy: Institutional and Educational Implications.
ICOTS6.
Statistical Literacy: Students in Presenting Data
499

Seifer, R. 2009. Statistical literacy an essential
competency for both producers and consumers of data.
Vol. 25, No. 7 •ISSN 1058-1073 Published online in
Wiley InterScience (www.interscience.wiley.com)
•DOI: 10.1002/cbl.20095
Hafiyusholeh, Budayasa & Siswono, 2017. Literasi
Statistik: Siswa SMA dalam Membaca, Menafsirkan,
dan Menyimpulkan Data. Prosiding SI MaNIs
(Seminar Nasional Integrasi Matematika dan Nilai-
Nilai Islami). (1). 79-85.
Hafiyusholeh, Budayasa & Siswono, 2018. Statistical
Literacy: High School Students in Reading,
Interpreting and Presenting Data. Journal of Physics:
Conference Series (1). 012036.
Forbes, S., Camden, M., Pihama, N., Bucknall, P., and
Pfannkuch, M., 2011. Official Statistics and statistical
literacy: They need each other. Statistical Journal of
the IAOS 27. 113–128.
Ben-Zvi D. & Garfield J., 2005. The challenge of
developing statistical literacy, reasoning, and
thinking. Netherland: Kluwer Academic Publisher.
Garfield, J., & Ben-Zvi, D., 2008. Developing students'
statistical reasoning: connecting research and
teaching practice. Germany: Springer.
Gal, I., 2002. Adults' statistical literacy: Meanings,
components, responsibilities. International statistical
review, Vol. 70 No. 1. pp. 1-25.
Wade, B. & Goodfellow, M., 2009. Confronting statistical
literacy in the undergraduate social science
curriculum, Sociological Viewpoints, Pennsylvania.
Garfield, J., Hogg, B., Schau, C., & Whittinghill, D., 2002.
First couerses in statistical science: The status of
educational reform efforts. Journal of statistics
education. 10(2).
Hafiyusholeh, M., 2015. Literasi Statistik dan Urgensinya
Bagi Siswa. Wahana. 64(1), 1–8.
Mooney, E. S., 2002. A framework for characterizing
middle school students’ statistical thinking.
Mathematical Thinking and Learning. 4, 23-64.
Miles, M.B. & Huberman, A.M. 1994. Qualitative data
analysis: an expanded sourcebook (2nd. Ed). London:
Sage.
National Research Council, 2001. Adding it up: Helping
children learn mathematics. Washington, D.C.:
National Academy Press.
ICMIs 2018 - International Conference on Mathematics and Islam
500
