
Support Vector Machine Multiclass using Polynomial Kernel for
Osteoporosis Detection
Deasy Alfiah Adyanti
1
, Dian C. R. Novitasari
1
, and Aris Fanani
1
1
Department of Mathematics, UIN Sunan Ampel Surabaya, Ahmad Yani, Surabaya, Indonesia
Keywords: Support Vector Machine Multiclass, Polynomial Kernel, Osteopenia, Osteoporosis
Abstract: Support Vector Machine is a good performance machine learning algorithm applied as a classification
method. In SVM, several problems are difficult to be separated linearly, for mapping data from the lower
dimensional to the higher dimensional space, the kernel method is needed. The purpose of this research is to
classify data into normal bone, osteopenia, and osteoporosis using SVM Multiclass with polynomial kernel
parameters. The classification is based on the analysis of the mandibular ramus bone observed from changes
in the trabecular pattern of the jaw bone and hip fracture using SVM Multiclass. Before using SVM
multiclass, an image enhancement was performed with adaptive histogram equalization, and feature
extraction with the gray level co-occurrence matrix (GLCM). The variable input used in this research is
dental panoramic radiograph data as much as 61 data divided into two parts that are 75:25 as training and as
test data. Based on the implementation of SVM Multiclass with the polynomial kernel as the basis of
computer-aided diagnosis system for osteoporosis detection, the best test data accuracy is 81.25%.
1 INTRODUCTION
One of the machine learning algorithms that many
are developed and applied for the classification
problem is the SVM method. This method gives
better results than the other (Prasetyo, 2014). The
maximizing hyperplane is the idea of SVM
classification. SVM has a field that separates into
two class, they are positive class and negative class,
so SVM just classifies two classes or binary
classification. But, in the SVM several data can’t be
linearly separated by a separating hyperplane though
plus slack variable (Shastry, et al., 2017). So, the
SVM needs kernel method to be applied to data non-
linearly (Prasetyo, 2014). The basis of the kernel is
the mapping of data from low dimensional to high
dimension space (Feng & Liao, 2017).
Several problems have implemented SVM for
linear and nonlinear classification problems, one of
which is the classification of bone disease. Like
Muthu Subash Kavitha's research who implements
Fractal Dimension (FD) and GLCM for texture
analysis on the mandibular bone using panoramic
radiographic images for diagnosis of Korean female
osteoporosis (Kavitha, et al., 2014), the method of
classification used on the research are SVM, KNN,
and Naive Bayes Classifier.
Another study was also conducted by Suprijanto
which analysis panoramic radiographic images on
the mandibular bone for osteoporosis detection with
the GLCM method. In the research, the classification
method used is SVM for normal bone and
osteoporosis classification (Suprijanto, et al., 2013)
(Azhari, et al., 2014).
Based on these researches, alternative
osteoporosis detection is analysis the texture of the
mandibular bone using dental panoramic radiograph
(DPR) image which is classified using SVM.
Implementation of methods is very useful because of
osteoporosis is a type of silent disease and
progressive. The symptoms of the disease cannot be
known until the fracture. Consequences of the
disease are fractures, bone defects, complications,
until death (Ramkumar & Malathi, 2016). There
radiological examination of osteoporosis using
DEXA cannot be used as a good alternative to
detection osteoporosis. Inspection using tools such
as DEXA requires a relatively high cost and the
tools are limited (Ramkumar & Malathi, 2016).
In this research, texture analysis uses GLCM for
feature extraction and the method of classification
uses SVM Multiclass. SVM Multiclass implemented
384
Adyanti, D., Novitasari, D. and Fanani, A.
Support Vector Machine Multiclass using Polynomial Kernel for Osteoporosis Detection.
DOI: 10.5220/0008522303840390
In Proceedings of the International Conference on Mathematics and Islam (ICMIs 2018), pages 384-390
ISBN: 978-989-758-407-7
Copyright
c
2020 by SCITEPRESS – Science and Technology Publications, Lda. All rights reserved

to be able to classify bones into three categories
directly. They are normal, osteopenia and
osteoporosis. The expectation from this system can
classify bone based on grey level characteristics into
three categories and the result of this system is
suitable for early detection of osteoporosis.
2 LITERATURE REVIEWS
2.1 SVM Multiclass
The SVM method just for the problem of two
classes, so to the multiclass problem there are three
approaches. In this research use the ECOC approach.
It is one of SVM Multiclass method inspired by
theoretical information to send messages through the
channel (Kikuchi & Abe, 2005).
The idea of this approach is adding the data
redundant into the message like code word. So, the
recipient can detect errors in messages and can
recover the original message if there are several
minor errors (Prasetyo, 2014).
2.2 Kernel
The kernel is a method applied to non-linearly
separate data. The basis of the kernel is mapping the
data into higher dimensions space using functions
, with the multiplication of its function is
(Shastry, et al., 2017):
Some basis kernels have been used in SVM, such
as linear kernel, radial basic function, quadratic and
polynomial kernel. Each of these kernels used in
experiments to determine kernel and kernel
parameters that it can provide the best accuracy in
classification.
Using the mapping function , every form
multiplication
will be calculated
.
Next
d mapped to space with higher dimensions.
This research, polynomial kernel used for SVM
Multiclass classification. Equation 2 is the
polynomial kernel equation.
2.3 GLCM
The technique of two-order statistics that apply the
concept of relationship neighbor probability between
two pixels at a distance and an angle orientation is
called as GLCM (Kavitha, et al., 2014). GLCM has
four orientation angle with interval
, they are
dan
and distance set by 1 pixel
(Suprijanto, et al., 2013). GLCM has some statistical
features. On this research features the statistics used
are a combination of contrast, correlation, energy,
and homogeneity. The combination of these four
features it is the best input to bone mineral density
(BMD) classification rather than on a combination
of other features (Suprijanto, et al., 2013). Below is
the definition of features:
2.3.1 Contrast
The size of the grey intensity of an image or the size
of the grey element distribution in an image is called
as contrast (Hazra & Dutta, 2015). Equation 3 is
contrast equation.
N = Size of line/column
= Line
= Column
= Probability of co-occurrence matrix
2.3.2 Correlation
Correlation shows the size of the linear structure of
the grey of an image (Suprijanto, et al., 2013).
Equation 4 is the equation of the correlation.
With the mean and standard deviation in
equation 5 until 8
Support Vector Machine Multiclass using Polynomial Kernel for Osteoporosis Detection
385
2.3.3 Energy
Energy is the size of concentration eligible pixel of
co-occurrence matrix intensity on some coordinates
(Hazra & Dutta, 2015). Equation 9 is the energy
equation.
2.3.4 Homogeneity
Homogeneity is the homogeneity of the image that
has a similar degree of grey (Suprijanto, et al.,
2013). Equation 10 is the equation of homogeneity.
2.4 Image Enhancement
Image Enhancement is an enhancement of image on
a spatial domain that aims to the process the image
so that results are obtained more appropriate than the
original image (Gonzalez & Woods, 1997).
Processes on the spatial domain can be written in
equation 11.
is the input image,
is an output
image, and is an operator f, which is defined in the
neighborhood of (Gonzalez & Woods, 1997).
While AHE is a development of the histogram
equalization method aims for obtain a uniform
spread of histogram. So, every degree of gray image
of the DPR image has the number of uniform pixels
(Anand & Gayathri, 2015).
2.5 Osteoporosis
Osteoporosis is one type of disease chronicles
characterized by low mass bone, damage bone
structure and tissue accompanied by bone
architectural microstructure with decreased quality
of bone tissue. This disease can lead to bone
fragility, which is resulting in easy bone cracking, or
broken (Harrar & Hamami, 2012). Before the bone
has osteoporosis, the bone will have osteopenia.
Osteopenia is a state density (bone density) is less
meeting compared to normal bone in general
however quite low to be diagnosed as osteoporosis.
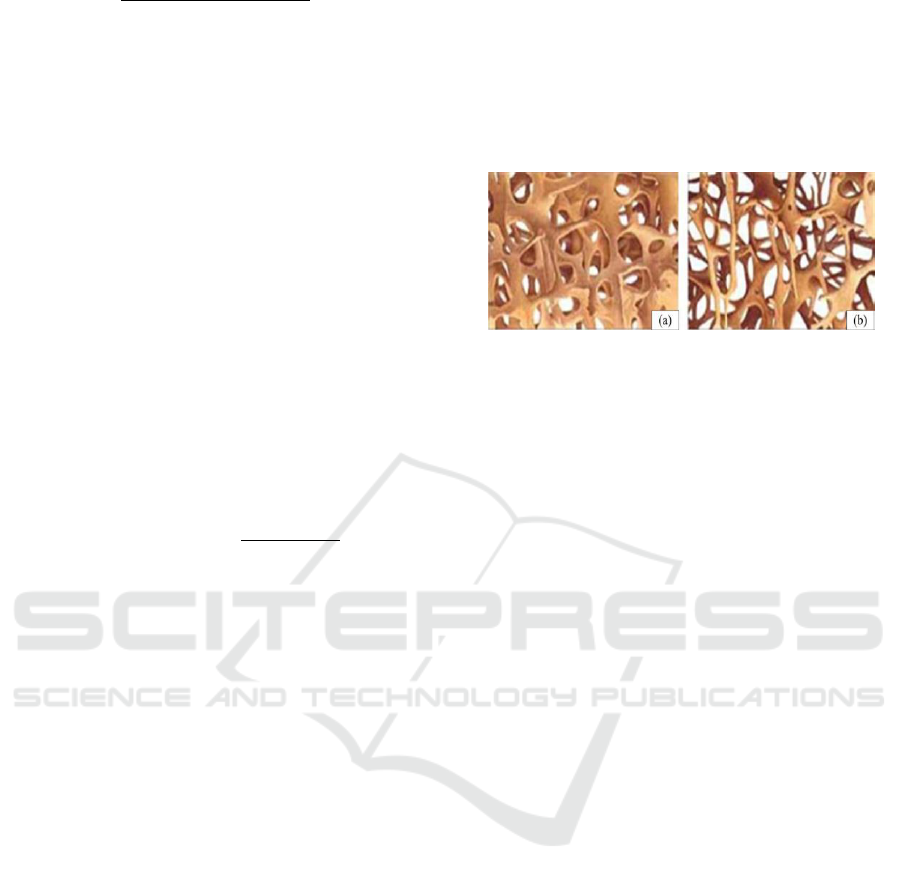
Figure 1 is micro-architectural images of bone
tissue.
Figure 1: Micro-CT Images of Trabecular Bone, (a)
Normal Bone (b) Osteoporosis
2.6 Dental Panoramic Radiograph
(DPR)
Panoramic radiography is one technique X-rays are
used to view the structure of facial teeth and jaw
including maxillary bone and the mandible bone and
its supporting structure. The type of image is RGB
(red, green, blue) (Fanani & Ulinnuha, 2016) that
can be used as alternative osteoporosis detection.
The DPR image has a relationship between
mandibular bone and bone mass density. We can
detection of osteoporosis with measure of the width
bone of the mandibular cortex and analysis the
density trabecular mandibular bone.
3 RESEARCH METHODS
3.1 Types of Research
Support vector machine using multiclass polynomial
kernel for osteoporosis detection including in the
type of applied research seen from the aspect of its
function. The results of this classification aim as an
appropriate and detection alternative accelerate
osteoporosis examination.
3.2 Data Collection
The data used in this research is the jaw bone data of
DPR is focused on the mandibular ramus to
determine the BMD. The amount of image data of
the DPR used as many as 61 data (24 is normal bone
data, 24 is osteopenia, and 13 is osteoporosis). Data
ICMIs 2018 - International Conference on Mathematics and Islam
386
obtained from Clinical Laboratory Pramita Jl. Raya
Jemur Andayani 67 Surabaya.
3.3 Data Analysis
This research use jaw bones data. The total of data is
61 DPR images (24 is osteopenia, 24 is normal bone,
and 13 is osteoporosis). Data is divided into two
parts. The first part as 45 training data (18 is
osteopenia, 18 is normal bone, and 9 is
osteoporosis), and the second part as 16 testing data
(6 is osteopenia, 6 is normal bone and 4 is
osteoporosis). In achieving the goals in this study, it
is necessarily carried out data analysis steps with
using three steps. They are image pre-processing,
feature extraction using GLCM and classification
using SVM Multiclass.
3.4 Testing and Evaluation
The first test is done by image pre-processing by
taking DPR image which then carried out texture
analysis using GLCM to get feature extraction which
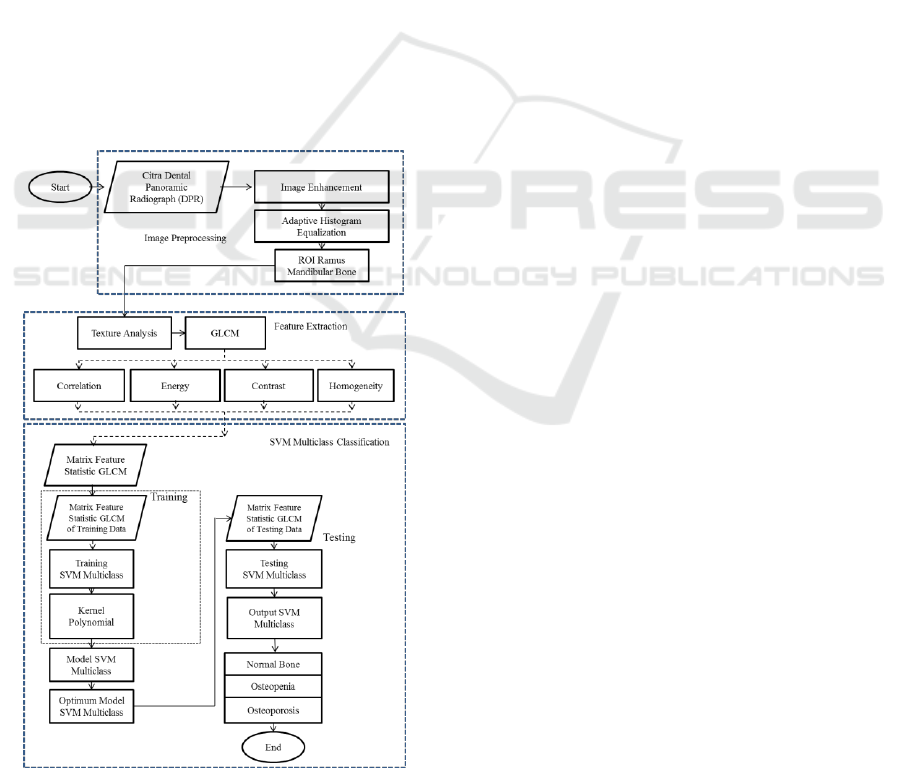
used as input for SVM Multiclass. Figure 2 is a
flowchart of osteoporosis detection.
Figure 2: Flowchart SVM Multiclass for Osteoporosis
Detection
The steps of osteoporosis detection as follows:
a. The process of image enhancement or
ordinary referred to as the pre-processing.
b. The image of DPR is improved using the
image enhancement with adaptive histogram
equalization methods.
c. After the image is processed by adaptive
histogram equalization, then, used ROI
process with cropping 80 x 100 pixels on the
mandibular bone, in order for the image to be
focused on the ramus mandibular bone.
d. The texture analysis is then performed using
GLCM to get feature extraction.
e. The results of the GLCM are taken from four
features statistics. They are contrast, energy,
correlation, and homogeneity.
f. The vector feature matrix derived from the
feature statistics contrast, energy, correlation,
and homogeneity. Then four feature statistics
used as SVM Multiclass input.
g. Division of data obtained from the matrix
features vector GLCM, data is divided into
training and test data.
h. Selection of kernel (we used polynomial
kernel) and SVM parameters, because data is
nonlinear data obtained from the matrix of
GLCM vector features.
i. The establishment of the SVM Multiclass
model
j. After SVM Multiclass model is obtain, the
next step is testing phase.
k. After the testing phase is complete, got the
optimum model from the best angle
orientation of GLCM and best kernel of
SVM, next determined results classification.
l. Classification is divided into three categories
such as normal bone, osteopenia, and
osteoporosis.
4 RESULT AND DISCUSSION
Patients with osteoporosis, the number of trabecular
will decrease due to the reduction of estrogen
hormone that caused occur depletion of trabecular.
The containing section many trabecular are
mandibular bones. In this research, the mandibular
bone ROI was selected is located in the ramus
mandibular. This matter because the ramus
mandibular bone is the bone which is rough, broad
and sharper and often experiencing a bone fracture.
Figure 3 is the sample of DPR images.
Support Vector Machine Multiclass using Polynomial Kernel for Osteoporosis Detection
387
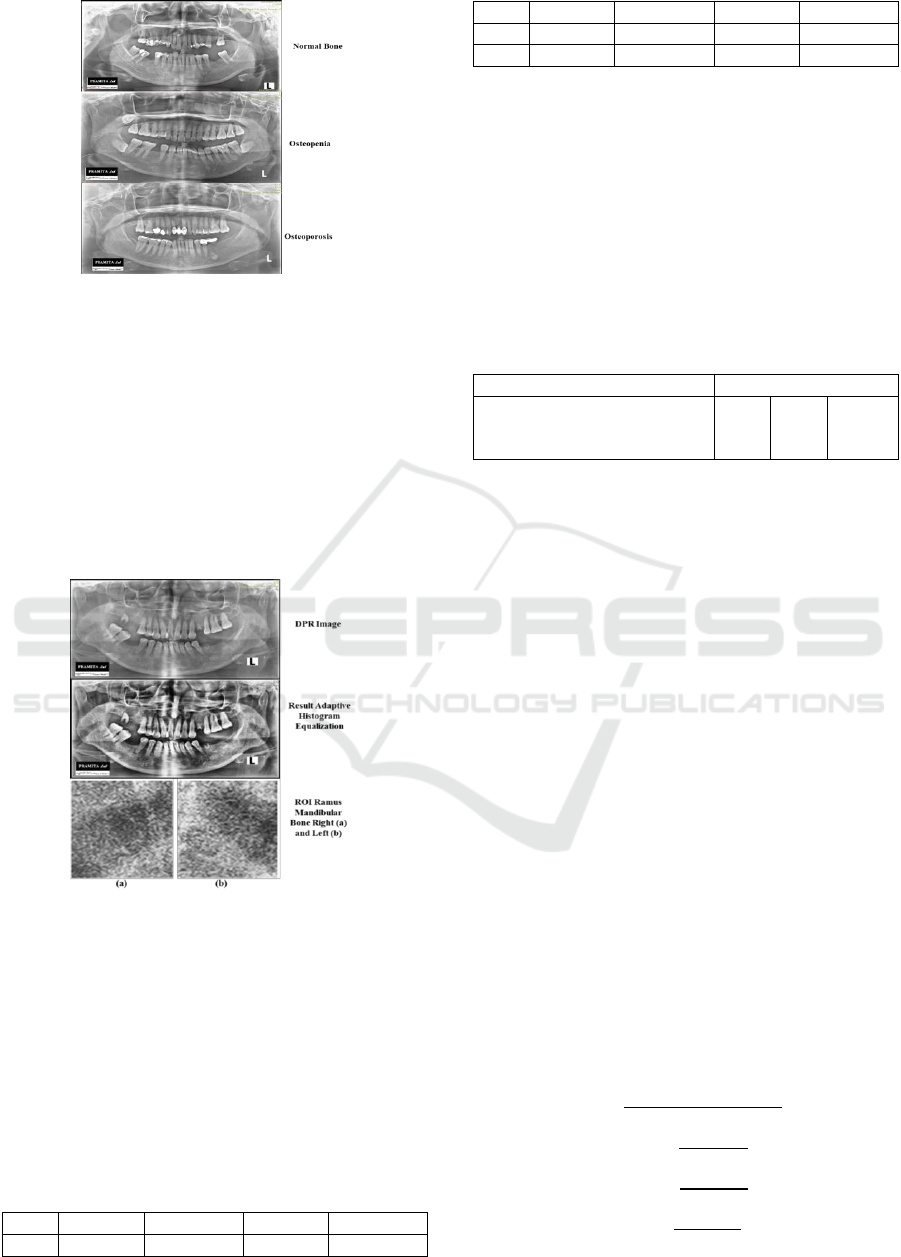
Figure 3: Sample Data of DPR Images
Image processing in this research is done
through three steps such as phase of pre-processing
data, feature extraction step and classification step.
Step of pre-processing done in the form of process
grayscale, image enhancement, adaptive histogram
equalization, and ROI in the form of cropping on the
ramus mandibular bone with the size of 100 x 80
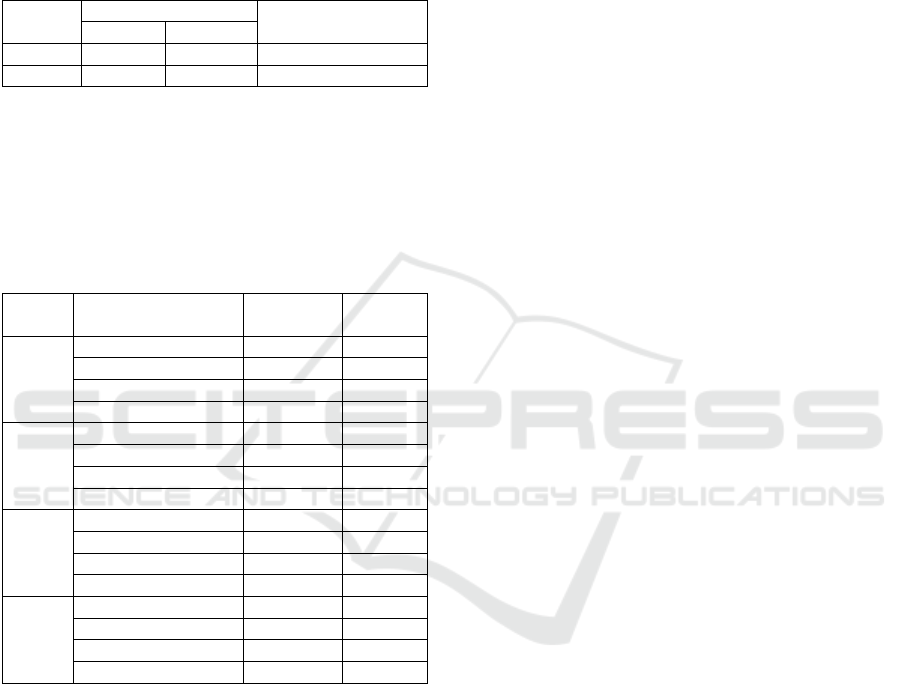
pixels. The following Figure 4 is the result of the
improvement image of DPR.
Figure 4: Pre-processing Result
Furthermore, GLCM texture analysis was
performed on ROI ramus mandibular bone to get
feature statistics from correlation, contrast, energy,
and homogeneity. The feature extraction is
calculated using Equation 2.3 to Equation 2.10.
Using the equation got the value feature extraction
with orientation angle
and
and
with distance pixels. Result from a single
data train in table 4.1.
Table 1: Value of Contrast, Correlation, Energy, and
Homogeneity
C
Co
E
H
0
0.4632
0.8861
0.0953
0.7978
45
0.6281
0.8454
0.0825
0.7557
90
0.4405
0.8911
0.0967
0.8011
135
0.6035
0.8515
0.0844
0.7602
With:
= Angle Orientation of GLCM
C = Contrast
Co = Correlation
E = Energy
H = Homogeneity
The problem of osteoporosis detection using
SVM classification is a problem multiclass, then this
research uses the ECOC method. Long code word
which will be used in this research is three bits, as
shown in Table 2.
Table 2: Encoding Class to Osteoporosis Detection
Class
Code word
N (1)
Os (2)
Osteo(3)
1
0
0
1
0
1
1
1
0
With N is normal bone, Os is osteopenia, an
Osteo is osteoporosis. Based on the encoding class
in Table 2, then, carried out the construction of the
model. The first model is a binary model for
separator between {'normal'} with {'osteopenia',
'osteoporosis'}. The second model is separator
between {'normal', 'osteoporosis'} with
{'osteopenia'}, and the third model is the separator
between {'normal', 'osteopenia'} with
{'osteoporosis'}. Next, the calculation of Hamming
distance to be matched with class nearest.
The steps of the algorithm use the ECOC
classification is the same as the algorithm SVM
binary classification. By using the kernel polynomial
with two degrees, the next step we built SVM
model. Each element of the kernel matrix is the
result which correlated with
and is a
replacement for dot product inequality of duality
Lagrange multiplier. After obtained SVM Multiclass
model, then used confusion matrix as a measure of
classification work for the detection of osteoporosis
using four measuring performance are accuracy,
sensitivity, specificity, and precision. The equation
of accuracy, sensitivity, specificity, and precision is
equation 12 to 15.
ICMIs 2018 - International Conference on Mathematics and Islam
388
The testing of osteoporosis diagnose uses Table
3, with TP is the patient has the disease and diagnose
is exact, TN is the patient hasn’t diseased and
diagnose is exact, FP is the patient hasn’t diseased
and diagnose is wrong, and FN is the patient has the
disease and diagnose is wrong.
Table 3: Result of Diagnose
Real
Prediction
Sum
Positive
Negative
Present
TP
FN
TP + FN
Absent
F)
TN
FP + TN
Experiment results with four orientation angles
using the kernel polynomials are expressed in Table
4. Then, implementation of SVM Multiclass method
with analysis dental panoramic radiograph images
on the ROI ramus mandibular used as basic on
CADS has been ably used as osteoporosis detection.
Table 4: Value of Confusion Matrix
Angel
Working Estimator
Classification
Training
Testing
Accuracy
75,5%
62,5%
Sensitivity
72,2%
55,6%
Specificity
86,8%
80%
Precision
78%
42%
Accuracy
66,67%
81,25%
Sensitivity
64,8%
75%
Specificity
82,7%
90%
Precision
64,5%
88,89%
Accuracy
68,89%
81,25%
Sensitivity
66,67%
55,56%
Specificity
83,6%
80%
Precision
66,4%
42,3%
Accuracy
80%
81,25%
Sensitivity
78,2%
75%
Specificity
89,2%
90%
Precision
81,67%
88,89%
Based on Table 4, extraction features GLCM
with four features statistics shown the best
orientation angle is
and distance pixels.
Results show the accuracy of test data generated of
81.25%, sensitivity of 75%, specificity of 90%, and
precision of 88.89%.
5 CONCLUSIONS
Based on the result of SVM method implementation
Multiclass with the polynomial kernel for
osteoporosis detection, it can be concluded that
SVM Multiclass method with kernel polynomials of
two degrees can be used as the basis of CADS for
osteoporosis detection. Extraction features GLCM
based on a combination of four feature statistics to
identify the value bone mineral density from the one
analysis the mandibular ramus bone has pointed at
the best orientation angle is
with distance
pixels. The results show the best test data accuracy
is 81.25%, sensitivity is 75%, specificity is 90%, and
precision is 88.89%.
REFERENCES
Anand, S., Gayathri, S., 2015. Mammogram image
enhancement by two-stage adaptive histogram
equalization. Elsevier, pp. 3150-3152.
Azhari, et al., 2014. Analisis Citra Radiografi Panoramik
pada Tulang Mandibula untuk Deteksi Dini
Osteoporosis dengan Metode Gray Level Cooccurence
Matrix (GLCM). MKB, pp. 203 - 208.
Fanani, A., Ulinnuha, N., 2016. Watermarking Citra
Digital Menggunakan Metode Discrete Cosine
Transform. Jurnal Matematika "Mantik", pp. 1-7.
Feng, C., Liao, S., 2017. Scalable Gaussian Kernel
Support Vector Machines with Sublinear Training
Time Complexity. Information Sciences Journal, pp.
1-33.
Gonzalez, R. C., Woods, R. E., 1997. Digital Image
Processing. New Jersey: Prentice Hall.
Harrar, K., Hamami, L., 2012. An Interconnectivity Index
for Osteoporosis Assessment Using X-Ray Images.
Journal of Medical and Biological Engineering, 33(6),
pp. 569-575.
Hazra, T. K., Dutta, S., 2015. A New Approach to Identify
the Fracture Zone and Detection of Bone Diseases of
X-Ray Image. International Journal of Science and
Research (IJSR), ISSN (Online): 2319-7064, Paper
ID: ART20161989, pp. 1640-1646.
Kavitha, M. S., An, S.-Y. and An, C.-H., 2014. Texture
Analysis of Mandibular Cortical Bone on Digital
Dental Panoramic Radiographs for the Diagnosis of
Osteoporosis in Korean Women. Journal of Oral
Surgery, Oral Medicine, Oral Pathology and Oral
Radiology, pp. 1-22.
Kikuchi, T., Abe, S., 2005. Comparison between error
correcting output codes and fuzzy support vector
machines. Elsevier, pp. 1937-1945.
Prasetyo, E., 2014. Data Mining, Mengelola Data Menjadi
Informasi Menggunakan Matlab. Yogyakarta: ANDI
Yogyakarta.
Ramkumar, S., Malathi, R., 2016. Detection of
Osteoporosis and Osteopenia using Bone
Densitometer - Simulation Study. Elsevier, pp. 1024-
1036.
Shastry, K. A., Sanjay, H. and Deexith, G., 2017.
Quadratic-Radial-Basis-Function-Kernel for
classifying multi-class agricultural datasets with
continuous attributes. Applied Soft Computing
Journal, pp. 1-30.
Support Vector Machine Multiclass using Polynomial Kernel for Osteoporosis Detection
389

Suprijanto, et al., 2013. Dental panoramic image analysis
on mandibular bone for osteoporosis early detection.
International Conference on Instrumentation Control
and Automation (ICA), pp. 1-6.
ICMIs 2018 - International Conference on Mathematics and Islam
390
