
Logistic Regression on the Data of Lecturer Performance Index
on IAIN Purwokerto
Mutijah
Department of Mathematics Education, IAIN Purwokerto,Banyumas, Indonesia
Keywords: Lecturer Performance Index, Age, Lecturer, Category, Assessment, Department, Student, Logistic,
Regression
Abstract: This paper concerns to analyze the relationship between independent variables, including age, categories of
lecturer, assessment components which they are each related, and a dependent variable lecturer performance
index (LPI) using logistic regression. The background led this research is the exposure of LPI stated that the
young lecturers, internal lecturers of Not State Civil Apparatus (NSCA), obtain small values of LPI and
IAIN Purwokerto makes groups of LPI are not fine and fine performance. The steps in data analysis i.e.
make simple graphs to plotting data, make tables, calculate data, model the logistic regression and interpret
the result. There are three categories of lecturers i.e. State Civil Apparatus (SCA), Internal Lecturer Not
SCA (NSCA), and External Lecturer (EL) with ages between 26.00 and 65.58 years old. The assessment
component of LPI consists of Department’s Assessment and Student’s Assessment. The results show that,
using binary logistic regression, the effect of age of lecturer is not significant, the effect of the lecturer
category is significant with the 95% confidence interval is (0.3168, 1.0772), the department assessment is
significant with the 95% confidence interval is (0.9008, 2.7432), and the student assessment is significant
with the 95% confidence interval is (0.0770, 3.0130).
1 INTRODUCTION
Lecturer Performance Index abbreviated as LPI is a
score obtained by the lecturer after carrying out a
number of tasks that must be carried out as an
institutional task. One of the interests of the LPI is a
monitor to develop lecturers’ professional and
careers, besides that the LPI functions to realize the
work culture of the lecturers in improving the
quality of their institutions. On the basis of these
interests, the lecturer is required to refer the
conducted performance results on one semester in
the implementation of the main activities and
functions in the institution of higher education. IAIN
Purwokerto as an institution providing higher
education also conducts an assessment of the LPI to
ensure the implementation of the main duties of the
lecturer to run according to the legislation.
The exposure of the LPI of IAIN Purwokerto
lecturers stated the young lecturers obtain small
values of LPI on the odd semester in 2017, Internal
lecturers of Not State Civil Apparatus (NSCA) also
obtain small values of LPI, and IAIN Purwokerto
make group of LPI into the two groups that are a not
fine LPI and a fine LPI or the other word that IAIN
Purwokerto has two categories of LPI. While age of
lecturers is found the youngest is 26.00 years and the
oldest is 65.58 years.
Logistic regression model has become one of any
data analysis concerned with describing the
relationship between a response (outcome or
dependent) variable and one or more predictor
(explanatory or independent) variables. The
predictor variables are often called covariates. A
binary logistic regression model is that binary or
dichotomous in response’s variable (Hosmer, 2000).
The goal of an analysis by using binary logistic
regression is to describe the relationship between a
response variable and a set of predictor variables
which the response variable includes two categories.
A data set will lead to analyze the relationship
between one predictor variable and one response
variable. They are age, category of lecturer, lecturer
performance index for 220 subjects, also the
department’s assessment and student’s assessment
for 201 subjects in 2018. The data is taken from
IAIN Purwokerto. The data also is found ages of
lecturer are 26.00-65.58 years, three categories of
Mutijah, .
Logistic Regression on the Data of Lecturer Performance Index on IAIN Purwokerto.
DOI: 10.5220/0008520502650270
In Proceedings of the International Conference on Mathematics and Islam (ICMIs 2018), pages 265-270
ISBN: 978-989-758-407-7
Copyright
c
2020 by SCITEPRESS – Science and Technology Publications, Lda. All rights reserved
265

X
X
x
10
10
e 1
e
)(
+
+
+
=
xxg
10
(x) - 1
(x)
ln )(
+=
=
lecturer are State Civil Apparatus (SCA), Internal
Lecturer Not SCA (NSCA), and External Lecturer
(EL), assessment components of LPI consist of
Department’s Assessment and Student’s
Assessment.
A data set also lists categories of lecturers in
IAIN Purwokerto that number of State Civil
Apparatus (SCA) are 131 lecturers included 26 no
fine and 105 fine, Internal Lecturer Not SCA
(NSCA) are 50 lecturers included 7 no fine and 43
fine, and External Lecturer (EL) are 39 lecturers
included 22 no fine and 17 fine. As for data of 201
lecturers for the department’s assessment and
student’s assessment that each includes 22 lecturers
in no fine category and 179 are fine.
Finally, this paper organize by the second section
is the basic theories and later, analyze the data set by
binary logistic regression. Data representation and
visualization are presented, also the interpretation of
data analysis is done. Conclusion will finish in the
analysis of the IAIN Purwokerto lecturer’s data.
2 THE BASIC THEORIES
2.1 Logistic Regression
The specific form of the logistic regression model
uses as below
(1)
where π(x) = E(Y|x) represent the conditional mean
of Y given x when the logistic distribution is used
(Hyeoun-Ae, 2013).
A transformation of π(x) that is central to study
logistic regression is the logit transformation. This
transformation is defined in terms of π(x) as
(2)
The importance of this transformation is that
has many of the desirable properties of a linear
regression model (Tranmer and Elliot, 2008;
Thomsen and Lundbeck, n.d.). The endpoints of a
100(1 - α)% confidence interval for slope coefficient
are
(3)
where
is upper 100(1-α/2)% point from the
standard normal distribution.
The reason to use the logistic regression in this
data analysis are logistic regression do not require a
linear relationship between independent and
dependent variables, the independent variable does
not require the multivariate normality assumptions,
the independent variable can be in terms of continue
and category data, dependent variable must be
dichotomy that is two categories, and samples
required in relatively large quantities, minimum
required up to 50 data samples for an independent
variable. In this research use more than 50 data to be
analyzed.
2.2 Performance
The person’s performance can be influenced by
internal and external factors. Internal factors
included psychic and physical. Physical component
for example health, gender, age, and external factors
included salary, working conditions, work
relationship, position (Handoko, 2002). IAIN
Purwokerto has done an assessment of LPI five
times from 2015 until 2018, only once in 2018. IAIN
Purwokerto also declares that LPI < 3.00 is no fine
and LPI ≥ 3.00 is fine. IAIN Purwokerto has three
categories of lecturer since 2017 that is State Civil
Apparatus (SCA), Internal Lecturer Not SCA
(NSCA), and External Lecturer (EL) (Tim, 2016).
Department’s Assessment includes four components
in IAIN Purwokerto. A way to evaluate based on the
time interval, when 1) lecturer give the planning of
learning, 2) lecturer give the question of final exam
of the semester, 3) lecturer give the final exam score,
and 4) how many lecturers teach students in one
semester. Department’s assessment score is made in
scale 0 - 4 (Tim, 2016). Student’s assessment is
obtained from the evaluation of the lecturer learning
in each course class by students. A way to evaluate
based on the results of a questionnaire given to
students. The score of the student’s assessments is
also made in scale 0 - 4 too.
3 RESULTS OF THE DATA
ANALYSIS
When faced with a set of data, a person will play
around with them, an activity called (explanatory)
data analysis. The activity is elementary calculation
will be made, simple graphs will be plotted, and also
table will be made (Dennis, 2001). Based on the
ICMIs 2018 - International Conference on Mathematics and Islam
266
definition as Dennis (2001), this research will
analyze a data set of IAIN Purwokerto’s lecturers by
making scatter plot, calculating the coefficient of
logistic regression, modelling the logistic regression
and interpreting this model.
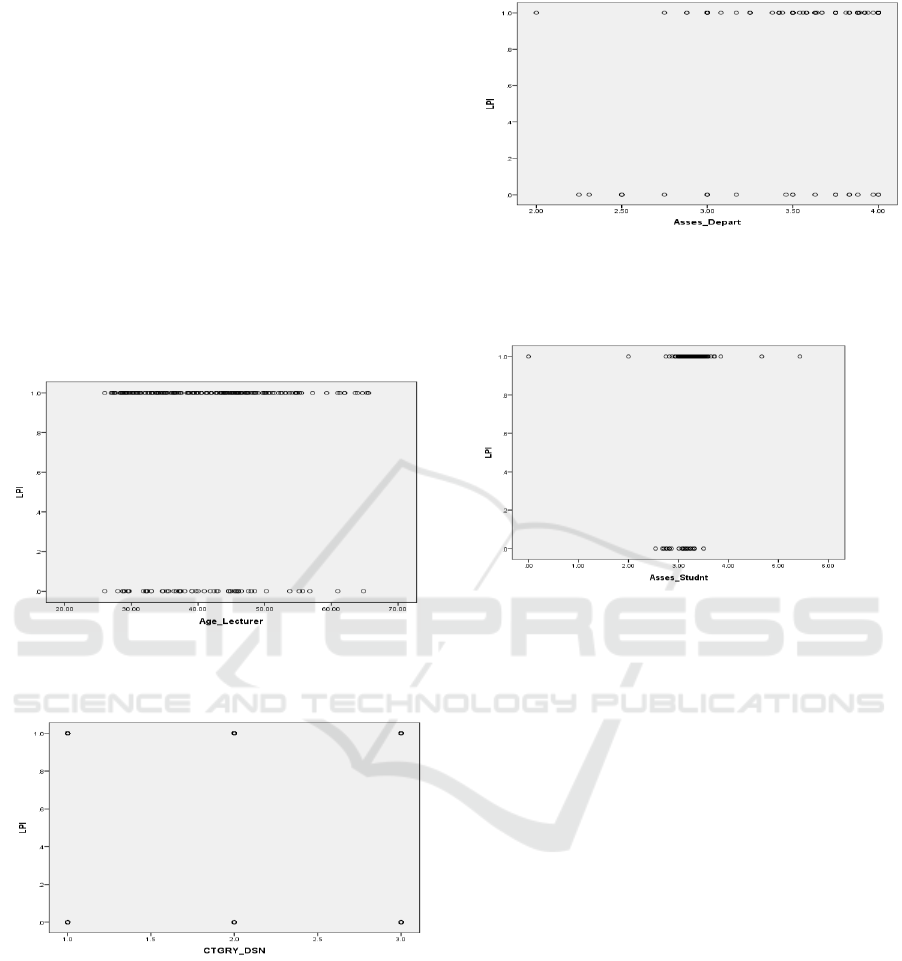
3.1 Scatter Plot
This subsection will present the scatter plot of data
analysis of IAIN Purwokerto’s lecturers show
relationship between age and lecturer performance
index (LPI), category of lecturer and lecturer
performance index (LPI), department’s assessment
and lecturer performance index (LPI), also student’s
assessment and lecturer performance index (LPI).
Figure 1: Scatter plot for lecturer’s age versus LPI for 220
lecturers.
Figure 2: Scatter plot for lecturer’s categories versus LPI
for 220 lecturers.
Figure 3: Scatter plot for department’s assessment versus
LPI for 201 lecturers.
Figure 4: Scatter plot of LPI by the student assessment for
201 lecturers.
Figure 1 - 4 describe the variability in ages,
lecturer category, assessment component at all LPIs
are large. This is difficult to describe the functional
relationship between age and LPI, lecturer category
and LPI, also assessment component and LPI. One
common method of removing some variation while
still maintaining the structure of the relationship
between outcome and the independent variable is to
create intervals for the independent variable and
compute the mean of the outcome variable within
each group by the logistic regression analysis.
3.2 The Coefficient Calculation of
Logistic Regression Model
This subsection will present the coefficient
calculation of logistic regression model using an
applied of binary logistic regression. The calculation
will be used to make the logistic regression showed
the relationship between age and lecturer
performance index (LPI), the category of lecturer
and lecturer performance index (LPI), department’s
assessment and lecturer performance index (LPI),
Logistic Regression on the Data of Lecturer Performance Index on IAIN Purwokerto
267

also student’s assessment and lecturer performance
index (LPI).
Table 1: The coefficient of the logistic regression for the
lecturer age variable.
Variable
Coeff.
Std. Error
Sig.
Age of
Lecturer
.015
.017
.377
Constant
.457
.710
.520
Table 1 shows that p-value for the age is 0.377. It
can be said that it is not enough evidence to reject
the hypothesis that there is no relationship between
age of lecturer and LPI. Therefore, the age of
lecturers is not affected LPI’s no fine or fine with 95
% confidence.
Table 2: The coefficient of the logistic regression for the
lecturer category.
Variable
Coeff.
Std.
Error
Sig.
Exp
(Coeff.)
Category
of Lecturer
.697
.194
.000
2.007
Constant
-.544
.463
.241
.581
Table 2 talks that it is enough evidence to reject
the hypothesis that there is no relationship between
the category of lecturer and LPI. The other words,
the category of lecturer’s influence LPI’s no fine or
fine with the 95% confidence interval (0.3168,
1.0772).
Table 2 also talks that if category of lecturer is 1
then probability of category affect LPI’s fine equal
to exp(-0.544 + 0.697(1))/(1+ exp(-0.544 +
0.697(1))) = 0.5382 or other means that EL will
affect LPI’s fine as much as 58.82 percent, if
category of lecturer is 2 then probability of category
influence LPI’s fine equal to exp(-0.544 +
0.697(2))/(1+ exp(-0.544 + 0.697(2))) = 0.7006 or
other means that NSCA will influence LPI’s fine as
much as 70.06 percent, and if category of lecturer is
3 then probability of category influence LPI’s fine
equal to exp(-0.544 + 0.697(3))/(1+ exp(-0.544 +
0.697(3))) = 0.8245 or other means that SCA will
influence LPI’s fine as much as 82.45%.
Table 3: The coefficient of the logistic regression for
department’s assessment variable.
Variable
Coeff.
Std. Err
Sig.
Exp
(Coeff.)
Department’s
assessment
1.822
.470
.000
6.186
Constant
-4.301
1.606
.007
.014
Table 3 explain that it is enough evidence to
reject hypothesis that there is not relationship
between the department’s assessment and LPI. The
other words, department’s assessment effect LPI’s
no fine or fine with the 95% confidence interval is
(0.9008, 2.7432).
Table 3 also explain that if department’s
assessment is exactly 0 then probability of category
influence LPI’s fine equal to exp(-4.301 + 1.822(0))
/ (1+ exp(-4.301 + 1.822(0))) = 0.0138 or other
means that department’s assessment will influence
LPI’s fine as much as 1.38 percent, if department’s
assessment is exactly 1 then probability of
department’s assessment influence LPI’s fine equal
to exp(-4.301 + 1.822(1)) / (1+ exp(-4.301 +
1.822(1))) = 0.773 or other means that department’s
assessment will influence LPI’s fine as much as 7.73
percent, if department’s assessment is exactly 2 then
probability of department’s assessment influence
LPI’s fine equal to exp(-4.301 + 1.822(2)) / (1+
exp(-4.301 + 1.822(2))) = 0.3414 or other means
that department’s assessment will influence LPI’s
fine as much as 34.14 percent, if department’s
assessment is exactly 3 then probability of
department’s assessment influence LPI’s fine equal
to exp(-4.301 + 1.822(3)) / (1+ exp(-4.301 +
1.822(3))) = 0.7622 or other means that
department’s assessment will influence LPI’s fine as
much as 76.22 percent, and if department’s
assessment is exactly 4 then probability of
department’s assessment influence LPI’s fine equal
to exp(-4.301 + 1.822(4)) / (1+ exp(-4.301 +
1.822(4))) = 0.9520 or other means that
department’s assessment will influence LPI’s fine as
much as 95.20%.
Table 4: The coefficient of the logistic regression for the
student’s assessment variable.
Variable
Coeff.
Std. Err
Sig.
Exp
(Coeff.)
Student’s
Assessment
1.545
.749
.039
4.686
Constant
-2.840
2.393
.235
.058
Table 4 talks that it is enough evidence to reject
hypothesis that there is no relationship between the
student’s assessment and LPI. The other words,
student’s assessment influence LPI’s no fine or fine
with the 95% confidence interval is (0.0770,
3.0130).
Table 4 also explain that if student’s assessment
is exactly 0 then probability of category influence
LPI’s fine equal to exp(-2.840 + 1.545(0)) / (1+
exp(-2.840 + 1.545(0))) = 0.0552 or other means
that department’s assessment will influence LPI’s
fine as much as 5.52 percent, if department’s
ICMIs 2018 - International Conference on Mathematics and Islam
268

assessment is exactly 1 then probability of
department’s assessment influence LPI’s fine equal
to exp(-2.840 + 1.545(1)) / (1+ exp(-2.840 +
1.545(1))) = 0.2150 or other means that
department’s assessment will influence LPI’s fine as
much as 21.50 percent, if department’s assessment
is exactly 2 then probability of department’s
assessment influence LPI’s fine equal to exp(-2.840
+ 1.545(2)) / (1+ exp(-2.840 + 1.545(2))) = 0.5622
or other means that department’s assessment will
influence LPI’s fine as much as 56.22 percent, if
department’s assessment is exactly 3 then
probability of department’s assessment influence
LPI’s fine equal to exp(-4.301 + 1.822(3)) / (1+
exp(-2.840 + 1.545(3))) = 0.8575 or other means
that department’s assessment will influence LPI’s
fine as much as 85.75 percent, and if department’s
assessment is exactly 4 then probability of
department’s assessment influence LPI’s fine equal
to exp(-2.840 + 1.545(4)) / (1+ exp(-2.840 +
1.545(4))) = 96.58 or other means that department’s
assessment will affect LPI’s fine as much as
96.58%.
3.3 Logistic Regression Model and
Its Interpretation
This subsection will present the logistic regression
model from the calculation as in section III point B
TABLE I-TABLE IV showed the analysis results of
the relationship between age and lecturer
performance index (LPI), category of lecturer and
lecturer performance index (LPI), department’s
assessment and lecturer performance index (LPI),
also student’s assessment and lecturer performance
index (LPI).
Binary logistic regression model that show the
relationship between age and LPI is:
(4)
where X is the age variable and
as in The
Basic Theories, with the p-values is 0,377. It means
the model is not significant.
Binary logistic regression model that show the
relationship between lecturer categories and LPI is:
(5)
where X is the independent variable of THE lecturer
category and the p-values is 0.000. It means the
model is significant with 95% confidence interval is
(0.3168, 1.0772).
Binary logistic regression model that show the
relationship between department’s assessment and
LPI is:
(6)
where X is the independent variable of the
department’s assessment and the p-values is 0.000.
It means the model is significant with 95%
confidence interval is (0.9008, 2.7432).
Binary logistic regression model that show the
relationship between student’s assessment and LPI
is:
(7)
where X is the independent variable of the student’s
assessment and the p-values is 0.000. It means the
model is significant with 95% confidence interval is
(0.0770, 3.0130).
Based on the all of results (equation (4) – (7))
that the Lecturer Performance Index (LPI) of IAIN
Purwokerto is not affected by the lecturer’s age but
it is affected by the lecturer category, the
department’s assessment, and the student’s
assessment.
4 CONCLUSIONS
Based on the binary logistic regression can be found
that three relationship between the independent
(predictor or explanatory) variable and the
dependent (response or outcome) variable i.e. the
first, the lecturer category variable influence the
IAIN Purwokerto lecturer’s LPI; the second, the
department’s assessment variable influence the IAIN
Purwokerto lecturer’s LPI and the third is the
student’s assessment variable also influence the
IAIN Purwokerto lecturer’s LPI. While the lecturer
age variable is not influencing the IAIN Purwokerto
lecturer’s LPI. The student’s assessment variable
influences greater than the department’s assessment
variable in the IAIN Purwokerto lecturer’s LPI.
ACKNOWLEDGEMENTS
Author is very grateful to Kementerian Agama
Republik Indonesia and IAIN Purwokerto which
have provided funds for this research. Author would
like to thank for committee of the 1st International
Conference on Mathematics and Islam (ICMIs 2018)
which they have given opportunity to present my
research in ICMIs 2018. Especially, author is very
grateful to anonymous reviewers for comments and
suggestions.
Logistic Regression on the Data of Lecturer Performance Index on IAIN Purwokerto
269

REFERENCES
Dennis, V. L., 2001. The philosophy of statistics. Journal
of the Royal Statistical Society: Series D (The
Statistician) banner.
Handoko, T. H., 2002. Manajemen Personalia dan
Sumber Daya Manusia. BPFE UGM, Yogyakarta.
Hosmer, D. W. and Stanley, L., 2000. Applied logistic
regression 2
nd
edition. John Wiley&Sons.
Hyeoun-Ae, P., 2013. An introduction to logistic
regression: from basic concepts to interpretation
with particular attention to nursing domain. J.
Korean Acad Nurs Vol. 43 No. 2, April.
Thomsen, B. L. and Lundbeck, H., n. d. Logistic
regression analysis. Retrieved from
http://staff.pubhealth.ku.dk/~pd/V+R/slides/genmod.
pdf, accessed on November 28, 2018.
TIM, 2016. Panduan Indeks Kinerja Dosen (IKD). LPM
IAIN PURWOKERTO.
Tranmer, M. and Elliot, M., 2008. Binary logistic
regression. Cathie Marsh Centre for Census and
Survey Research. Retrieved from
http://hummedia.manchester.ac.uk/institutes/cmist/ar
chive-publications/working-papers/2008/2008-20-
binary-logistic-regression.pdf, accessed on
November 28, 2018.
ICMIs 2018 - International Conference on Mathematics and Islam
270
