Identification of Alzheimer’s Disease in MRI Data using Discrete
Wavelet Transform and Support Vector Machine
Putri Wulandari, Dian Candra Rini Novitasari and Ahmad Hanif Asyhar
Departement of Mathematics, UIN Sunan Ampel Surabaya
Jl Ahmad Yani No. 117 Surabaya, Indonesia
Keywords: Support Vector Machine, Discrete Wavelet Transform, Alzheimer’s Disease.
Abstract: Dementia is a serious problem, recorded worldwide as 4.6 million cases of dementia each year, 60-70%
caused by Alzheimer’s disease. Alzheimer’s disease interferes with daily activities that can lead to death. In
order to obtain proper treatment by a specialist, early detection is required. So, this paper aims to assist the
medical in diagnosing Alzheimer’s disease. Detection of Alzheimer’s disease begins with segmentation the
feature of magnetic resonance imaging (MRI) data using Fuzzy C-Means (FCM ) into three clusters, using
Discrete Wavelet Transform (DWT) to extract the features of all sub-band ‘Haar’, ‘Daubechies 2’, and
‘Daubechies 4’, and classified using the Support Vector Machine (SVM) into two classes: Alzheimer and
non-Alzheimer. The result shows that approximation sub-band third level wavelet transformations in ‘Haar’
is the best method to identify Alzheimer’s disease, with the accuracy value is 97.37%, the sensitivity value
to detect Alzheimer’s disease is 100%, and the specificity value is 92.86%.
1 INTRODUCTION
Most of the elderly people degenerated central
nervous system. It caused a progressive loss of
cognitive function called dementia. It is a serious
problem, 4.6 million cases of dementia each year,
60-70% caused by Alzheimer’s disease was
recorded (Alzheimer’s Disease International, 2008).
Alzheimer’s symptoms are characterized by memory
impairment, changes in mood and personality,
problematic interactions, and abstract thinking (Al-
Naami, 2013). Memory and cognitive of
Alzheimer’s Patients will be decreased for 3 to 9
years. Alzheimer’s disease interferes with daily
activities that can lead to death. Predicted in the next
20 years, people with Alzheimer’s will increase year
by year (Zhang et al., 2011). In order to obtain
proper treatment by a specialist, early detection is
required. It is also possible for Alzheimer’s patients
to plan future decisions before their condition
becomes worse and they considered a burden to their
environment.
Non-invasive methods used to diagnose or
observe the brain tissue of people with Alzheimer’s
are magnetic resonance imaging (MRI) and positron
emission tomography (PET). Compared by other
imaging techniques, MRI is the best choice because
the images result of the anatomical structures of the
brain with brain tissues different contrasted, fewer
artifacts, faster and without using X-ray radiation
(Nayak et al., 2016). The test results of Alzheimer’s
patients MRI looks the abnormalities in the cortical
and periventricular areas, there are hippocampal
atrophy and amygdala in the subcortical region, as
well as enlargement of the basal cisterna and fissure
Sylvia which is early symptoms of dementia (The
National Academy on an Aging Society, 2000).
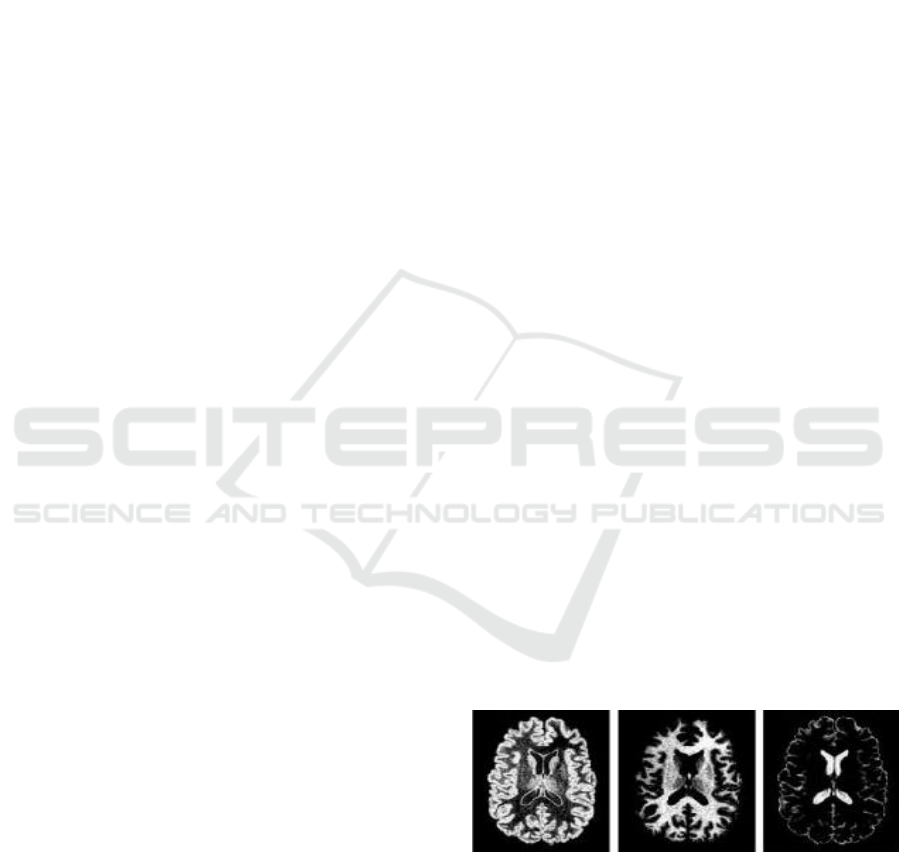
GM WM CSF
Figure 1: Brain Tissues.
In Figure 1, the brain has three basic tissue
classes, there is gray matter (GM), white matter
(WM), and cerebrospinal fluid (CSF). David Wilson
used GM segmentation results to reduce errors in
classification because statistical analysis of GM can
reduce false positive findings (Wilson &
198
Wulandari, P., Novitasari, D. and Asyhar, A.
Identification of Alzheimer’s Disease in MRI Data using Discrete Wavelet Transform and Support Vector Machine.
DOI: 10.5220/0008519301980204
In Proceedings of the International Conference on Mathematics and Islam (ICMIs 2018), pages 198-204
ISBN: 978-989-758-407-7
Copyright
c
2020 by SCITEPRESS – Science and Technology Publications, Lda. All rights reserved

Laxminarayan, 2007). One of a common technique
used to segmentation image is Fuzzy C-Means
(FCM), the method classified the data into multiple
classes by assign the members of data to the center
of the cluster (Afifah, Rini, & Lubab, 2016). Iraki
Khalifa, et. al. (2012) segmented MRI brain image
using a combined algorithm called Wavelet Fuzzy
C-Means (WFCM). He used the Wavelet method for
feature extraction and FCM to segment into three
classes.
Wavelet transformation is one of the common
image analysis techniques used to extract features. It
gives many feature space, also a good time and
resolution to generated wavelet coefficient with
strong features that can improve the accuracy in
classification (Aiswarya & Simon, 2013). Luis
Javier H, et. al. using Discrete Wavelet Transform
(DWT) at extract features, Principal Component
Analysis (PCA) at reducing features and NMIRS at
features selection to identify Alzheimer’s disease in
Mild Cognitive Impairment (MCI) conditions. The
results show that dimensional reduction in PCA and
NMIRS processes can cause the results of the
classification have poor accuracy and preferably use
the SVM method to obtain better accuracy (Herrera
et al., 2013). Lahmiri & Boukadoum (2013)
analyzed MRI data using multiscale analysis (MSA)
to get fractals with six different scales using a
Support Vector Machine (SVM). It gives the results
from 93 classified MRI brain data; 51 images are
normal brains and 42 images are Alzheimer’s.
In this paper, we identified Alzheimer’s disease
based on MRI data using FCM to segment the GM
characteristics of the brain. Furthermore, DWT is
used to extract the statistical data of the
segmentation reduction brain, and classified into two
categories, Alzheimer or non-Alzheimer, using
SVM.
2 MANUSCRIPT PREPARATION
2.1 Alzheimer
Alzheimer’s is one of the causes of dementia, which
causes memory loss and progressive personality
changes (Al-Naami, 2013). Alzheimer’s disease was
first discovered by Alois Alzheimer’s when
examining an elderly patient who was confused and
difficult to understand questions and had a chaotic
memory. Based on the stages of Alzheimer’s
disease, there are preclinical, mild cognitive
impairment, and dementia stages. Alzheimer’s
disease begins when ‘plaque’ proteins are between
nerve cells and damage to the nerve fibers area.
Patients with Alzheimer’s need special care, because
patients will have severe memory problems,
confusion, and difficulty understanding questions,
such as time, places, pictures, situations, and others
(Mareeswari et al., 2015).
2.2 Histogram Equalization
To improve the image that the pixel distribution is
uneven (having a range of distant values) is used
histogram equalization (Kaur, 2015). Histogram
Equalization produces an image output whose pixel
intensity over a dynamic range is evenly distributed
(Pandey et al., 2016). Histogram Equalization can be
expressed in the transformation function in
Equation(1):
T (x) =
Maksimum Intensity
N
,
(1)
where N is the total value of pixels in the image and
n
i
is the pixel value at the intensity i.
2.3 Fuzzy C-Means
In 1973, Dunn the first time demonstrated FCM
which was further refined by Professor Jim Bezdek
in 1981 (Janani et al., 2013). FCM is part of Fuzzy
Clustering which is used to analyze patterns of data
(Febrianti et al., 2016). From the results of the
analysis, the data is processed to be grouped,
segmented, or classified. In Fuzzy Clustering, each
data point has a degree of the cluster so that cluster
edge points will be clustered to a lower level than
the cluster center.
To obtain the result of segmentation, the first
step by representing the frequency value of image
data. Then create a vector from minimal to maximal
from the data and select a random central point with
a minimum value is 2. After that calculate the
membership matrix and cluster center. Then the
process stops if the condition has been fulfilled
(Mohammed et al., 2016).
2.4 Discrete Wavelet Transform
Wavelet is a mathematical function used to describe
data into different frequency components, and it will
be studied each component according to its scale
resolution (Herrera et al., 2013). There are many
types of wavelet families, but the type frequently
used is Haar and Daubechies. At each level, it will
pass through high-pass and low-pass filter processes
(Novitasari, 2015). Discrete Wavelet Transformation
Identification of Alzheimer’s Disease in MRI Data using Discrete Wavelet Transform and Support Vector Machine
199
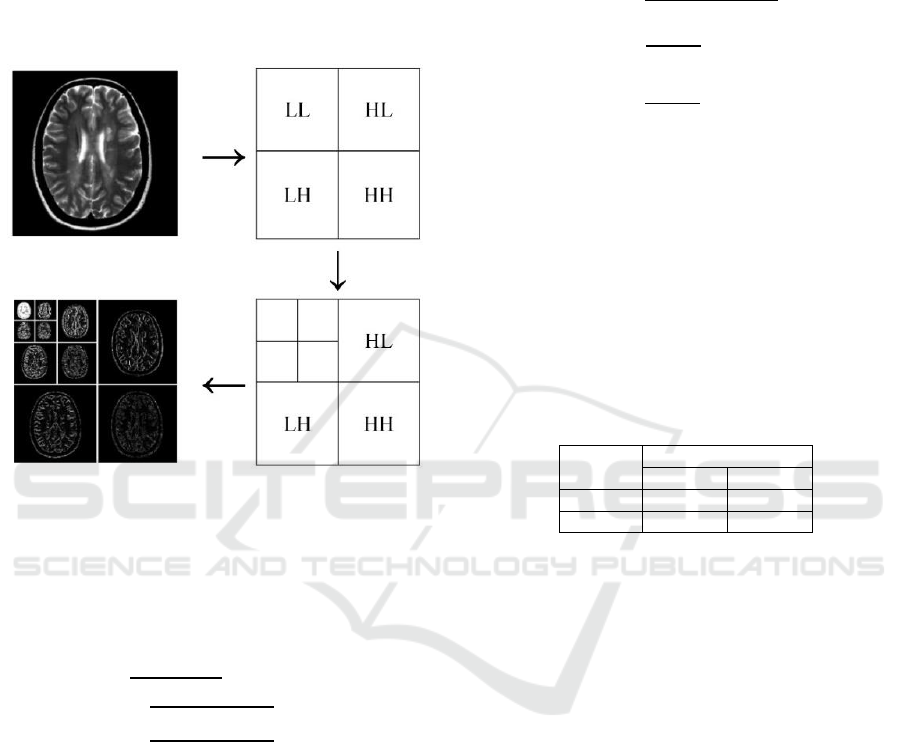
(DWT) 2D assumes wavelet coefficients in four sub-
band images, they are LL, LH, HL, HH (Janani et
al., 2013). It represents four decomposition layers
that shown in Figure 2, the component detail is the
horizontal direction for LH (Low-High), vertical for
HL (High-Low), diagonal for HH (High-High) and
Approximation for LL (Low-Low) (Nayak et al.,
2016).
Figure 2: Wavelet Decomposition.
The information is provided by DWT can be
used to statistical analysis and signal synthesis (Isar,
Moga & Lurton, 2005). In DWT 2D the information
is used to get features values of images, they are the
value of the mean, standard deviation, and entropy.
Mean =
n
(2)
Std =
n - 1
(3)
Entropy =
P
i,j
(-ln P
i,j
)
i,j
(4)
2.5 Support Vector Machine
SVM is one of the learning methods used to the
detection of classification, regression, and outliers
(Evgeniou & Pontil, 2001). The idea of
implementing SVM is the value of a vector is
mapped into a high-dimensional feature space. The
SVM method has two basic steps, they are training
and testing. The value of accuracy, specificity, and
sensitivity need to be known to test the accuracy of
classification of data testing based on previous
training.
Accuracy =
TP+TN
TP + TN + FP+ FN
(5)
Specificity =
TN
TN+ FP
(6)
Sensitivity =
TP
TP+ FN
.
(7)
The Accuracy value is the value that measures
the success rate of the classification performed.
Sensitivity is a value that measures how many
people who have the disease are correctly diagnosed
that it is diseased. Meanwhile, the specificity value
is the inverse of sensitivity value,is a value that
measures how many normal people are correctly
diagnosed that it isn’t diseased (Nayak et al., 2016).
To determine the value of True Positive (TP), True
Negative (TN), False Positive (FP) and False
Negative (FN) can be seen in Table 1.
Table 1: Confusion Matrix.
Actual
Classification
+
-
+
TP
FN
-
FP
TN
3 METHODS
In this paper, this type of research is included into
applicative research because the input and output
data for the identification of Alzheimer’s disease
using DWT and SVM is numerical data, which
results analysis aims to assist the medical in
diagnosing Alzheimer’s disease.
The data used are MRI brain axial data obtained
from Alzheimer’s Disease Neuroimaging Initiative
(ADNI) and E-Health Laboratory. The concentration
of this research is to classify MRI brain data into
two categories: Alzheimer’s or non-Alzheimers. The
proposed method through four steps, they are pre-
processing step before being processed in the next
step, feature segmentation using FCM, feature
extraction using DWT and Binary SVM for
classification. For the process scheme in detail
described Figure 3.
ICMIs 2018 - International Conference on Mathematics and Islam
200
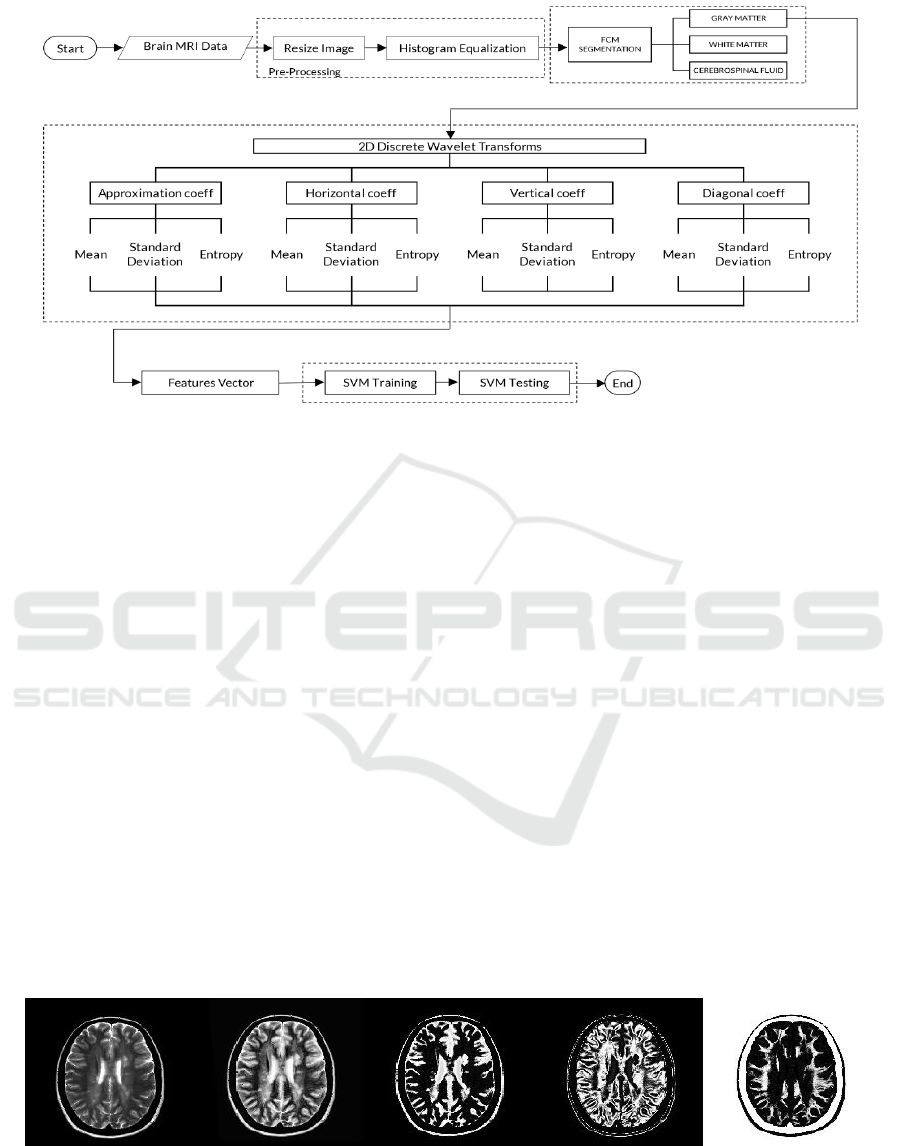
Figure 3: Diagram of the Process
The first step, pre-processing is applied to ease
image processing, sometimes the owned image data
has a different contrast, lighting, and noise each
image data. In the pre-processing step, MRI brain
data input is grayscale images. Furthermore, for the
normalized image then image applied enhancement
by histogram equalization.
Furthermore, the second step is using FCM, to
obtain feature segmentation of GM, WM, and CSF,
the number of clusters which inserted is three. From
the three features of GM, WM, and CSF, we just
used the GM feature. In feature extraction, we used a
third level decomposition wavelet of ‘Haar’,
‘Daubechies 2’, and ‘Daubechies 4’. The coefficient
values of each sub-band, we used the value of the
mean, standard deviation, and entropy as features
vector that input into the SVM classification step.
In the classification step, the data divided into
two using K-Fold Cross-validation, there are training
data and testing data with the ratio is 60:40. The
statistical value of four features, mean, standard
deviation and entropy of each coefficient sub-band
‘Haar’, ‘Daubechies 2’, and ‘Daubechies 4’ from
training data is used to obtain optimal SVM model.
4 RESULTS AND DISCUSSION
The identification of Alzheimer’s disease using
several methods. They are FCM used to
segmentation, DWT used to extraction and SVM
techniques used to a classification of brain MRI
data. Before feature extraction is done to get features
used as entered SVM Classify, pre-processing and
segmentation step is required. The pre-processing
and segmentation results are represented in figure 3.
The next, the features are taken from GM image
on each coefficient sub-band (approximation,
horizontal, vertical, diagonal) such as value of mean,
standard deviation, and entropy in ‘Haar’,
‘Daubechies 2’, and ‘Daubechies 4’ (as shown in
Table 2) used as input in SVM classification. Then
to validate the value of accuracy, specificity, and
sensitivity classified result used Confusion Matrix.
( a ) ( b) ( c ) ( d ) ( e )
Figure 4: Image Processing: (a) Brain MRI, (b) Histogram Equalization, (c) GM, (d) CSF, (e) WM.
Identification of Alzheimer’s Disease in MRI Data using Discrete Wavelet Transform and Support Vector Machine
201
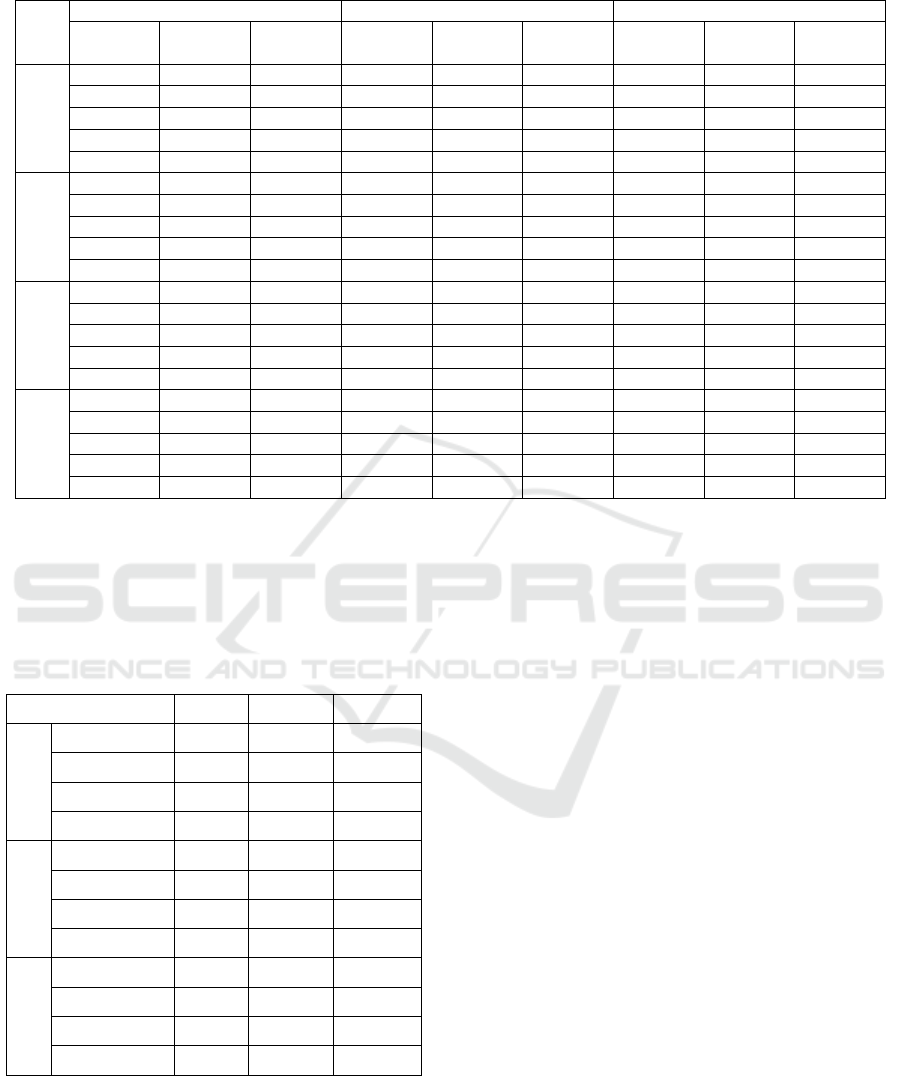
Table 2: Sample Data of ‘Haar’, ‘Daubechies 2’, and ‘Daubechies 4’ Feature Extraction Results.
DWT
Haar
daubechies 2
daubechies 4
Mean
Standard
Deviation
Entropy
Mean
Standard
Deviation
Entropy
Mean
Standard
Deviation
Entropy
Approximation
Coefficient
0.92790
1.06963
-8525.1
0.89383
1.12633
-8959.7
0.77470
1.12954
-10743.1
1.05097
1.04035
-9784.4
1.01031
1.10373
-10139.4
0.86936
1.11494
-12076.5
0.85547
1.00409
-10208.4
0.82263
1.05912
-10679.6
0.70922
1.05904
-12830.5
0.91542
1.05529
-10505.7
0.87999
1.12865
-10978.0
0.75765
1.12752
-13124.1
1.00198
1.10337
-9355.2
0.96331
1.15995
-9986.5
0.82974
1.16532
-12100.5
Horizontal
Coefficient
-0.00644
0.40793
-14573.1
0.00294
0.40136
-31989.2
-0.00611
0.37279
-36245.0
-0.00618
0.43333
-14170.3
0.00292
0.44677
-45716.6
-0.00568
0.42042
-49755.0
0.00234
0.44067
-13842.5
-0.00471
0.43706
-45176.4
0.00054
0.42566
-49888.2
0.01574
0.44483
-14349.4
-0.00348
0.46092
-43948.3
0.01570
0.44368
-51455.3
-0.01178
0.44307
-13150.9
0.00301
0.43729
-44058.6
-0.01057
0.39870
-50625.2
Vertical
Coefficient
-0.00290
0.43375
-14213.3
0.00525
0.40736
-31700.8
-0.00321
0.38676
-35541.2
0.00410
0.44014
-14297.1
-0.00392
0.44948
-45879.4
0.00240
0.42577
-47522.9
0.00265
0.41185
-13870.4
-0.00808
0.42242
-45852.7
0.00021
0.39422
-49069.0
-0.00120
0.44549
-14361.0
-0.01616
0.40899
-16339.7
-0.00839
0.38546
-48696.2
-0.01239
0.43696
-13063.2
0.01290
0.41123
-43632.0
-0.00665
0.38254
-50172.9
Diagonal
Coefficient
-0.00075
0.21045
-15760.9
0.00079
0.21856
-48450.7
0.00144
0.21133
-50337.4
-0.00074
0.24626
-15927.6
-0.00259
0.24379
-76079.1
-0.00023
0.24867
-73724.7
0.00094
0.24736
-14871.2
0.00258
0.23843
-74795.1
0.00095
0.23325
-75186.2
-0.00036
0.22875
-15631.7
0.00024
0.22668
-18111.1
-0.00106
0.22462
-72641.2
-0.01007
0.22859
-14288.6
-0.00896
0.21956
-72062.9
-0.00468
0.21597
-74847.9
Based analysis of MRI data features in each sub-
band in ‘Haar’, ‘Daubechies 2’, and ‘Daubechies 4’
which become input binary SVM Classifier,
obtained different percentage value of accuracy,
sensitivity, and specificity.
Table 3: Value of Accuracy, Sensitivity, and Specificity.
Wavelet Transform
Accuracy
Sensitivity
Specificity
Daubechies 4
Approximation
97.37
100.00
92.86
Horizontal
92.11
100.00
78.57
Vertical
89.47
100.00
71.43
Diagonal
92.11
100.00
78.57
Daubechies
2
Approximation
97.37
100.00
92.86
Horizontal
86.84
100.00
64.29
Vertical
92.11
100.00
78.57
Diagonal
89.47
91.67
85.71
Haar
Approximation
97.37
100.00
92.86
Horizontal
94.74
100.00
85.71
Vertical
94.74
100.00
85.71
Diagonal
97.37
100.00
92.86
Based on table 3 we can see that the selection of
LL
3
(approximation) sub-band wavelet
transformations in ‘Haar’, ‘Daubechies 2’, and
‘Daubechies 4’ has the same result, with the
accuracy value is 97.37%, the sensitivity value to
detects Alzheimer’s disease is 100%, and the
specificity value is 92.86%. Based on 38 Testing
data, 24 data are correctly identified as Alzheimer’s
and 13 data as Non-Alzheimer. Meanwhile, one of
non-Alzheimer’s data was identified as Alzheimer’s,
shown in Table 4. However, if viewed based on all
sub-band on each wavelet family tested, ‘Haar’ is
the best solution.
5 CONCLUSION
Dementia is a serious problem that 3 million cases of
Alzheimer’s disease were recorded. Alzheimer’s
disease interfered daily activities that can lead to
death. We identified Alzheimer’s disease based on
MRI data using FCM to segment and DWT to
extract the GM characteristic features of the brain.
Furthermore, we used SVM to classify into
Alzheimer or non-Alzheimer categories based on the
analysis of GM MRI data features. Each sub-band
(approximation, horizontal, vertical, diagonal) in
‘Haar’, ‘Daubechies 2’, and ‘Daubechies 4' obtained
a different percentage of accuracy, sensitivity, and
specificity values. So, we concluded that using
approximation sub-band third level wavelet
transformations in ‘haar is the best solution to
identify Alzheimer's disease, with the accuracy value
is 97.37%, the sensitivity value to detects
ICMIs 2018 - International Conference on Mathematics and Islam
202

Alzheimer’s disease is 100%, and the specificity
value is 92.86%.
Table 4: Result of SVM Classification using ‘Haar’
Approximation Third Level Wavelet Transform.
No
Data Classification
Binary SVM Classification
1
Alzheimer
Alzheimer
2
Alzheimer
Alzheimer
3
Alzheimer
Alzheimer
4
Alzheimer
Alzheimer
5
Alzheimer
Alzheimer
6
Alzheimer
Alzheimer
7
Alzheimer
Alzheimer
8
Alzheimer
Alzheimer
9
Alzheimer
Alzheimer
10
Alzheimer
Alzheimer
11
Alzheimer
Alzheimer
12
Alzheimer
Alzheimer
13
Alzheimer
Alzheimer
14
Alzheimer
Alzheimer
15
Alzheimer
Alzheimer
16
Alzheimer
Alzheimer
17
Alzheimer
Alzheimer
18
Alzheimer
Alzheimer
19
Alzheimer
Alzheimer
20
Alzheimer
Alzheimer
21
Alzheimer
Alzheimer
22
Alzheimer
Alzheimer
23
Alzheimer
Alzheimer
24
Alzheimer
Alzheimer
25
Non-Alzheimer
Non-Alzheimer
26
Non-Alzheimer
Non-Alzheimer
27
Non-Alzheimer
Non-Alzheimer
28
Non-Alzheimer
Non-Alzheimer
29
Non-Alzheimer
Non-Alzheimer
30
Non-Alzheimer
Non-Alzheimer
31
Non-Alzheimer
Non-Alzheimer
32
Non-Alzheimer
Non-Alzheimer
33
Non-Alzheimer
Non-Alzheimer
34
Non-Alzheimer
Non-Alzheimer
35
Non-Alzheimer
Non-Alzheimer
36
Non-Alzheimer
Non-Alzheimer
37
Non-Alzheimer
Non-Alzheimer
38
Non-Alzheimer
Alzheimer
REFERENCES
Afifah, N., Rini, D. C., & Lubab, A., 2016. Pengklasteran
Lahan Sawah di Indonesia sebagai Evaluasi
Ketersediaan Produksi Pangan Menggunakan Fuzzy
C-Means. Mantik, 02(01), 40–45.
Aiswarya, V. S., & Simon, J., 2013. Diagnosis of
Alzheimer’s disease in Brain Images using Pulse
Coupled Neural Network. International Journal of
Innovative Technology and Exploring Engineering
(IJITEE), 2(6), 99–101.
Al-Naami, et. al., 2013. Automated Detection of
Alzheimer Disease using Region Growing Technique
and Artificial Neural Network. World Academy of
Scince, Engineering and Technology, International
Journal of Biomedical and Biological Engineering Vol
7(5): 204 – 208. Retrieved from
http://www.waset.org/publications/11271.
Alzheimer’s Disease International, 2008. Global
Alzheimer’s Disease Charter. Retrieved from
https://www.alz.co.uk/global-charter.
Evgeniou, T. & Pontil, M., 2001. Support Vector
Machines: Theory and Applications. Machine
Learning and Its Applications, pp. 249–257, Part of
the Lecture Note in Computer Science book series
(LNCS, Vol. 2049).
Febrianti, F., Hafiyusholeh, Moh. & Asyhar, A. H., 2016.
Perbandingan Pengklusteran Data Iris Menggunakan
Metode K-Means Dan Fuzzy C-Means. Jurnal
Matematika “Mantik,”02(01), 7–13.
Herrera, L. J., Rojas, I., Pomares, H., Guillen, A.,
Valenzuela, O., & Banos, O., 2013. Classification of
MRI Images for Alzheimer’s Disease Detection. 2013
International Conference on Social Computing, 846–
851.
Isar, A., Moga, S., & Lurton, X., 2005. A Statistical
Analysis of the 2D Discrete Wavelet Transform. Proc.
of the International Conference AMSDA, May 17-20,
Brest, France, pp. 1275-1281.
Kaur, S., 2015. Noise Types and Various Removal
Techniques. International Journal of Advanced
Research in Electronics and Communication
Engineering (IJARECE), 4(2), 226-230.
Khalifa, I., Youssif, A., & Youssry, H., 2012. MRI Brain
Image Segmentation based on Wavelet and FCM
Algorithm. International Journal of Computer
Applications, 47(16), 32–39.
Lahmiri, S., & Boukadoum, M., 2013. Alzheimer’s
Disease Detection in Brain Magnetic Resonance
Images using Multiscale Fractal Analysis. ISRN
Radiology, 2013, Article ID. 627303.
http://dx.doi.org/10.5402/2013/627303.
Mareeswari, S., & Dr, G., 2015. A Survey: Early
Detection of Alzheimer’s Disease Using Different
Techniques. International Journal on Computational
Science & Applications, 5(1), 27–37. DOI:
10.5121/ijcsa.2015.5103.
Mohammed, H. R., Alnoamani, H. H., & Jalil, A. A.,
2016. Improved Fuzzy C-Means Algorithm for Image
Segmentation. International Journal of Advanced
Research in Artificial Intelegence, 5(6), 7-10.
Nayak, D. R., Dash, R. and Majhi, B., 2016. Brain MR
Image Classification using Two-Dimensional Discrete
Wavelet Transform and AdaBoost with Random
Forests. Neurocomputing, 177, 188–197.
Novitasari, D. C. R., 2015. Klasifikasi Sinyal EEG
Menggunakan Metode Fuzzy C-Means Clustering
(FCM) Dan Adaptive Neighborhood Modified
Identification of Alzheimer’s Disease in MRI Data using Discrete Wavelet Transform and Support Vector Machine
203

Backpropagation (ANMBP). Jurnal Matematika
"MANTIK", 1(1), 31–36.
Pandey, A., Chandra, R., Dutta, M. K., Burget, R., Uher,
V., & Minar, J., 2016. Automatic detection of red
lesions in Diabetic Retinopathy using Shape based
extraction technique in fundus image. Conference:
2016 39th International Conference on
Telecommunications and Signal Processing (TSP),
538–542.
Janani, S., Marisuganya, R., and Nivedha, R., 2013. MRI
Image Segmentation using Stationary Wavelet
Transform and FCM Algorithm Under the guidance
of. International Journal of Computer Applications
(0975–8887), International Conference on Innovations
in Intelligent Instrumentation, Optimization and
Signal Processing “ICIIIOSP-2013”, pp. 1–4.
The National Academy on an Aging Society, 2000.
Alzheimer ’s Disease and Dementia.
Wilson, D., & Laxminarayan, S., 2007. Handbook of
Biomedical Image Analysis: Volume II : Segmentation
Models, Part B. New York: Kluwer Academic/
Plenum Publishers.
Zhang, D., Wang, Y., Zhou, L., Yuan, H., & Shen, D.,
2011. Multimodal Classification of Alzheimer’s
Disease and Mild Cognitive Impairment. Neuroimage,
55(3), 856–867, doi:
10.1016/j.neuroimage.2011.01.008.
ICMIs 2018 - International Conference on Mathematics and Islam
204
