
Diabetic Retinopathy: Identification and Classification using
Different Kernel on Support Vector Machine
Ahmad Zoebad Foeady, Dian Candra Rini Novitasari and Ahmad Hanif Asyhar
UIN Sunan Ampel Surabaya, Jln.A. Yani 117, Surabaya, Indonesia
Keywords: SVM Classifier, GLCM, Diabetic Retinopathy, Polynomial, Gaussian, Kernel.
Abstract: Diabetic Retinopathy (DR) is one complication of diabetes that characterized by high glucose levels in the
eyes that ultimately lead to blindness. To minimize the occurrence of blindness from DR, required diagnosis
on the eye to possible for early treatment. In this paper, identified and classified DR using Gray Level Co-
occurrence Matrix (GLCM) as feature extraction and Multiclass SVM with different kernel functions. The
purpose of this study is to provide a breakthrough for patients in diagnosing the severity of the DR. The
components identified in DR images include blood vessels, microaneurysms, and hemorrhages with contrast,
energy, correlation, and homogeneity as feature extraction data on the GLCM method. The feature data will
be classified using the Multiclass SVM method with 4 different kernel functions such as quadratic, linear,
gaussian, and polynomial. The feature data will be classified using the Multiclass SVM method with 4
different kernel functions. Identification and classification of the DR image have an accuracy from each of
quadratic, linear, Gaussian, and polynomial kernels functions are 72.72%, 22.72%, 63.64%, and 90.91%.
From that accuracy, it has seen polynomial kernel function is more suitable for DR classification.
1 INTRODUCTION
Diabetic Retinopathy (DR) is one of the many
complications caused by diabetes mellitus. It caused
by the hormone insulin that can’t be produced
effectively causing blood sugar levels in the pancreas
is not balanced and make the concentration of glucose
in the blood increases (Gori et al., 2017). Diabetes is
often a problem that has long faced by some people
in the world due to having a great chance in causing
death. In patients with diabetes for more than 10 years
will arise a variety of complications as a side effect of
diabetes is one of them is DR. DR occurs because
there is an increase in glucose concentration in the eye
nerve. high glucose levels will cause leakage and
swelling due to blockage of blood vessels in the eye
nerve. As a result, there are several signs to recognize
as DR, such as microaneurysms, hemorrhages, hard
exudates, cotton wool spots, and venous loops
(Sopharak et al., 2008). These components are used
to identification of DR epidemics. Under certain
conditions in patients with DR, nerve of the eye
experiences abnormalities as it grows on the surface
of the retina. It difficult to treat that conditions
because can approach blindness (Aravind et al.,
2013).
Yau et al. (2012) estimated that the number of
diabetics in the world around 34.6% or more precisely
about 93 billion people and about 10.2% of the
world's people suffer from DR. From the results
obtained by the World Health Organization (WHO),
about 5% of cases of blindness in the world caused by
DR. Based on that high prevalence rate, it necessary
then further treatment is needed for DR cases to be
reduced or be prevented. However, treatment is
needed for the identification of the DR to know the
severity and that treatment can more effective. In DR
there are several levels to measure its severity. In DR
there are several levels to measure its severity, such
as normal, non-proliferative DR (NPDR), and
proliferative DR (PDR). Non-proliferative DR itself
consists of 3 levels of severity that is mild, moderate,
and sever (Sopharak et al., 2008).
On the identification of DR can be done in several
ways, one of them by using color fundus image. To
find color fundus image data, can be found or
obtained at the nearest eye specialist hospital for the
classification process. For identification, the obtained
image is processed to obtain images of
microaneurysms and hemorrhages contained in the
blood vessel (BV). To simplify identification, it
72
Foeady, A., Novitasari, D. and Asyhar, A.
Diabetic Retinopathy: Identification and Classification using Different Kernel on Support Vector Machine.
DOI: 10.5220/0008517400720079
In Proceedings of the International Conference on Mathematics and Islam (ICMIs 2018), pages 72-79
ISBN: 978-989-758-407-7
Copyright
c
2020 by SCITEPRESS – Science and Technology Publications, Lda. All rights reserved

necessary to detect that BV because in BV have
microaneurysms and hemorrhages (Yun et al., 2008).
Before classification, the image processing
through the preprocessing stage such as green channel
extraction, histogram equalization, contrast
enhancement, filtering, and binarization.
Preprocessing aims to process the image so that
information can be obtained in accordance with the
components to be taken. After that, the image will be
taken statistical data through feature extraction
process. In this research, the extraction of features
using Gray Level Co-occurrence Matrix (GLCM)
because of feature extraction based on texture
analysis and it suitable for DR identification
(Minajagi & Mashal, 2015). Feature extraction is
obtained by statistical data to be classified according
to the specified target. GLCM is particularly suitable
in extracting DR images because it can decrease the
positive false value of the confusion matrix and it can
increase the accurate value (Maule et al., 2016).
Classification is performed after feature
extraction process. The classification process using
the multiclass SVM method with normal, NPDR, and
PDR classes. NPDR classes data being mild,
moderate, and severe. The SVM method was chosen
because that classification method gives good results
with a fast process than other classification methods
(Herrera et al., 2013). SVM method has a function
that used to transform data for input in classification,
this function is called kernel function. There are
several types of kernel functions present in SVM,
such as polynomial, quadratic, gaussian, and linear
(Anthony, Greg & Tshilidzi, 2007).
In a study conducted by Dian Candra R. N. has
succeeded in classifying DR using decomposition
wavelet method as feature extraction and ANMBP
method as its classification method (Novitasari,
2016). Further research was conducted by Maule et
al. (2016). Maule et al. (2016) extract the DR data
feature using GLCM method and Backpropagation as
the classification method with accuracy was 76.6%
and the accuracy have been increased due to GLCM
method. Using the same classification method and
using DR data from DIARETDB1, Hashim &
Hashim (2014) resulted accuracy occurred about
71.94%. Based on the previous research, GLCM
method was chosen as feature extraction and SVM
method as classification and it can obtain optimal
accuracy and the purpose of this study is to assist the
medical check to determine the severity of the DR
easily and can perform treatment effectively.
2 LITERATURE REVIEW
2.1 Diabetes Mellitus
Diabetes mellitus is a long-term illness because it can
provide both physical and psychological changes.
Many factors that make a person infected with
diabetes include external factors and internal factors.
Heredity is one of a factor to infected with this disease
and for external factors are usually influenced by the
lifestyle of an individual (Kosti & Kanakari, 2012).
Although diabetes mellitus is one of 4 most deadly
diseases, but the disease is not infectious. Diabetes
mellitus caused by high blood glucose levels because
the pancreas in the body cannot produce enough of
the hormone insulin (Li et al., 2015).
2.2 Diabetic Retinopathy
Diabetic retinopathy is a complication of diabetes that
attacks the eyes because glucose levels in the nerves
of the eye increases, causing blood vessels in eyes
that are sensitive to damaged light. Damaged blood
vessels cause the DR patient in vision problem and
DR is the main cause of blindness in adults
(Neuwirth, 1988). DR is divided into 2 categories,
such as NPDR and PDR. NPDR is a DR in the
presence of microaneurysms, hemorrhages, hard
exudates, cotton wool spots, or venous loops in the
retina of the eye. PDR is characterized by the
presence of new abnormal blood vaselin optic disk,
that condition called neovascularization (Vishali
Gupta, Amod Gupta, M. R. Dogra, 2013).
2.3 Microaneurysms
Microaneurysms is an early sign of DR infection
caused by elevated glucose levels in eyes that cause
blood clots in blood vessel. Microaneurysms are
marked with small red dots located on the edge of the
eye nerve. Microaneurysms have 1/12 size of optical
disk diameter is about 25-100 micron (Vishali Gupta,
Amod Gupta, M. R. Dogra, 2013; Hsu et al., 2005).
2.4 Hemorrhages
Diabetes mellitus can attack blood vessel more fragile
and easily damaged and that can be exposed to minor
injuries will give a large impact injury. Diabetes
makes the blood sugar levels rise can cause injury to
the wound, it called hemorrhages. Bleeding can also
arise due to damaged microaneurysms so that virgin
can flow out of the eye nerve (Vishali Gupta, Amod
Diabetic Retinopathy: Identification and Classification using Different Kernel on Support Vector Machine
73
Gupta, M. R. Dogra, 2013; Cunha-Vaz & Bernardes,
2005).
2.5 Color Fundus Image
Fundus image is an image with the spatial resolution
that has enhanced the brightness and contrast, it can
identify any information from that image. The eye
image has a small brightness level, since the required
fundus image can be identified (Hubbard, 2009).
2.6 Gray Level Co-occurrence Matrix
Gray Level Co-occurrence Matrix (GLCM) is a
feature extraction method of grayscale images.
GLCM is very often used as a texture extraction of
images because GLCM takes into intensity and
brightness of the image, that texture can be clearly
recognized. The matrix generated by GLCM is a
matrix whose rows and columns are same and can be
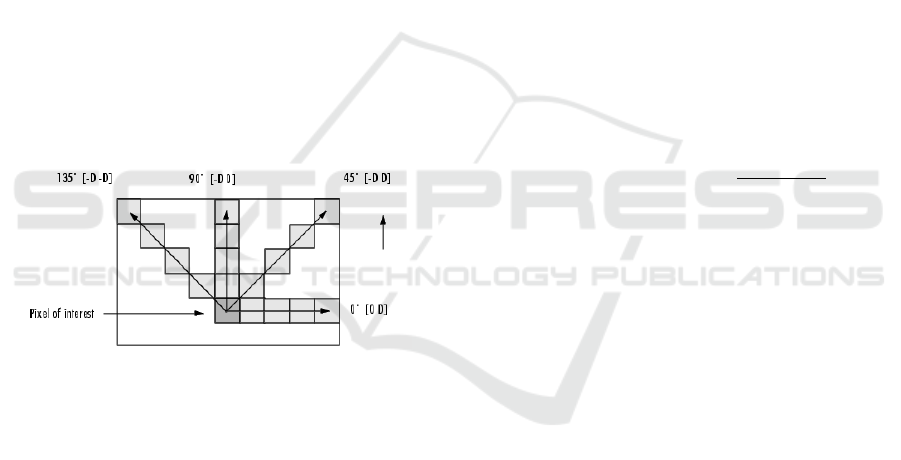
called square matrix (Öztürk & Akdemir, 2018). In
the GLCM method there are 4 different offsets. That
offset can be used as follows {[0 1] for 0
o
, [-1 1] for
45
o
, [-1 0] for 90
o
, and [-1 -1] for 135
o
}. GLCM
offsets direction can be seen in figure 1.
Figure 1: GLCM offsets direction.
For each offset for feature extraction also give a
different result (Pathak & Barooah, 2013). The
feature extraction data generated by GLCM are
contrast, homogeneity, entropy, energy, and
correlation. Let represent images of size
and that have pixels with L levels and r is the
direction vector of spatial offset.
is a GLCM
function and defined by the number of pixels
occurring at offset r to pixel and where the offset r
can be an angle or distance, and
. GLCM function can be seen in equation (1).
(1)
2.6.1 Contrast
Contrast is the ratio of the brightness intensity
between pixel of that image. That result of the image
is good if that have a high brightness intensity(A,
Suresh & Shunmuganathan, 2012). Contrast can be
obtained with equation (2).
(2)
where is matriks co-occurrence,
and .
2.6.2 Homogeneity
Homogeneity is a value from the level of uniformity
at the local gray level. Homogeneity is can be called
Inverse Difference Moment (IDM). Homogeneity is
inversely proportional to the value of contrast and
high contrast value have low homogeneity
(Mohanaiah et al., 2013). The homogeneity equation
can be seen in equation (3).
(3)
2.6.3 Entropy
Entropy can be used to search for information on
images and the results obtained based on the amount
of missing information present in the image
(Mohanaiah et al., 2013). The entropy equation can
be seen in equation (4).
(4)
2.6.4 Energy
Energy is the uniformity of co-occurrence matrix.
This energy can also be called Angular Second
Moment (ASM) (Mohanaiah et al., 2013). The
energy equation can be seen in equation (5).
.
(5)
ICMIs 2018 - International Conference on Mathematics and Islam
74

2.6.5 Correlation
Correlations are used to measure the degree of
interconnectedness or dependency between pixels
and other pixels (Mohanaiah et al., 2013). The
correlation equation can be seen in equation (6).
(6)
where
(7)
(8)
(9)
(10)
2.7 Support Vector Machine
Support Vector Machine (SVM) is a classification
method that find the best hyperplane and the results
obtained optimal classification. The hyperplane is the
dividing line between the first class with the other
class. The SVM method can specify two types of data
sets, such as linear and non-linear data. Based on the
target classification result, SVM is divided into
Binary Classification and Multiclass Classification
(Ahuja & Yadav, 2012). SVM also have a kernel to
transformation that input data and it can be used in the
Lagrange equation in the SVM process. There are 4
kinds of kernels in SVM and MATLAB, such as
linear, quadratic, polynomial, and Gaussian. For
kernel equation can be shown on equation11, 12, 13,
and 14.
(11)
(12)
(13)
(14)
2.7.1 Binary Classification
SVM binary classification that class will be set to
only 2 classes and the hyperplane will be split up
clearly into two parts that match the target
classification. SVM occurs the data close to
hyperplane called support vector data. That research
used binary classifications such as fingerprint
recognition, data matching that have yes or no results,
and more (Ahuja & Yadav, 2012).
2.7.2 Multiclass Classification
Basically, SVM is created with binary classification.
However, since many cases classify more than 2
classes, SVM must upgrade to allow for the
classification of more than 2 classes called multiclass
SVM. In multiclass SVM is divided into 2 different
classification models. Indirect classification is one of
the SVM multiclass models. In indirect classification,
the way to do is to divide the 2 classes which are then
taken one class and classified again into 2 classes.
The second is direct classification which directly
divides into many required classes (Ahuja & Yadav,
2012).
3 RESEARCH METHOD
This research is categorized as quantitative study.
Based on its function, this research serves to help to
accelerate in introducing DR process, so that the
treatment can be done optimally without any
diagnostic errors.
Color fundus image data of diabetic retinopathy is
obtained from DIARETDB and it is validated by an
ophthalmologist in Dr. Soetomo Hospital Indonesia.
The data which is used in the classification is divided
into training and testing. The Ratio of data that used
in training and testing is 60%:40%; 70%:30%;
80%:20%. The diagram of the DR classification
process can be shown in the flowchart in figure 2.
The steps of the DR identification and
classification process include pre-processing, feature
extraction, and SVM Classifier. Pre-processing is
useful to process the images and the images can be
used for the feature extraction process by using
GLCM which result is to the input of SVM
classification.
Diabetic Retinopathy: Identification and Classification using Different Kernel on Support Vector Machine
75
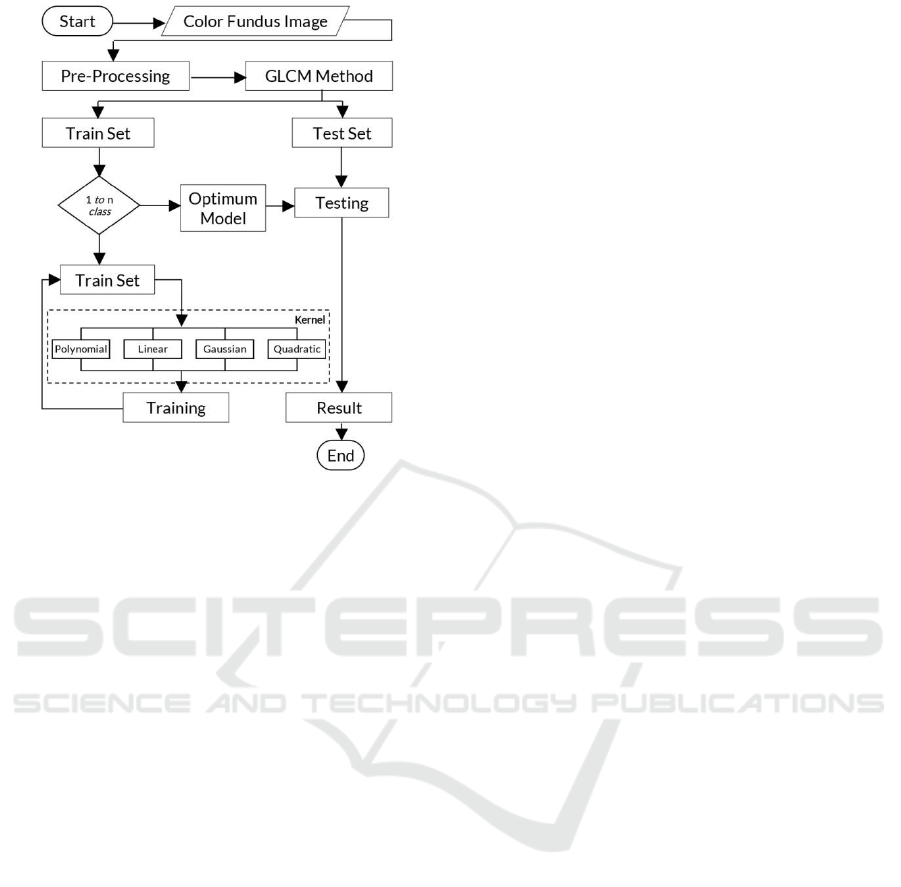
Figure 2: flowchart for DR identification.
In primary data, the color fundus image can’t be
directly identified by the DR component. And for the
statistical data from the feature extraction must also
go through a process called pre-processing. The
maximum results can be obtained with high accuracy.
The steps which are taken during the pre-processing
stage are green channel extraction, histogram
equalization, optical disk elimination, filtering, and
contrast enhancement. Form of image grayscale that
contains clearly images of blood vessel,
microaneurysms, and hemorrhages is obtained from
the results of pre-processing. Therefore, after this
process, it will proceed to the feature extraction
process.
The feature extraction process uses the GLCM
method. This method extracts features of grayscale
images in the form of the statistical data required for
classification. In GLCM, the data taken is contrast,
correlation, homogeneity, and energy using the
default offset of {[0 1] for 0
o
, [-1 1] for 45
o
, [-1 0] for
90
o
, and [-1 -1] for 135
o
}. The researcher takes only
contrast, correlation, homogeneity, and energy as the
data because MATLAB can only extract the 4
characteristics above. This data will be used as input
matrix for classification by using SVM method.
Furthermore, the feature extraction results are
used as input from the SVM classifier. In this case,
the Multiclass SVM is used for more than two
classification classes, so the regular SVM cannot be
used. There have a training and testing in
classification process which each process has slightly
different steps. In the training process, it will be used
data that has been prepared. Then, the data will be
transformed with kernel. Those are polynomial,
gaussian, linear, quadratic. The kernel is used in
conformity with feature extraction data. The
transformed data will be classified on the SVM
multiclass, so that the optimum hyperplane is divided
into 3 classification classes. The optimum model is
then simulated with the test feature matrix from the
feature extraction result. The simulation result is the
result of the classification which is then compared
with the actual test data.
4 RESULT AND DISCUSSION
The process to identify and classify the DR consists
of pre-processing which aims to process images to
obtain appropriate information, GLCM which is to
obtain feature extraction matrices used in
classification inputs, and Multiclass SVM as a means
of classifying DR with normal classes, NPDR, and
PDR.
Before doing the classification process, a pre-
processing process is needed to eliminate
unnecessary information. So, it can produce more
accurate calcification data. In pre-processing, the
researcher conducts green channel extraction,
histogram equalization, optical disk removes,
filtering, and contrast enhancement process as the
final image of pre-processing to be a grayscale image.
The transformation that occurs in the pre-processing
process can be shown in figure 3.
In Figure 3(a) is a fundus image that will be used
as input data. Fundus images will pass pre-processing
steps that include green channel extraction, histogram
equalization, optical disk remove, filtering, and
contrast enhancement. The results of pre-processing
can be seen in Figure 3(b). After obtaining the final
image, it proceeds to the next process by taking of
statistical features on the picture or commonly known
as the feature extraction stage. At this feature
extraction stage, the researcher uses GLCM method
which takes texture analysis in the form of contrast,
correlation, energy, entropy, and homogeneity.
However, this paper statistics takes only contrast,
correlation, energy, and homogeneity. At this stage,
the data is taken using the degree of neighborliness
0
o
, 45
o
, 90
o
, and 135
o
. In Table 1, there is a feature
extraction sample with 3 data as an example with all
available degree of buffering.
ICMIs 2018 - International Conference on Mathematics and Islam
76
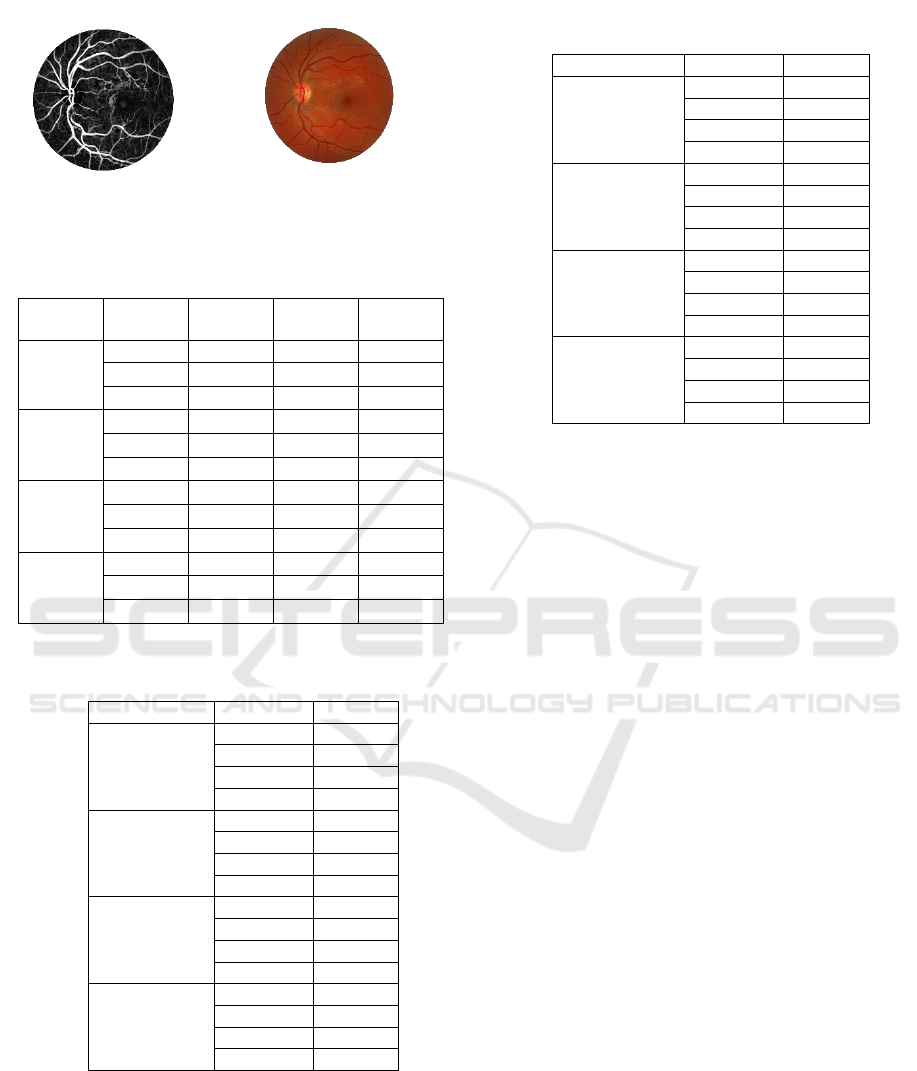
(a) (b)
Figure 3: (a) color fundus image, (b) pre-processing result.
Table 1: Sample of extraction feature data.
Degree
Homo-
geneity
Contrast
Energy
Correlat
ion
0
o
0.26365
0.90901
0.58194
0.93756
0.23801
0.92797
0.59734
0.94336
0.24239
0.90892
0.59127
0.94239
45
o
0.40921
0.85893
0.56370
0.92059
0.37720
0.88605
0.58147
0.92699
0.37199
0.86048
0.57366
0.92505
90
o
0.27090
0.90649
0.58400
0.93874
0.23146
0.92999
0.59799
0.94301
0.22589
0.91517
0.59265
0.94347
135
o
0.44639
0.84611
0.56299
0.91938
0.38232
0.88450
0.58190
0.92668
0.37240
0.86033
0.57519
0.92699
Table 2: Result of Classification 60% training data and 40%
testing data.
Kernel
Degree
Ac
Polynomial
0
o
90.91%
45
o
63.63%
90
o
59.09%
135
o
77.27%
Gaussian
0
o
63.64%
45
o
68.18%
90
o
59.09%
135
o
63.63%
Linear
0
o
22.72%
45
o
27.27%
90
o
27.27%
135
o
27.27%
Quadratic
0
o
72.72%
45
o
54.54%
90
o
68.18%
135
o
63.64%
Table 3: Result of Classification 70% training data and 30%
testing data.
Kernel
Degree
Ac
Polynomial
0
o
88.89%
45
o
44.44%
90
o
66.67%
135
o
55.56%
Gaussian
0
o
55.56%
45
o
66.67%
90
o
61.11%
135
o
55.56%
Linear
0
o
55.56%
45
o
61.11%
90
o
61.11%
135
o
66.67%
Quadratic
0
o
66.67%
45
o
66.67%
90
o
66.67%
135
o
61.11%
The extraction feature data used as input for
classification. In the classification process, there is a
process of training and testing. In this study, the ratio
of training data and testing data used were 60%:40%;
70%:30%; 80%:20%. The results of classification
will show the accuracy (Ac), which is obtained by
using the method of recognition rate. The results of
classification on each ratio of data sharing can be
shown on table 2, table 3 and table 4.
Based on table 2, it showed that the maximum
results are obtained in the polynomial kernel with
statistical data obtained from GLCM at 0
o
degree. In
the polynomial kernel, there is a very high accuracy
value, this is caused by the characteristics of feature
extraction data in the form of polynomial data. So, it
has a high accuracy of 90.91%when doing SVM
classification by using polynomial kernel. That result
is the best result from this research.
Based on table 3, it showed that best accuracy
result is 88.89% on polynomial kernel. From the
result the data is not because of that characteristic of
feature extraction data not representative that classify.
Based on table 4, that have decrease accuracy. The
best accuracy is 80% that caused by the lack of data
and doesn’t have perfectly representative the data.
The best result in this research is on 60% training
data, 40% testing data, polynomial kernel, and 0
o
degree with 90.91% accuracy.
Diabetic Retinopathy: Identification and Classification using Different Kernel on Support Vector Machine
77
Table 4: Result of Classification 80% data training and 20%
testing data.
Kernel
Degree
Ac
Polynomial
0
o
80%
45
o
60%
90
o
60%
135
o
60%
Gaussian
0
o
50%
45
o
60%
90
o
50%
135
o
60%
Linear
0
o
70%
45
o
70%
90
o
70%
135
o
70%
Quadratic
0
o
60%
45
o
50%
90
o
50%
135
o
50%
5 CONCLUSIONS
From the results above, it can be concluded that
kernel polynomial is the best kernel for data DR,
because it states 90.91% accuracy from the process of
each image in classification. The results of research
concluded that the data used DR is the type of data
polynomial due to the match with the polynomial
kernel.
REFERENCES
Ahuja, Y., & Yadav, S. K., 2012. Multiclass Classification
and Support Vector Machine. Global Journal of
Computer Science and Technology Interdisciplinary,
12(11), 15–19. Retrieved from https://globaljournals.
org/GJCST_Volume12/2-Multiclass-Classification-
and.pdf, accessed on November 1, 2018).
Anthony, G., Greg, H., & Tshilidzi, M., 2007).
Classification of images using Support Vector
Machines. Retrieved from https://arxiv.org/ftp/arxiv/
papers/0709/0709.3967.pdf, accessed on November 1,
2018.
Aravind, C., PonniBala, M., & Vijayachitra, S., 2013.
Automatic Detection of Microaneurysms and
Classification of Diabetic Retinopathy Images using
SVM Technique. International Journal of Computer
Applications (0975-8889). International Conference on
Innovations in Intelligent Instrumentation, Optimization
and Signal Processing (ICIIIOSP), 18–22.
Cunha-Vaz, J., & Bernardes, R., 2005. Nonproliferative
retinopathy in diabetes type 2. Initial stages and
characterization of phenotypes. Progress in Retinal and
Eye Research 24, 355–377. https://doi.org/10.1016/j.
preteyeres.2004.07.004.
Gori, N., Kadakia, H., Kashid, V., & Hatode, P., 2017.
Detection and Analysis of Microanuerysm in Diabetic
Retinopathy using Fundus Image Processing.
International Journal of Advance Research, Ideas and
Innovations in Technology (IJARIIT), 3(2), 907–911.
Gupta, V., Gupta, A., Dogra, M. R., Singh, R., 2013.
Diabetic Retinopathy Atlas 1
st
Edition. New York: MC
Graw Hill Medical.
Hashim, M. F. & Hashim, S. Z. M., 2014. Diabetic
retinopathy lesion detection using region-based
approach. 2014 8th Malaysian Software Engineering
Conference, MySEC, 306–310. https://doi.org/10.1109/
MySec.2014.6986034.
Herrera, L. J., Rojas, I., Pomares, H., Guillén, A.,
Valenzuela, O., & Banos, O., 2013. Classification of
MRI Images for Alzheimer’s Disease Detection. 2013
International Conference on Social Computing, 846–
851. https://doi.org/10.1109/SocialCom.2013.127
Hsu, W., Lee, M. L., Pallawala P. M. and Goh, S. S., 2005.
Automated Microaneurysm Segmentation and Detection
using Generalized Eigenvectors. Applications of
Computer Vision and the IEEE Workshop on Motion and
Video Computing, IEEE Workshop on (WACV-
MOTION), Breckenridge, Colorado, pp. 322-327.
doi:10.1109/ACVMOT.2005.26.
Hubbard, L. D., 2009. Digital Color Fundus Image Quality :
The Impact of Tonal Resolution. The Journal of
Ophthalmic Photography, 31(1), 15–20.
Kosti, M., & Kanakari, M. (2012). Education and diabetes
mellitus. Health Science Journal, 6(4), 654–662.
Li, S., Guo, S., He, F., Zhang, M., He, J., Yan, Y., Ding, Y.,
Zhang, J., Liu, J., Guo, H., Xu, S., & Ma, R., 2015.
Prevalence of diabetes mellitus and impaired fasting
glucose, associated with risk factors in Rural Kazakh
adults in Xinjiang, China. International Journal of
Environmental Research and Public Health, 12(1),
554–565. https://doi.org/10.3390/ijerph120100554.
Maule, P., Shete, A., Wani, K., Dawange, A., & Shinde, J.
V., 2016. GLCM feature extraction in Retinal Image.
International Journal of Advanced Research in Science
Management and Technology (IJARSMT) 2(4), 1–8.
Minajagi, P., & Mashal, M., 2015. Automated Detection of
Diabetic Retinopathy. International Journal of
Emerging Technology in Computer Science &
Electronics (IJETCSE) 14(2), 621–626.
Mohanaiah, P., Sathyanarayana, P., & Gurukumar, L.,
2013. Image Texture Feature Extraction Using GLCM
Approach. International Journal of Scientific &
Research Publication, 3(5), 1–5. https://doi.org/10.1.1.
414.96981.
Neuwirth, J., 1988. Diabetic retinopathy: what you should
know. Connecticut Medicine, 52(6), 361.
Novitasari, D. C. R., 2016. Sistem Diagnosis dan Deteksi
Dini Pencegahan Kebutaan pada Pasien Diabet
Berdasarkan Tingkat Stadium Diabetic Retinopathy.
Unpublished. UIN Sunan Ampel, Surabaya.
Öztürk, Ş., & Akdemir, B., 2018. Application of Feature
Extraction and Classification Methods for
ICMIs 2018 - International Conference on Mathematics and Islam
78

Histopathological Image using GLCM, LBP,
LBGLCM, GLRLM and SFTA. Procedia Computer
Science, 132, 40–46. https://doi.org/10.1016/j.procs.
2018.05.057.
Pathak, B., & Barooah, D., 2013. Texture analysis based on
the gray-level co-occurence martix considering
possible orientations. International Journal of
Advanced Research in Electrical, Electronics and
Instrumentation Engineering, 2(9), 4206–4212.
Retrieved from http://www.ijareeie.com/ upload/2013/
september/7_-TEXTURE.pdf.
Sopharak, A., Uyyanonvara, B., Barman, S., & Williamson,
T. H., 2008. Automatic detection of diabetic
retinopathy exudates from non-dilated retinal images
using mathematical morphology methods.
Computerized Medical Imaging and Graphics, 32(8),
720–727. https://doi.org/10.1016/j.compmedimag.
2008.08.009
Suresh, A. & Shunmuganathan, K. L., 2012. An Efficient
Texture Classification System Based on Gray Level
Co- Occurrence Matrix. International Journal of
Computer Science and Information Technology &
Security (IJCSITS), 2(4), 793–798.
Yau, J. W. Y., Rogers, S. L., Kawasaki, R., Lamoureux, E.
L., Kowalski, J. W., Bek, T., … Wong, T. Y., 2012.
Global Prevalence and Major Risk Factors of Diabetic
Retinopathy. Diabetes Care, 35(March), 556–564,
https://doi.org/10.2337/dc11-1909.
Yun, W. L., Acharya, U. R., Venkatesh, Y. V., Chee, C.,
Min, L. C. & Ng, E. Y. K., 2008. Identification of
different stages of diabetic retinopathy using retinal
optical images. Information Sciences, 178(1), 106–121.
https://doi.org/10.1016/j.ins.2007.07.020.
Diabetic Retinopathy: Identification and Classification using Different Kernel on Support Vector Machine
79
