
The Analysis of Workforce Absorption in Food Industry of South
Sumatera
Dirta Pratama Atiyatna, Mukhlis Mukhlis, Rosmiyati Chodijah
Department of Economic Development, Faculty of Economics, Universitas Sriwijaya
dirtapratama, mukhlis
@fe.unsri.ac.id
Keywords: Workforce Absorption, Food Industry, Capital, Wages, and Production Value
Abstract: This study aims to look at the workforce absorption in food industry of South Sumatra. This study looks at
whether there is an effect of capital on workforce absorption of the food industry in South Sumatra, the effect
of wages on workforce absorption of the food industry in South Sumatra and the effect of the production value
on workforce absorption of the food industry in South Sumatra. The results of the multiple regression equation
show that the beta value of the capital variable is 6.75, this shows that in this study, capital has a positive
relationship to the dependent variable, this positive relationship shows that capital in the food industry
business has a positive influence on the workforce absorption. For the wage variable has a positive relationship
of 1.70, this shows that the wage variable affects the workforce absorption of food industry in South Sumatra.
Whereas for the Production Value variable shows the beta value of 7.18, which means that the production
value positively affected on the workforce absorption of food industry in South Sumatra where each increase
in production value of 1 percent will be followed by an increase in workforce absorption of 1 percent.
1 INTRODUCTION
Economic growth and development is a process
where the government and the private sector manage
existing resources and form a pattern of partnership
between the government and the private sector to
create new jobs and stimulate the development of
economic activities. The main problem of economic
growth and development lies in emphasizing
economic growth and development policies based on
the specificity of each region by using the potential of
human resources, institutional and physical resources
locally. This orientation uses initiatives which arise
from the area in economic growth and development
process to create employment opportunities and
stimulate an increase in economic activities
(Badrudin, 2012: 113).
According to Arsyad (2010: 442), the industrial
sector acts as the leading sector. With the
development of the industrial sector, it will spur and
encourage the development of other sectors, such as
the agricultural and service sector, so that it will cause
widespread employment opportunities which will
increase society income and purchasing power. The
increase in income and purchasing power of the
society shows that the economy is growing rapidly.
The industrialization process is also inseparable
from efforts to improve the quality of human
resources and their ability to use the natural resources
and other resources optimally. This also means that
industrialization is an effort to increase the
productivity of human resources accompanied by
efforts to expand the scope of human activities. Thus
the industrialization process can be pursued with two
paths at once, that is vertically indicated by the
increasing of value added to economic activities and
horizontally indicated by the increasingly widespread
of productive employment which available to the
population (Arsyad, 2010: 442).
Human resources contain two meanings. First,
human resources (HR) contain the definition of work
or service that can be provided in the production
process. In this case, the HR reflects the business
quality given by a person within a certain time to
produce goods and services. The second meaning of
human resources involves the ability of humans to
work for providing services or work. Physically, the
ability to work is measured by age. In other words,
people of working age are considered capable to
work. The population group in the working age is
called labor or manpower (Simanjuntak, 1985: 1).
According to Irawan and Suparmoko (2008: 86)
human resources have two roles in economic
Pratama Atiyatna, D., Mukhlis, . and Chodijah, R.
The Analysis of Workforce Absorption in Food Industry of South Sumatera.
DOI: 10.5220/0008443906770684
In Proceedings of the 4th Sriwijaya Economics, Accounting, and Business Conference (SEABC 2018), pages 677-684
ISBN: 978-989-758-387-2
Copyright
c
2019 by SCITEPRESS – Science and Technology Publications, Lda. All rights reserved
677
development, one in terms of demand and one in
terms of supply. In terms of demand, human
resources act as consumers to meet their needs.
Households as consumers buy goods and services
from the company and in return, households will pay
the price to the company. Consumers can also play a
role as providers of production factors (land, labor
and capital), both for producers, government and
foreign communities. In terms of supply, human
resources act as producers. Producers are parties that
process and provide goods or services needed by
consumers. To run the process of producing goods
and services, companies use labor originating from
households and in return the company provides
income in form of wages.
Labor is the ability of humans to spend effort each
time unit to produce goods and services, both for
themselves and for others. In the production process ,
labors combined with other factors to produce goods
and services. The occurrence of the production
process will create employment opportunities and the
use of labor (Suroto, 1992: 53).
Table 2.1: Number of Small Industry Company, Workforce, Wage, andProduction Value in Palembang 2017
Business Types
Number of
Company
Number of
Workforce
Production Value
(
Rp)
Food
539
5,308
186,507,640
Clothes and Skins
301
3,604
13,771,640
Chemical andBuilding Material
681
4,495
48,640,378
Metals and Services
615
3,768
19,146,232
Crafts and General
147
1,523
5,790,494
Source: Trade, Industry and Cooperative Office, 2017 (processed)
Based on the table above, the number of workers
in Small and Medium Industries in Palembang on
2016 was recorded at 18,698 workers. The high
number of workers absorbed is affected by the large
number of companies. Besides the number of
companies, other factors which affect the number of
workers are high wage and production levels.
Whereas, from five types of businesses it was noted
that the type of food business that absorbed the most
workforce was 5,308 thousand workers. The large
amount of workforce absorbed is affected by the large
number of companies, high wage rates and output
values. While Crafts and General have the lowest
amount of workforce. Factors affecting the low
number of workers are the low number of companies
and the low amount of production. Based on the
description above, the researcher is interested to
conduct the study entitled "Analysis of Workforce
Absorption in Food Industry of South Sumatra"
2 LITERATURE REVIEW
2.1 Labor Market
According to classical theory, if the price of labor
(wages) is also quite flexible, the demand for labor
is always balanced with the supply of labor. There is
no possibility of voluntary unemployment, means
that the real wage level that applies in the labor
market, all people who are willing to work at the
level of wages will get a job. Those who are
unemployed are only those who are not willing to
work at the prevailing wage rate (voluntary
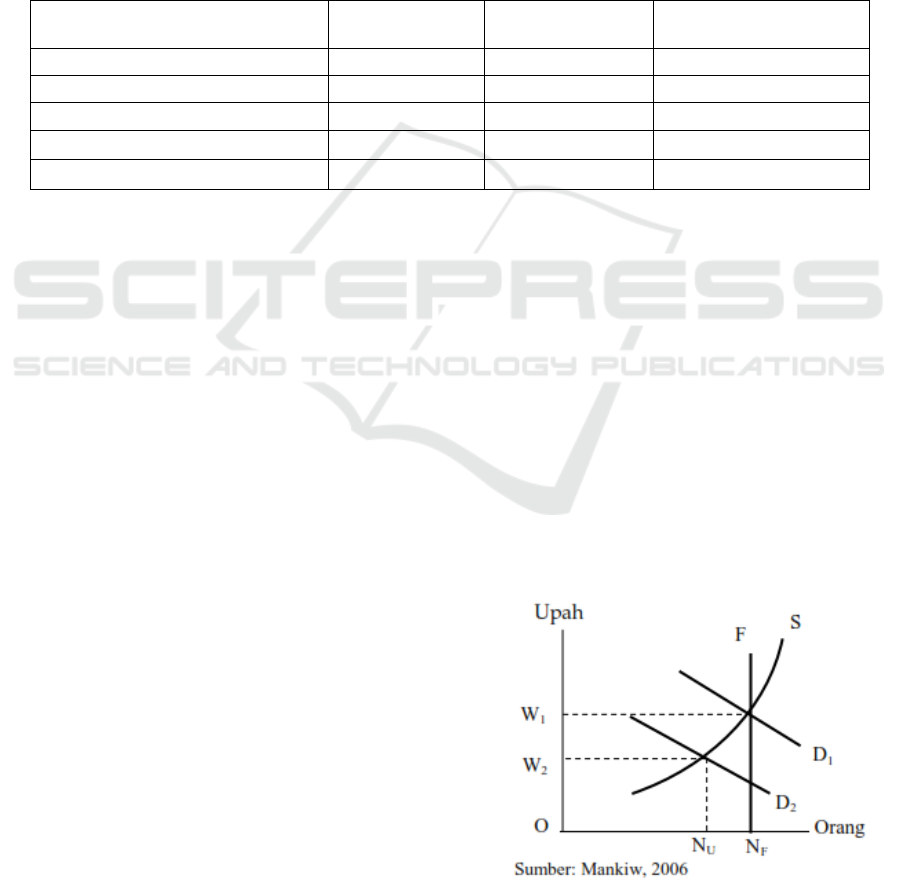
unemployed). The process of labor demand and
supply in the labor market is presented in Figure
The vertical axis shows the real wages level, the
horizontal axis shows the number of people working
in a community. D1 is the demand curve for labor
(total of needs by producers and government). S is a
labor supply curve that shows how many people are
willing to work at various levels of real wages. F
shows the number of workforce, that is, all people
who are able and willing to work.
Figure 1:
Classic Theory:Workforce Market
SEABC 2018 - 4th Sriwijaya Economics, Accounting, and Business Conference
678

In this position, the economy is at full
employment, where the entire workforce that is
willing to work can work. If at one time the producer
reduces its production (because many goods have
not been sold), then the demand curve for labor will
shift to the left to D2. The prevailing wage rate
dropped from w1 to w2, and the number of people
working dropped from the NF to NU. NF minus NU
is the number of people who do not work, and they
are voluntarily unemployed because they do not
want to work at the new wage level (w2). If the
prices of goods have adjusted to each other then all
goods will be sold and the production level becomes
"normal" again, so that D2 shifts back to D1. As a
result, the full employment position is achieved
again, and once again everybody who in the
workforce can work, at the level of the old real wage
(w1).
2.2 Demand for Labor
The production function can describe a
combination of inputs, and describe the technology
used by companies to produce goods and services.
For simplification of analysis, we make the
assumption that in producing goods and services,
the company uses two types of production factors,
i.e the amount of labor (L) and capital (K). So that
the production function can be written as:
Q = f (L, K)
Where Q is output. The company's demand for
input is derived demand, meaning that the
company's demand for labor and capital is
determined by consumer demand on the company's
products. If the demand for company's output is
large, then the possibility of demand for labor and
capital is also large. That is due to entrepreneurs
produce because they want to fulfill consumer
demand.
The main purpose of a company in general is to
maximize profit. Profit is obtained from the
difference in income minus costs. Costs incurred by
the company include capital costs and labor costs. In
relation to the use of labor, companies will make
choices about the use of labor. The company will try
to use an optimal number of workforce. In relation
to the demand concept, the demand for labor is
defined as the number of labor demanded by the
company in various kinds of labor prices or various
wage levels alternative.
Demand labor means that the relationship
between the level of wages and the quantity of labor
which desired by enterpreneur to be employed, it's
different with consumer demand for goods and
services. People buy goods because they provide
utility to the buyer. While entrepreneurs employ
someone because they produce goods for sale to the
consumer. Therefore, an increase in the demand of
enterpreneurs on labor, depends on the increase in
public demand for the goods they produce. Such
demand for labor is called "derived demand"
(Simanjuntak, 2002). Demand for labor is affected
by changes in wage levels and changes in other
factors that affect demand for production
(Ehrenberg, 1988):
1. Changes in Wage Levels
Changes in wage level will affect the high and
low production cost of the company. If the
assumption is used that the wage level rises, it will
occur:
a. Rising wage rates will increase the company's
production costs,
b. If wages increase, entrepreneurs who prefer to
use capital-intensive technology for their
production process and replace the need for
labor with the need for capital goods such as
machinery and others.
2. Other Factors that Affect Demand for Labor
These factors include:
a. Up and down market demand for the production
of the company concerned.
b. Price of Capital Goods. If the price of capital
goods decreases, then the cost of production
falls, of course, will also cause the selling price
per unit of goods to decrease.
Enterpreneurs must make input choices (workers
and other inputs) and outputs (types and quantities)
with the right combination in order to obtain
maximum profit. In order to achieve maximum
profit, the entrepreneurs will choose or use input
which will provide additional revenue that is greater
than the addition on total revenue costs. Companies
often make various adjustments to change input
combinations. Demand for labors is a list of various
alternative combinations of workers with other
inputs. In this analysis, it is assumed that the
company sells output that is truly competitive and
buys inputs in a truly competitive market.
2.3 Wages Againts Workforce
Absorption
Wages are receipts as compensation from the
employer to the worker for the work or service which
has been or will be carried out. Functioning as a
The Analysis of Workforce Absorption in Food Industry of South Sumatera
679

continuation of life that is worthy for humanity and
production, expressed or assessed in a form which is
determined according to agreements, laws and
regulations, and is paid on the basis of a work
agreement between the employer and the worker.
Similar opinion was expressed by (Kuncoro,
2002), where the quantity of labor demanded would
decrease as a result of wage increases. If the wage rate
rises while other input prices remain, then the price of
labor is relatively more expensive than other inputs.
This situation encourages enterpreneurs to reduce the
use of labor which is relatively expensive with other
inputs which are relatively cheaper in price to
maintain maximum profits.
The wage function generally consists of: 1. To
efficiently allocate human work, use human resources
efficiently, to encourage stability and economic
growth. 2. To efficiently allocate human resources,
Compensation system is to attract and stir the
workforce in a productive direction, encouraging
productive workforce to work more productive. 3. To
use human resources efficiently, the relatively high
compensation is to encourage management to utilize
labor economically and efficiently. In this way
entrepreneurs can get profit from the use of labor.
Labors get compensation based on their needs. 4.
Encouraging economic stability and growth due to
efficient allocation of labor usage, a compensation
system is expected to stimulate, maintain stability and
economic growth.
2.4 Labor Productivity Against
Workforce Absorption
Labor planning is all effort to know and measure
labor and employment opportunities issues in one
labor market area which occurs in the present and
future, and formulate business policies and
appropriate and coherent steps to overcome them
(Ravianto, 1989). Based on this definition, the labor
planning process in its outline consists of two parts.
The first is an effort to find and measure the
magnitude of employment opportunities and
employment problems that occur at present and in the
future. The second is the formulation of business
policies and appropriate and coherent steps.
According to Mulyadi (2012) states that
productivity is a universal concept which aims to
provide more goods and services to more people by
using fewer real resources with company products so
that they are associated with employee skills.
From this description, in other words,
productivity is a measure of productive efficiency, a
comparison between output and input. Input is often
limited by labor input, while output is measured by
physical units, forms or values (Ravianto, 1989).
Labor productivity is a picture of the workers
ability to produce output (Ananta, 1995) This is
because productivity is the result obtained by a
production unit with the amount of labor owned, with
high work productivity shows the ability possessed by
labor is also high. Productivity contains operational
philosophical-qualitative and operational technical-
quantitative. In Philosophical-qualitative,
productivity contains a life view and mental attitude
that seeks to improve the quality of life. Today's
situation must be better than yesterday, and
tomorrow's quality of life must be better than today.
For a quantitative working definition,
productivity is a comparison between the results
achieved (output) and the overall resources (input)
used per unit of time (Payaman Simanjutak, 1985).
Productivity can also be defined as a comparison
between the results of work that has been achieved
with the overall resources used in a given time. The
unit of measure is a number that shows the ratio
between output and input. Increased productivity
means that workers can produce more in the same
period of time, or a certain level of production can be
produced in a shorter time.
2.5 Capital Against Workforce
Absorption
Capital is a substitution of labor. This is based on
the production function that is Q = f (K, L, R, T)
where K is the amount of capital stock, L is the
amount of labor and this includes various types of
labor and entrepreneurial expertise, R is natural
resources, and T is the level of technology used.
While Q is the amount of production produced by
various types of production factors, that is jointly
used to produce goods which are being analyzed for
their nature of production. For one certain production
level, a combination of different production factors
can be used. (Sukirno, 2015).
Capital can be used to enlarge a company or
establish a new business. The new business can be an
extension of the old business. Addition of capital on
each industry will be able to increase raw materials or
can develop a business (increase the number of
businesses). As more businesses that are developing,
it will be able to absorb a lot of workforce (Zamrowi,
2007).
According to Haryani (2002), in practice the
production factors both human resources and non-
human resources such as capital cannot be separated
in producing goods or services. In an industry,
SEABC 2018 - 4th Sriwijaya Economics, Accounting, and Business Conference
680

assuming other production factors are constant, the
greater the invested capital, the greater the demand
for labor.
2.6
Conceptual Framework
The development of the Food industry sector in
South Sumatra, especially small industries, is
expected to have a positive impact, i.e it can absorb
a large workforce. Workforce absorption in small
industries internally is affected by the number of
businesses, the level of wages, and the value of
production.
Figure 2: Conceptual Framework
Small Business Capital and Production Value
can affect workforce absorption. If the addition of
capital and demand for production results of the
company or industry increases, producers tend to
increase their production capacity, so producers will
increase their use of labor. Changing wage levels
will affect employment (Simanjuntak, 1985). Rising
wage rates will increase the company's production
costs which will then increase the price per unit of
goods produced. If prices rise, consumers will
reduce consumption. So, many production of unsold
goods, and forced producers to reduce the amount of
production so that the required labor is also reduced.
3 METHODS
This study focused on the workforce absorption of
food industry in South Sumatra. The reason for
choosing the food industry sector in South Sumatra is
quite a big role in terms of absorbing workforce.
This study uses Cross Sectional Primary data,
which is obtained from various food industries in
South Sumatra such as tofu industry, tempe industry,
crackers industry and chips industry. In addition, data
was also obtained through literature studies from
various literatures in the form of textbooks, scientific
articles / journals, other sources related to the topics
discussed.
The following are the data needed in this study:
Number of Workforce working in the food industry
in South Sumatra, capital, Wages, and Production
Value in South Sumatra in 2018.
To analyze the effect of capital, wages and
production values on workforce absorption of food
industry in South Sumatra, this study uses multiple
regression analysis. Multiple regression models can
be formulated as follows:
𝒀 = 𝜶 + 𝜷
𝟏
𝑿
𝟏
+ 𝜷
𝟐
𝑿
𝟐
+ 𝜷
𝟑
𝑿
𝟑
+ 𝜺
Where:
Y : Workforce of Food Industry
α : Intersept
X
1
: Food Industry Capital
X
2
: Wages of Food Industry
X
3
: Production Value of Food
Industry
β
1,
β
2
,β
3
: Coefficient Regression from each
Coefficient
ε : Error Factor
4 FINDINGS
4.1 Respondend General Description
Table 4.1: Amount of Workforce Food Industry in South
Sumatera
Business
Amount of Workforce
Percentage
(%)
Interval
Frequency
UK
1 - 4.67
94
75.81
4.68 - 8.35
17
13.71
8.36 -
12.03
13
10.48
Total
124
100.00
Source: Field (processed)
Capital
Level of Wages
Production Value
Workforce Absorption
The Analysis of Workforce Absorption in Food Industry of South Sumatera
681

Based on the table above, it can be seen that the
food industry in South Sumatra is as much as 75
percent of the amount of workforce between 1-4.67
people per company, while as much as 10.48 percent
of the amount of workforce in the food industry in
South Sumatra between 8-12 workers in 2018. This
can mean that the food industry is still on a small
scale.
Table 4.2: Salary Expenses Food Industry in South
Sumatera
Business
Salary Expenses
Percentage
(%)
Interval
Frequency
UK
750,000 -
20,500,001
107
86.29
20,500,002 -
40,250,003
9
7.26
40,250,004 -
60,000,005
8
6.45
Total
124
100.00
Source: Field (processed)
In table 4.2. the business owners spend a portion
of the profits to pay wages to the food industry's
workforce as much as 86 percent of 750,000 -
20,500,000 per month with the composition of the
workforce between 1-4 people per month. Whereas
6.45 percent of business owners pay wages of
40,250,000 s.d. 60,000,000 for workforces between
8-13 people each month.
Table 4.3: Beginning CapitalFood Industry in South
Sumatera
Business
Beginning Capital
Percentage
(%)
Interval
Frequency
UK
180,000 -
500,120,001
112
90.32
500,120,002 -
1,000,060,003
8
6.45
1,000,060,040
-
1,500,000,005
4
3.23
Total
124
100.00
Source: Field (processed)
In average, business owner has a beginning capital
of 180,000 - 500,000,000 where 112 people or 90.32
percent are obtained from family loans, sell land and
borrow money at the bank. While 4 people or 3.23
percent of business owners have a beginning capital
of 1,000,060,040 - 1,500,000,000 where the owner of
this capital is a well-established business owner and
sells the results of the industry outside the village to
the district center.
Table 4.4: Origin of Workforce Food Industry in South
Sumatera
Business
Origin of
Workforce
Number of
Respondend
Percentage
(%)
UK
In the
village
107
86.29
Outside
the village
17
13.71
Total
124
100
Source: Field (processed)
The origin of workforce in the food industry of
South Sumatra is only detected in 2 indicators,
namely in the village and outside the village, where
the majority of workforces who come from within the
village are 86.29 percent or as many as 107
workforces, while for workforces who come from
outside the village as many as 17 people or 13.71
percent consisting of outside the village which closest
to the center of the food industry.
Table 4.5: Workforces StatusFood Industry in South
Sumatera
Business
Workforces
Status
Number of
Respondend
Percentage
(%)
UK
Family
69
55.65
Neighbor
50
40.32
Other
resident
5
4.03
Total
124
100
Source: Field (processed)
In table 4.5. comparing between a lot of workforce
from family and outside the family, based on the
results of observations in the field, it was noted that
there were 69 workforces or 55.65 percent of the
workforce who came from families and 40.32 percent
came from neighbors, while 5 workers or 4 percent of
all workforce observations whose status is other
resident outside the village.
Workforces education of food industry in South
Sumatra is dominated by elementary and junior high
school workforces as many as 99 workers or as much
as 79.84 percent, where this workforce as processing
of raw materials workforce into commodities that are
ready to sell, while as many as 20.17 percent or 25
workforces who have high school education, which is
usually a workforce who is marketed or a business
owner.
SEABC 2018 - 4th Sriwijaya Economics, Accounting, and Business Conference
682

Tabel 4.6: Workforces Education Food Industry in South
Sumatera
Business
Workforces
Education
Number if
Respondend
Percentage
(%)
UK
Elementary
School
57
45.97
Junior High
School
42
33.87
Senior High
School
21
16.94
>Senior
High
School
4
3.23
Total
124
100
Source: Field (processed)
Table 4.7: Reason for Working of WorkforcesFood
Industry in South Sumatera
Business
Reason for
Working
Number of
Respondend
Percentage
(%)
UK
Based on
Ability
15
12.10
Economic
Factor
55
44.35
Becoming
Enterpreneur
12
9.68
As Main Job
24
19.35
Increase an
Income
18
14.52
Total
124
100
Source: Field (process)
Based on the survey results in the food industry of
South Sumatra, there are various reasons why the
workforce decides to work in the food industry, where
the main reason for the workforce is the economic
factor associated with the education of workforces,
such as elementary and junior high school so that they
do not have many opportunities for work in other
money sectors. While 14.52 percent and 9.68 percent
of the workforce choose the reason to increase
income and become entrepreneurs, respondents who
choose both of these reasons were both workforces
and business owners.
4.2 The Analysis of Workforce
Absorption in Food Industry of
South Sumatera
The results of the study have obtained quantitative
data during the interview and observation process.
From the data obtained then analyzed by multiple
regression method and calculated from the three
independent variables that is Capital, Wages and
Output Value. Based on the data obtained by the
researcher, multiple regression equations can be
arranged as follows:
The results of the multiple regression equation
above show that the beta value of the capital variable
is 6.75, this shows that in this study capital has a
positive relationship to the dependent variable, this
positive relationship shows that capital in the food
industry business has a positive effect on the
workforce absorption. For the wage variable has a
positive relationship of 1.70, this shows that the wage
variable affects the workforce absorption of food
industry in South Sumatra.
Whereas for the Production Value variable shows
the beta value of 7.18, which means that the
production value has a positive effect on the
workforce absorption of food industry in South
Sumatra where each increase in production value of 1
percent will be followed by an increase in workforce
absorption of 1 percent. The result of multiple
regression estimation using statistical tools are as
shown in the table below:
Table 4.8: The Result of Multiple Regression
Variable
Variable
Value
Significance
Constant
2.078
0.000
Capital
6.750
0.652
Wage
1.700
0.000
Production
Value
7.186
0.003
R-Square : 0,439 F Value : 28.191 (sig = 0.000)
Source: Result of Data Processing
Based on the estimation table above, it obtained
that the R-Square value is 0.439, it can be concluded
that the independent variables (capital, Wages and
Production Value) against the Dependent variables
(Workforce) affect 43.9%, while 56.1 percent are
affected by the variables which was not investigated
by researchers. The capital variable does not
significantly affect the workforce absorption of food
industry with a significance level of 0.652 because the
food industry in South Sumatra is dominated by small
investors because it is only a home industry, but even
though there is no significant affect, the capital
variable still has a positive affect on workforce
absorption in food industry.
For wage variables, it significantly affected on the
workforce absorption with a significance level of
0.000 percent, meaning that wages attract workforces
Y = 2,078 + 6,75
Capital
+ 1,70
Wages
+
7,18
Production Value
The Analysis of Workforce Absorption in Food Industry of South Sumatera
683

to work in food industry. This is because the
workforce comes from the family and the majority
lived in the area around the food industry, in addition
the workforces with elementary and junior high
school education are difficult to be absorbed in the
formal sector so that a home-based Food Industry can
absorb low education workforces. Whereas the
Production Value also has a significant affect on
workforce absorption, where every increase in
production in the food industry will increase
workforce absorption as well.
From the results of the table above, it can be seen
that jointly independent variables have a significant
affect on the dependent variable. This can be proved
by looking at the significance F-value of ANOVA
table, which is equal to 0.000b or smaller than the
significance level determined by the researcher that is
0.05 or 5%, then the regression transformation model
can analyze capital, wages and production values
together affects the workforce absorption of the food
industry in South Sumatra.
5 CONCLUSION
From the results of this study, it can be concluded
that for a home-based food industry (Small industry),
the number of labors in the industry is between 1 - 5
people per industry, with a wage rate of 750,000 -
1,500,000 each month. Labors in the food industry
originate from the village where out of 124
respondent, 107 labors were obtained from the
village, with 69 families and 50 neighbors. Some
labors argue that the reason they work in the food
industry is due to economic factors, as the main job
and increasing income.
The results of the multiple regression equation
above show that the beta value of the capital variable
is 6.75, this shows that in this study, capital has a
positive relationship to the dependent variable, this
positive relationship shows that capital in the food
industry business has a positive influence on the
workforce absorption. For the wage variable has a
positive relationship of 1.70, this shows that the wage
variable affects the workforce absorption of food
industry in South Sumatra. Whereas for the
Production Value variable shows the beta value of
7.18, which means that the production value
positively affected on the workforce absorption of
food industry in South Sumatra where each increase
in production value of 1 percent will be followed by
an increase in workforce absorption of 1 percent.
REFERENCES
Ananta, Aris, 1995. Integrasi Variabel Kependudukan dan
Pembangunan; Komspe, Model dan Pengembangan,
Lembaga Demografi; FE UI. Jakarta
Arsyad,Lincoln. 2010. Ekonomi Pembangunan.
Yogyakarta: Unit Penerbit dan Percetakan STIM
YKPNYogyakarta.
Badan Pusat Statistik, 2016. Sumatera Selatan Dalam
Angka 2015. BPS Sumatera Selatan.
Badrudin, Rudi. 2012. Ekonomika Otonomi Daerah.
Yogyakarta: UPP STIM YKPN.
Dinas Perdagangan, Industri dan Koperasi, 2017, Sumatera
Selatan
Ehrenberg, Donald. 1998. Modern Labor Economics,
Theory and Public Policy. Scott Foresman and
Company Gienview, Illionis Bosto. London
Gujarati, Damodar N dan Dawn C.Porter.2012. Dasar-
Dasar Ekonometrika. Jakarta: Salemba Empat.
Haryani, Sri. 2002. Hubungan Industrial di Indonesia.
Yogyakarta: AMP YKPN
Kuncoro, Haryo, 2002. Sistem bagi Hasil dan Stabilitas
Penyerapan Tenaga kerja., Jurnal Ekonomi
Pembangunan, Vol 7 Nomor 1 :45-54
Mankiw, N.Gregory. 2006. PengantarEkonomi Mikro.
Jakarta: Salemba Empat
Mulyadi.2012. Ekonomi Sumber Daya Manusia dalam
Perspekti fPembangunan. Jakarta: PT Raja Grafindo
Persada.
Ravianto, J, 1986, Produktivitas dan Manusia Indonesia.
Jakrta. Siup
Simanjuntak, Payaman J. 1985. Pengantar Ekonomi
Sumber Daya Manusia. Jakarta: LPFE UI.
Sukirno, Sadono. 2015. Mikro Ekonomi: Teori Pengantar.
Jakarta: PT Raja Grafindo Persada
Suparmoko danIrawan.2008.Ekonomi
Pembangunan.Yoyakarta: BPFE
Suroto. 1992. Strategi Pembangunan dan
Perencanaan Kesempatan Kerja. Yogyakarta : Gadjah
MadaUniversityPress.
Zamrowi, M.Taufik. 2007. Analisis Penyerapan Tenaga
Kerja Pada Industri Kecil (Studi di Industri Kecil
Mebel di Kota Semarang). Tesis Universitas
Diponegoro.
SEABC 2018 - 4th Sriwijaya Economics, Accounting, and Business Conference
684
