
Effect of Capital Expenditure, Investments and Human Development
Index to Gross Regional Domestic Product Provinces in Sumatera-
Indonesia
Didik Susetyo, Zunaidah, Anna Yulianita and Wulan Lestari
Department of Economics Faculty, Sriwijaya University
Keywords: Capital Expenditure, Investments, Human Development Index, GRDP.
Abstract: The purpose of this study is to analyze the effect of capital expenditure, investment (domestic and foreign)
and the human development index to GDP provinces in Sumatra Island. This study uses data 2007-2016
period were sourced from the official website of each relevant institutions namely the Directorate General of
Fiscal Balance, the Central Bureau of Statistics and the Investment Coordinating Board. The analytical
method used is the panel data regression and statistical tests. Based on panel data regression test results, it is
known that the effect of capital spending, investment, and human development index to GDP province is
simultaneous positive and significant effect. While the individual test result showed that capital spending is
positive but not significant effect; the Investment is significant and positive effect; and the human
development index is positive and significant impact.
1 INTRODUCTION
1.1 Background
Among the five bigest islands in Indonesia, one
of which is the island of Sumatra. Through policies
and programs of the government, every province in
Sumatra Island continue development ranging from
repair of roads, construction of bridges, construction
of school buildings and other public facilities.
Construction of this growing encouraging increased
government spending while also attracting investors
to make investment. If the construction is already
well underway, the human development index
numbers will also increase along with the welfare of
society has also increased so that it will encourage
economic growth.
Economic growth is defined as a long-term
increase in the ability of a country to provide more
and more kinds of economic goods to its citizens,
this ability to grow in accordance with the
advancement of technology, institutional and
ideological adjustments are needed (Jhingan, 2007:
57).
The relationship between economic growth and
government spending, or more generally the size of
the public sector, is government spending can boost
economic growth in the long term (Sodik, 2007: 27).
Budget areas listed in the Regional Budget
(APBD) portrait reflect local governments to
determine priorities related to programs and
activities that will be implemented in a budget year
(DJPK, 2015).
402
Susetyo, D., Zunaidah, ., Yulianita, A. and Lestari, W.
Effect of Capital Expenditure, Investments and Human Development Index to Gross Regional Domestic Product Provinces in Sumatra-Indonesia.
DOI: 10.5220/0008440704020412
In Proceedings of the 4th Sriwijaya Economics, Accounting, and Business Conference (SEABC 2018), pages 402-412
ISBN: 978-989-758-387-2
Copyright
c
2019 by SCITEPRESS – Science and Technology Publications, Lda. All rights reserved
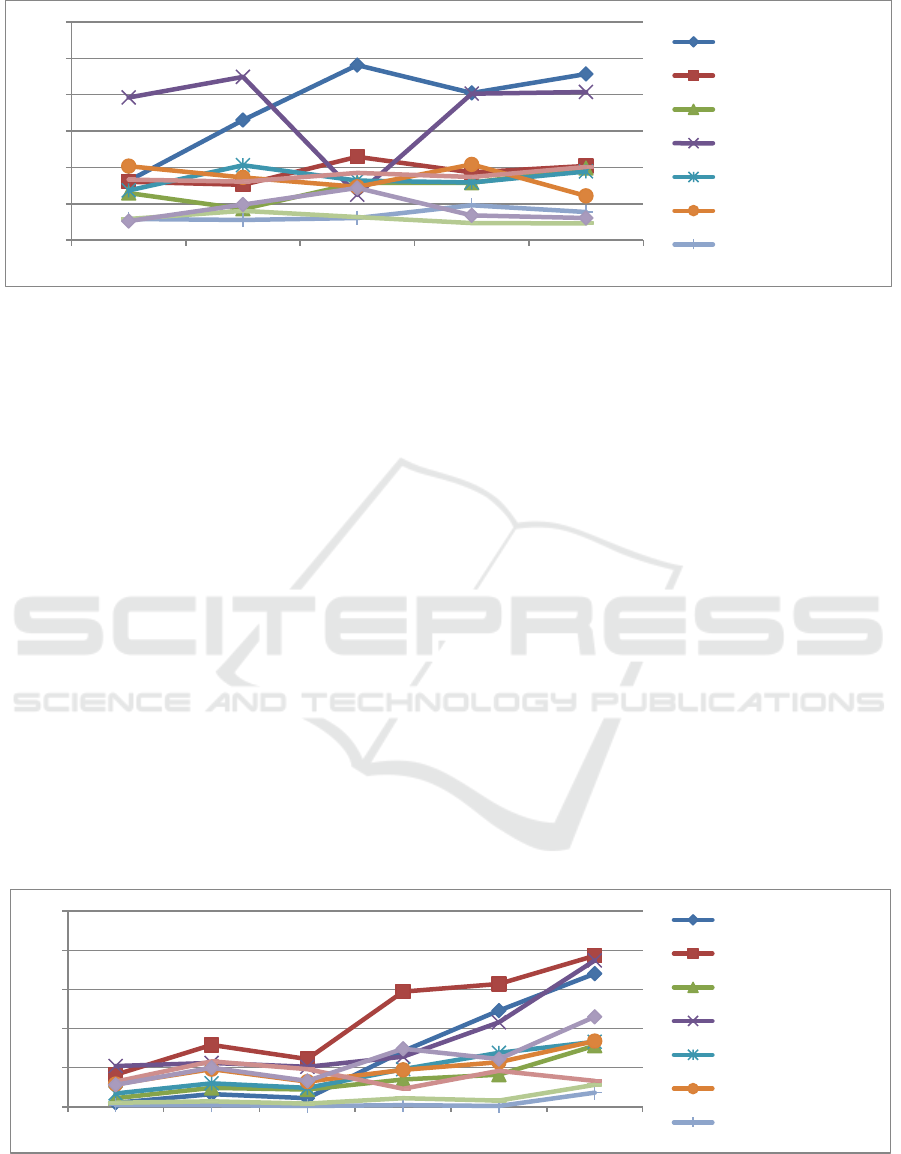
Source: Directorate General of Taxation and Finance, 2017
Figure 1: Actual Capital Expenditures by Province in Sumatra (billion rupiah) Year 2012-2016
Figure 1 illustrates the realization of capital
spending by province in Sumatra Island. The
highest capital expenditures made by Riau Province
in 2012 amounted to 1961.67 billion rupiah and the
lowest capital expenditure undertaken by the Riau
Islands province of 262.34 billion rupiah. From the
picture above we can see that capital expenditures
fluctuates.
These data relevant to result study of local
government district-city in Sumatra of (Susetyo et
al., 2017) that the influence of regional spending to
gross regional domestic product districts-cities is
positive and significant. The bigger local spending
will increase the gross regional domestic product
regencies-cities. Local spending is one form of
government investment to stimulate the local
economic growth.
According Sodik (2007: 8) the portion of capital
expenditures in the budget is a very important
component of expenditures for capital expenditures
will have a multiplier effect in moving the economy
of the area. Therefore, the higher the number the
better the ratio is expected to impact on economic
growth. Conversely, the lower the number, the less
the impact on economic growth.
In macroeconomic theory, in terms of
expenditure, gross regional income is the sum of
many variables including the investment. There are
some things that actually affect in terms of this
investment. Investment itself affected by foreign
and domestic investment. Investments are
happening in the area consists of public investment
and private investment. Investment from the private
sector can come from domestic and overseas
(foreign). The government investment is done in
order to provide public goods. The amount of
government investment can be calculated from the
difference between total government budget by
shopping routine. While private investment consists
of the Domestic Investment (DCI) and Foreign
Direct Investment (FDI), which helps speed
development.
Source: Central Institution of Statistics, 2017.
Figure 2: Realization of Private Domestic Investment Projects by Province in Sumatra (units) Year 2010-2015
0
500
1000
1500
2000
2500
3000
2012 2013 2014 2015 2016
Aceh
Sumatera Utara
Sumatera Barat
Riau
Jambi
Sumatera Selatan
Bengkulu
0
50
100
150
200
250
2010 2011 2012 2013 2014 2015
Aceh
Sumatera Utara
Sumatera Barat
Riau
Jambi
Sumatera Selatan
Bengkulu
Effect of Capital Expenditure, Investments and Human Development Index to Gross Regional Domestic Product Provinces in
Sumatra-Indonesia
403
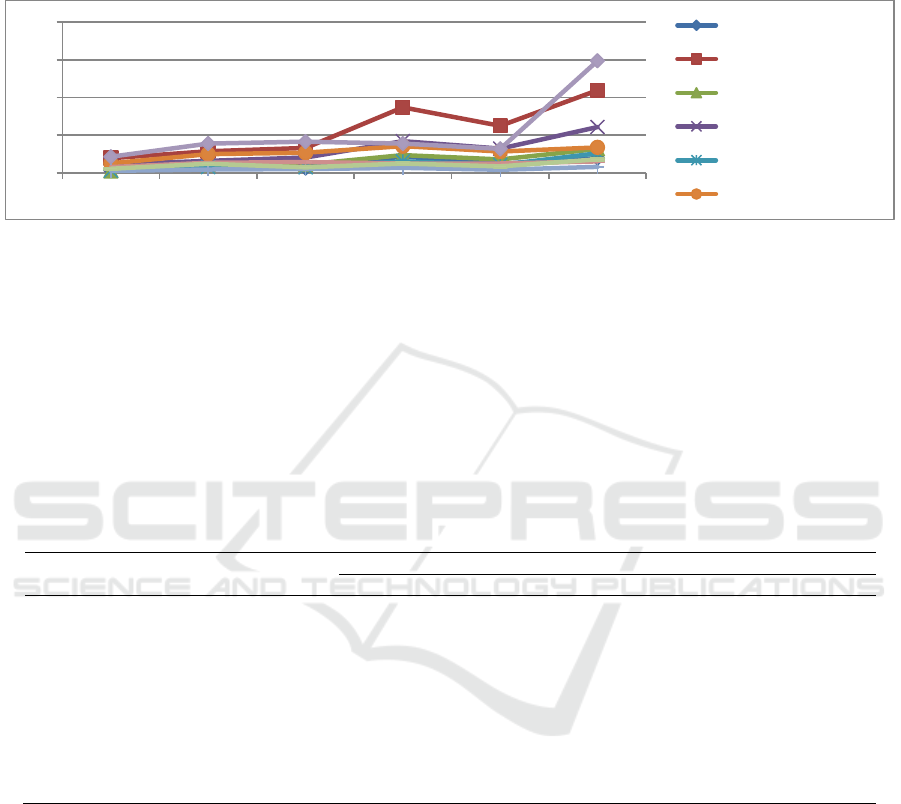
Figure 2 illustrates the condition of private
investment by the Province in Sumatra fluctuation.
The realization of domestic investment projects
(Domestic Investment) were highest in 2015 owned
by the Province of North Sumatra with a total
project cost of 193 units valued at 4.28 trillion
rupiah and the second largest is owned by Riau
Province for 187 projects worth 9.94 trillion rupiah.
Source: Central Institution of Statistics, BPS, 2017
Figure 3: Realization of Private Investment Project PMA by Province in Sumatra(units) Year 2010-2015
Projectrealizationforeigninvestment (PMA) were
highest in 2015, isownedbythe Riau
Islandsprovinceunits as many as 594 projectsworth
640 million US thedollarlater in
thesecondpositionheldbyNorth Sumatra
provinceunits as many as 438 projectsworth 124.6
million US dollars.
Development is one way to improve the quality
of life for the creation of prosperous societies. The
government continues to development in all aspects,
aspects of education, health and a decent life. To
measure the success of the development, one of the
indicators that can be used is the Human
Development Index (Melliana and Zain, 2013: 23).
Table 1: Human Development Index by Province in Sumatra 2011-2015 Year
Provinsi
Tahun
2011
2012
2013
2014
2015
Aceh
72.16
72.51
73.05
73.16
74.28
Sumatera Utara
74.65
75.13
75.55
76.28
76.75
Sumatera Barat
74.28
74.70
75.01
75.25
76.15
Riau
76.53
76.90
77.25
77.56
78.65
Jambi
73.30
73.78
74.35
74.75
75.13
Sumatera Selatan
73.42
73.99
74.36
74.56
75.25
Bengkulu
73.40
73.93
74.41
74.25
75.16
Lampung
71.94
72.45
72.87
73.35
73.13
Kep. Bangka Belitung
73.37
73.78
74.29
74.85
75.35
Kep. Riau
75.78
76.20
76.56
77.24
77.65
Source: CentralInstitution of Statistics (BPS), 2017.
Human Development Index is one measure that
can be used to assess the quality of human
development, both in terms of its impact on the
physical condition of the human being (health and
welfare) as well as non-physical (education) ,
Because in the calculation of life expectancy index,
education index, and the index of decent living
standards involving components of economic and
non-economic quality of education, health and
population, the HDI deemed relevant to be the
benchmark in determining the success of
development (Melliana and Zain, 2013: 237).
1.2 Research Problem
Based on the background description can be
formulated research problem as the following
issues:How does the effect of capital expenditure,
investment (domestic and foreign), and the human
development index to GDP provinces in Sumatra
Island?
0
200
400
600
800
2010 2011 2012 2013 2014 2015
Aceh
Sumatera Utara
Sumatera Barat
Riau
Jambi
Sumatera Selatan
SEABC 2018 - 4th Sriwijaya Economics, Accounting, and Business Conference
404

The purpose of this study is to analyze the effect
of capital expenditures, investment (domestic and
foreign) and the human development index to GDP
provinces in Sumatra Island.
1.3 Benefits Research
This study is expected to provide of theoretical
and practical benefits as follows:
a. Theoretical Benefits: These results are expected
to enrich the research and can be used as a
benchmark for future studies both in the way of
analysis and the results of its analysis. As well
as for other students who may be learning and
assessment process by using disciplines have
been studied which can be used as a source of
data, information, as well as writing and
literature for further research activities.
b. Practical benefits of this research to provide
feedback or information materials for relevant
agencies for consideration or to contribute to
studies related to the effect of capital
expenditure, investment and human
development index on economic growth.
1.4 Theoretical Framework
Economic growth explain or measure the
achievement of economic development of
something. In economic activities, in fact, economic
growth means development of the physical
production of goods and services existing in the
country, such as increasing and the amount of
production of industrial goods, development of
infrastructure, increase the number of schools, the
increase of the production of the service sector and
an increase of the production of capital goods
(Sukirno, 2010: 423).
To explain the requirements that must be met for
a perokonomian can achieve steadfast growth or
steady growth in the long term, the analysis of the
Harrod-Domar use the analogy-analogy follows: (i)
capital goods has reached full capacity, (ii) savings
is proportional to the national income, (iii) capital-
output ratio(capital-outputratio)value, and (iv) the
economy consists of two sectors.
Harrod-Domar theory did not notice
requirements to reach full capacity when the
economy consists of three sectors or four sectors.
However it is based on the theory above can easily
be concluded things that need to apply if the
aggregate expenditure includes more components,
which include government spending and exports. In
such circumstances, capital goods that increase can
be fully used if the AE
1
= C + I
1
+ G
1
+ (XM)
1
where
I
1
+ G
1
+ (XM)
1
isequal to (I+∆I). Through analysis
of the Harrod-Domar can be seen that (i) the long-
term growth of aggregate expenditure prolonged
need to be accomplished to achieve economic
growth, and (ii) economic growth firm would only
be possible if I + G + (XM) continuously increases
with the level of encouraging (Sukirno, 2010: 435).
Wagner put forward a theory about the
development of greater government spending in the
percentage of the GNP which is also based on the
observation well in European countries, the USA
and Japan in the 19th century. Where is Wagner is
the development of government spending in relative
terms, the law of Wagner is in an economy, when
per capita income increases, in relative terms in
government spending will increase
(Mangkoesoebroto, 2001: 171).
Another thing with the theory of Peacock and
Wiseman, the theory is based on an analysis of
government expenditure reception. The government
always tries to enlarge its expenditure by relying
increase tax revenue, but people do not like paying
taxes to finance government expenditures are
growing. Increased tax revenues caused government
spending also increased. Under normal
circumstances the increase in GNP led to greater
government revenues, as well as government
spending becomes larger (Mangkoesoebroto, 2001:
173).
Government spending is one component of
expenditure, then the higher government spending
will result in planned expenditures were higher for
all income levels. If the government spending rises,
the planned expenditure curve shifts upward. The
increase in government spending to encourage the
increase in revenue is greater. Fiscal policy has a
multiplier effectagainst earnings due according to
the consumption function C = C (Y - T), the higher
incomes lead to higher consumption. When the
increase in public spending increase revenues, it also
increases consumption, which in turn increases
income, and increase consumption, and so on.
Therefore, the increase in government spending lead
to a larger income (Mankiw, 2006: 277).
Empirical study has been done of capital
expenditure district-city in Sumatra by Susetyoet al.,
(2018) that the influence of local public utility of
capital expenditures toward GRDP districts-cities is
positive and significant. The greater the capital
expenditures for local public utilities will increase
the GRDP districts-cities in Sumatra. Capital
expenditure for public utility districts and cities into
Effect of Capital Expenditure, Investments and Human Development Index to Gross Regional Domestic Product Provinces in
Sumatra-Indonesia
405

one form of government investment can stimulate
local economic growth.
Human Development Index (HDI) is a measure
for the impact of development performance area that
has a very large dimensions, because it shows the
quality of the population of a region in terms of life
expectancy, education and decent living standards.
HDI is a composite index calculated as the average
of the three indices that describe the basic human
capacity to expand the choices, the life expectancy
index, education index, and a decent standard of
living index (CBS, 2008).
Education and health are fundamental
development objectives; health education and each
also has an important meaning. Health is very
important for well-being, and education are essential
for a satisfying and rewarding life; both are
fundamental in relation to the broader notion of the
improvement of human capability as the core
meaning of the actual construction. At the same
time, education plays an important role to improve
the ability of developing countries to absorb modern
technology and develop the capacity for the
realization of sustainable growth and development.
Moreover, health is a prerequisite for increasing
productivity, and educational success is also
dependent on adequate health. Thus, health and
education can also be seen as a component of a vital
growth and developmentas an input for the
aggregate production function. Their dual role as
input and output at the same time make the health
and education is very important in economic
development (Todaro, 2009: 445).
2 RESEARCH METHODS
The scope of this study to discuss the effect of
capital expenditure, investment (domestic and
foreign) and the human development index to GDP
provinces in Sumatra Island. The study covers ten
provinces, such asNangroAceh Darussalam, North
Sumatra, West Sumatra, Riau, Kepulauan Riau,
Jambi, Bengkulu, South Sumatra, Bangka Belitung,
and Lampung. The data used in this research is panel
data which istime series and a cross-section 2007 to
2016 period.
2.1 Types and Sources of Data
The data used in this research is quantitative data
by category of secondary data.The panel data are
combined between time series and cross- section
dataof the years 2007-2016. The sources of
secondary data were obtained fromwebsite of the
officialthe Statistic Central Institution, the
Directorate General of Taxation and Finance, and
Investment Coordinating Board of Indonesia.
2.2 Method of Analysis
Regression analysis with panel data can be done
in several steps (Yamin, et.al,2011: 200): (a) Pooled
Least Squares Models; (b) Fixed Effects Model
(Least Squares Dummy Variables); )c) Random
Effects Model (REM).
Selection of modelestimationapproaches use the
data panel is determined by using two ways: (1)
Chow test, can be used to decide to use Pooled OLS
Model or Fixed Effects Model (FEM).If the p-value
cross section F <0.05, H
0
isrejected. (2) Hausman
test, can be used to decide using the Fixed Effects
Model (FEM) or Random Effects Model (REM).If
the p-value Chi-square cross section <0.05, H
0
isrejected.
Hypothesis testing is done to see the significance
of parameters by using: (1) F-test or simultaneously
test used to prove the hypothesis that the overall
coefficient simultaneously regression significant
influence in determining the value of the dependent
variable. If the entire value of the regression
parameter is equal to zero, it can be said that there is
no linear relationship between the dependent
variable and independent variables. (2) t-test or test
each partial variable. Testing using t-test aims to see
the level of significance of the effect of each
independent variable assuming the other
independent variables held constant. If the value of
the t statistic <t table, then the zero hipotetsis
accepted. This means between independent and
dependent variables did not affect significantly.
Conversely, if the value of the t statistic> t table,
then hipotetsis zero is rejected, in other words, the
alternative hypothesis is accepted, which means
significant independent variable on the dependent
variable.
3 RESULT AND DISCUSSION
There are three techniques fundamental approach
used in estimating the regression model with panel
data, namely: (a) Model Pooled Least Square;(b)
Fixed Effect Approach Model and (c) Random
Effect Approach Model.
SEABC 2018 - 4th Sriwijaya Economics, Accounting, and Business Conference
406

Estimation Results Regression with Method
Pooled Least Square
The calculation results using a panel data
regression modeling techniques Pooled Least Square
asthe following.
Table 2: Estimation Results Regression with Method Pooled Least Square
Variable
Coefficient
Std. Error
t-Statistic
Prob.
C
-1546084.
354489.5
-4.361439
0.0000
BM
39.37229
12.05299
3.266600
0.0015
I
8.755284
1.308530
6.690932
0.0000
IPM
21655.37
4828.812
4.484617
0.0000
R-squared
0.651486
Mean dependent var
138859.9
Prob(F-statistic)
0.000000
Based on estimates presented in Table 2 can be
seen that the Capital Expenditure (BM) has a
coefficient value of 39.37229 and the probability of
0.0015.It is claimed that there is positive and
significant, while Investment (I) have a coefficient
of 8.755284, which means positive and significant
impact with the probability 0.0000. From the
estimation can also be seen that the Human
Development Index (IPM) has a coefficient value of
21655.37 and probability of 0.0000, which means
positive and significant impact. With a coefficient
value of -1546084 which assumes that the value of
the intercept between individuals are considered
equal where this is the assumption that severely
limit, so themethods Pooled Regression can not
catch the real picture on the relationship between the
dependent variable with independent and too simple
to describe the phenomenon which exists. Therefore
thing to do is to process the data using Fixed Effect.
Estimation Results Regression with Method
Fixed Effect
Panel regression output results with Fixed Effect
methods can be seen in the Table.
Table 3: Estimation Results Regression with Method Fixed Effect
Variable
Coefficient
Std. Error
t-Statistic
Prob.
C
-2332434.
374835.0
-6.222562
0.0000
BM
19.28110
15.66544
1.230805
0.2217
I
3.773998
1.265323
2.982636
0.0037
IPM
32858.29
5157.132
6.371426
0.0000
Effects Specification
Effect of Capital Expenditure, Investments and Human Development Index to Gross Regional Domestic Product Provinces in
Sumatra-Indonesia
407

Cross-section fixed (dummy variables)
R-squared
0.837207
Mean dependent var
138859.9
Adjusted R-squared
0.814753
S.D. dependent var
128240.9
S.E. of regression
55195.33
Akaike info criterion
24.79588
Sum squared resid
2.65E+11
Schwarz criterion
25.13455
Log likelihood
-1226.794
Hannan-Quinn criter.
24.93295
F-statistic
37.28511
Durbin-Watson stat
1.000954
Prob(F-statistic)
0.000000
Coefficient Capital Expenditure (BM) of
19.28110 showsthatthereis a positivecorrelationtothe
GDP with a probabilityvalueCapital
expenditureamountedto 0.2217 where 0.2217
isgreaterthanalpha 5
percentsothattheindependentvariableis not
significanttothe GDP. Investment (I) is also a
positive influence on the GDP with acoefficient of
3.773998 and probability of 0.0037, which means
investing significantly affect the GDP due to the
probability value is greater than alpha 5 percent.
Similarly, the HDI has a coefficient of 32858.29,
meaning IPM positive effect on the GDP. HDI has a
probability of 0.0000. This indicates that the HDI
significantly affect the GDP.
R-squared value of 0.837207 indicates
thatthevariable Capitalexpenditure (BM), investment
(I) and HDI are abletoinfluencethe GDP amountedto
83.72 percentandtheremaining 16.28
percentisexplainedbyothervariables.
Results Regression Estimation Method with
Random Effect
Table 4: Estimation Results Regression with Method Random Effect
Variable
Coefficient
Std. Error
t-Statistic
Prob.
C
-2154363.
352822.1
-6.106089
0.0000
BM
27.53116
14.05931
1.958215
0.0531
I
4.691863
1.209599
3.878858
0.0002
IPM
30295.58
4835.968
6.264636
0.0000
Effects Specification
S.D.
Rho
SEABC 2018 - 4th Sriwijaya Economics, Accounting, and Business Conference
408

Cross-section random
54301.61
0.4918
Idiosyncratic random
55195.33
0.5082
Weighted Statistics
R-squared
0.583770
Mean dependent var
42492.87
Adjusted R-squared
0.570763
S.D. dependent var
85657.94
S.E. of regression
56119.82
Sum squared resid
3.02E+11
F-statistic
44.88059
Durbin-Watson stat
0.932240
Prob(F-statistic)
0.000000
Unweighted Statistics
R-squared
0.605792
Mean dependent var
138859.9
Sum squared resid
6.42E+11
Durbin-Watson stat
0.523153
Based on estimates using Random Effectmethod
it is known that the R-squared value of
0.583770,meaning that 58.37 percent of the GDP
variable is affected bythevariable Capitalexpenditure
(BM), investment (I) and IPM andtheremaining
41.63 percentisinfluencedbyothervariables.
In the method of Random Effect, Capital
Expenditure (BM) has a coefficient of 27.53116,
means capital expenditure to GDP has a positive
relationship with probability equal to 0.0531. The
probability that results frommethod Random Effect
showed that the relationship between capital
expenditure in the GDP is not significant.
In contrast to the Investment (I) which has a
coefficient of 4.691863 and probability of 0.0002,
meaning that the investment has a positive and
significant relationship to GDP. Likewise with HDI,
the results of estimation usingmethod, Random
Effectresulting HDI coefficient of 30295.58,
meaning that there is a positive correlation to GDP
with a probability of 0.0000 which indicates that the
relationship is significant.
Chow Test (Common Effect vs. Fixed Effect)
Model selection with Common Effect or Fixed
Effect can be done by testing Likelihood Ratio Test
provided that if a significant probability value
generated by the α (alpha) then the decision could be
made by using a model FixedEffect. Selection of
panel data model using the Chow test, by comparing
the p-valueChi-square cross section of the
significance level of 0.05.Chow test in this study
carried out by meanstest Likelihood available on the
program
Table 5: Regression Results withChow Test
Redundant Fixed Effects Tests
Equation: ESTIMASI
Test cross-section Fixed Effects
Effect of Capital Expenditure, Investments and Human Development Index to Gross Regional Domestic Product Provinces in
Sumatra-Indonesia
409

Effects Test
Statistic
d.f.
Prob.
Cross-section F
11.028131
(9,87)
0.0000
Cross-section Chi-square
76.119880
9
0.0000
Based on test results known that the probability
of a Chi-square cross section of 0.0000 while
significant value α is 5 percent so that H
0
rejected
and H
1
accepted.
Hausman Test (Fixed Effects vs Random
Effect)
This test aims to compare methods Fixed Effect
and methods Random Effect. Hausman test is done
by comparing the p-value random cross section of
the significance level of 0.05. Hausman test on the
research carried out by means Hausman test
available. The test results can be seen in the
following table:
Table 6: Results of the Hausman TestRegression with
Correlated Random Effects - Hausman Test
Equation: ESTIMASI
Test cross-section Random Effects
Test Summary
Chi-Sq. Statistic
Chi-Sq. d.f.
Prob.
Cross-section random
6.242794
3
0.0104
From Hausman test known that probability
radom cross section of 0.0104 and less than the
significance level α which is 5 percent, so that the
decisions taken at this Hausman test is H
0
rejected
and H
1
accepted. Thus the election decision making
model estimation method used is the method Fixed
Effect.
The estimation result of the fixed effect model as
follow:
GDP = -2332434 + 19.28110 BM + 3.773998 I +
32858.29 IPM + e
(-6.222562) (1.230805) (2.982636)
(6.371426)
R-squared
0.83720
7
Mean dependent
var
138859
.9
Adjusted R-
squared
0.81475
3
S.D. dependent
var
128240
.9
S.E. of
regression
55195.3
3
Akaike info
criterion
24.795
88
F-statistic
37.2851
1
Durbin-Watson
stat
1.0009
54
Prob(F-statistic)
0.00000
0
Hypothesis Test
The F-test is a hypothesis test equipment to see if
together (simultaneously) the regression coefficient
of the independent variables affect the dependent
variable. F test can be seen by comparing the value
SEABC 2018 - 4th Sriwijaya Economics, Accounting, and Business Conference
410

of the F-statistic with the F-table or by comparing
the F-statistic probability with a significance level (α
= 5%).
By the estimation results indicate that the
probability of an F-statistic showed a value of
0.000000, this means that the probability F-statistic
is less than 0.05 then H
0
is rejected. That is, it can be
concluded that the variable capital expenditure,
investment and human development index
significantly affect the GDP provinces in Sumatra
Island.
The student t-test a hypothesis test to see whether
partial regression coefficients of independent
variables affect the dependent variable. The t-test
can be seen by comparing the value of t-statistic
with t-table, or comparing the t-statistic probability
with a significance level (α = 5%).
By the estimation results indicate that the t-
statistic variable capital expenditure amounted to
1.230805,where the value of t-statistic is smaller
than t-table(1,230 805 <2.353), then H
0
is received,
which means that the variable capital expenditure
does not significantly influence the GDP provinces
in Sumatra Island. In addition, the probability of a t-
statistic on the t-test is at 0.2217,where the value is
greater than 0.05 (t-statistic 0.2217>0.05).
Investment variable has a value of t-statistic of
2.982636,where the value of t-statistic greater than t-
table (2.697663> 2.353), then H
0
is rejected, which
means that the investment variables significantly
influence the GDP provinces in Sumatra Island. In
addition, the probability of a t-statistic on the t-test is
at 0.0037,where the value is less than 0.05 (t-statistic
0.0037 <0.05).
From the estimation, it is known that the human
development index variable has a value of t-statistic
of 6.371426, where the value of t-statistic greater
than t-table (6.371426>2.353) then H
0
isrejected, it
means a significant effect on the human
development index to provinces in Sumatra Island. It
can also be seen from the t-statistic probability of
0.0000 which is smaller than the significance level
of 0.05.
The result of the study has some implications
related to the theory of regional growth. Based on
the estimated model which the effect of the capital
expenditure, investments, and human development
index has significant to gross domestic product
province in Sumatra. The coefficient determination
of fixed effect models about 83.72 percent. It means
all variable independent can explain significantly to
the dependent variable and the residual explained by
others variables about 16.28 percent such as
improving public facilities in infrastructure,
education, and health expenditure will improve
human quality.
Some of implications on the policy by
maintaining the stability of the economy, politics
and security in the country, improve the facilities
and infrastructure which support the projects, and
making simplify the rules in investing program. For
the purposes of further research is that the study
should be extended by using proxy of variables so
that the estimation model can be used to advance the
provinces in Sumatra.
4 CONCLUSIONS
ANDRECOMMENDATIONS
Based on the analysis and discussion above, it
can be taken some conclusions such as:
1. The effect of capital spending, investments,
and human development index to GDP
province is simultaneously positive and
significanteffect.
2. The partial estimation that capital expenditures
have a positive relationship to the GDP but
partially no effect significantly to
GDPprovince.Investment (domestic and
foreign) have a positive relationship to the
GDP provinces in Sumatra Island. Human
development index has a positive relationship
to the GDP provinces in Sumatra Island.
3. Coefficient of determination of fixed effect
method showed that capital spending,
investment, and human development index
explained significantly to the GDP province in
Sumatra. The residual explained by others
variables such as improving public
facilities,regionalinvestment climate,
education, and health expenditure will improve
human quality.
Based on the analysis, discussion, and
conclusions that have been presented, the
recommendation as follow:
1. The capital expenditure should be allocated
appropriately and proportionately to investment
projects whose benefits could be felt by the
people so that they can provide significant
impact on the growth of regional gross
domestic product.
2. The local government is expected to increase
investment Domestic Investment (DCI)
through a policy of maintaining the stability of
the economy, politics and security in the
country, improve the facilities and
Effect of Capital Expenditure, Investments and Human Development Index to Gross Regional Domestic Product Provinces in
Sumatra-Indonesia
411

infrastructure which support and simplify the
rules in investing so as to increase the GDP
provinces in Sumatra Island.
3. The local government is expected to attract
foreign investment by creating a climate
conducive to investment, simplification of the
licensing process, as well as improving the
quality of human resources so that the expected
value of Foreign Direct Investment (FDI) can
be increased and can push the GDP provinces
in Sumatra Island.
4. Government policies should be oriented
towards social welfare. By improving public
facilities in infrastructure, education and health
will improve human quality that the human
development index numbers will increase
which in turn will push the GDP provinces in
Sumatra Island.
REFERENCES
Jhingan, ML., 2007. Economic
DevelopmentandPlanning,King Grafindo Persada, Jakarta.
Mangkoesoebroto, Guritno, 2001. Public
Economics,Issue3, BPFE, Yogyakarta.
Mankiw, N. Gregory,. 2006. Makroekonomi,Edisi ke-6,
Penerbit Erlangga, Jakarta.
Melliana, A dan Zain, I. 2013. Analisis Statistika Faktor
yang Mempengaruhi Indeks Pembangunan Manusia di
Kabupaten/Kota Provinsi Jawa Timur dengan
Menggunakan Regresi Data Panel. Jurnal Sains dan
Seni Pomits Vol. 2, No.2, (2013) 2337-3520 (2301-
928X Print).
Sodik, Jamzani. 2007. Pengeluaran Pemerintah dan
Pertumbuhan Ekonomi Regional. Jurnal Ekonomi
Pembangunan Vol. 12 No. 1, April 2007 Hal: 27-36.
UPN Veteran, Yogyakarta.
Sukirno, Sadono. 2010. Makroekonomi: Teori Pengantar
Edisi Ke-3, Rajawali Pers, Jakarta.
Susetyo, Didik, Zunaidah, Siti Rohima, Devi Valeriani,
Abdul Bashir (2018). “Impactof Capital
ExpenditureandPublicUtilityCustomerstoEconomic
Development ofDistrict-City in Sumatra-Indonesia",
International JournalofEconomicsand Financial
Issues, 2018, 8(1), pp.126-135, ISSN: 2146-4138
availableat http: www.econjournals.com
Susetyo, Didik, Zunaidah, Siti Rohima, Anna Yulianita,
Devi Valeriani, M. Adam, 2017, “Expenditure
Analysis of Local Government and Regional
Economic Development District/City of Ten Province
in Sumatra Island Indonesia”, INTERNATIONAL JOURNAL
OF APPLIED BUSINESS AND ECONOMIC RESEARCH,ISSN:
0972-7302: SCOPUS Index Journal and JEL Index,
Vol.15, No.3, 2017, pp. 17-43.
Todaro, MP. dan Smith, SC, 2009. Pembangunan
Ekonomi,Edisi Kesebelas, Jilid 1, Penerbit Erlangga,
Jakarta.
Yamin, dkk,. 2011. Regresi dan Korelasi dalam
Genggaman Anda, Salemba Empat, Jakarta.
SEABC 2018 - 4th Sriwijaya Economics, Accounting, and Business Conference
412
